Measures for benefits realization.
BREESE, Richard, JENNER, Stephen, SERRA, Carlos, THORP, John, BADEMI, Amgad and CHARLTON, Michael
Available from Sheffield Hallam University Research Archive (SHURA) at: http://shura.shu.ac.uk/18957/
This document is the author deposited version. You are advised to consult the publisher's version if you wish to cite from it.
Published version
BREESE, Richard, JENNER, Stephen, SERRA, Carlos, THORP, John, BADEMI, Amgad and CHARLTON, Michael (2018). Measures for benefits realization. Project Report. Report produced by Sheffield Hallam University for the Project Management Institute.. (Unpublished)
Copyright and re-use policy
See http://shura.shu.ac.uk/information.html
1
Exhibit E
2017 RESEARCH INFORMED STANDARDS
Measures for benefits realization
TABLE OF CONTENTS
1.
Executive Summary
Page 22.
Introduction, questions asked and summary answers
Page 63.
Methodology
Page 104.
Findings – Detailed responses to each research question
Page 145.
Reflections
Page 696.
Conclusion and Recommendations
Page 767.
Appendices
Page 792
1. Executive Summary
This analytical literature review on ‘Measures for benefits realisation’ is concerned with metrics and the measurement of outcomes in benefits realization. The brief was to address six
questions, as outlined below.
1. What is the ‘state of the art’ in measuring benefits?
2. At what point(s) in the project are outcome benefits measures developed, defined and selected?
3. Who assesses the benefits and at what point during the project are they assessed?
a. Are measures added over the life of the project and/or beyond?
b. How far after the close-out of the project are benefits continued to be assessed, and at what intervals?
4. Does this vary by project type (e.g., change project, innovation or new product
development, etc.) or by industry, project size, potential social impact, or even who the customer is?
5. What kinds of measures are typically used to assess benefits, specifically Quantitative and/or Qualitative, and which are more frequently used? Does this vary by the same dimensions as #4 above?
6. What happens with a gap between benefits accountability and project implementation?
The research undertaken was a literature review of documentation in the English language. Four different sets of literature have been investigated
- Government body (aimed for comprehensive coverage of documents –67 in total) - Professional body (aimed for comprehensive coverage of documents – 42 in total) - Consultant/practitioner (systematic coverage limited to books and published consultant
reports – 24 in total).
- Academic (literature search identified 127 relevant academic sources).
Having analysed these 260 documents against the six questions, certain headline characteristics of the current position on benefits measurement emerged. These led the team to draw
3
The study has identified a ‘knowing-doing’ gap in benefits measurement, whereby there is a gap between what should be and what is, in terms of ‘state of the art’ as described in the guidance, and the ‘state of the art’ as evidenced in current practice. Guidance is accessible but there is less evidence easily available describing existing practice, because much of that
evidence is in academic sources. Therefore,
Recommendation 1 is that there should be more initiatives to make the evidence on practice on benefits measurement and management more accessible to practitioners and other interested parties.
There are terminological inconsistencies affecting benefits measurement, for example, in the different relationships between the terms ‘outcome’ and ‘benefit’ in different guidance sources. There are also a variety of different dualities (paired terms) used to categorise outcomes and/or benefits, such as intermediate/end, leading/lagging and short term/long term. The roles of projects, programs and portfolios in benefits realisation translate across into benefits measurement, so clear terminology is required to enable clear and consistent
messages to be provided in guidance. This will help with clarity on what needs to be measured and how it is to be measured (in conjunction with Recommendations 3 and 5 below, on
ownership of the process). Therefore,
Recommendation 2 is that consistent and clear sets of terms be developed for guidance on the causal relationships involved in strategic alignment of project activity, incorporating program and portfolio levels where organisations utilise these levels, which will in turn facilitate the benefits measurement process. This links especially directly into the use of benefits dependencies/mapping tools.
P3M does not exist in isolation - it exists within the broader context of overall enterprise governance and management - from strategy through to operations. The diverse roles of different stakeholders in all aspects of P3M are increasingly recognised, but the stakeholder-specific implications of benefits targets are not always appreciated. There is a need for clear ownership of the BRM process and for the owners to involve key stakeholders in identifying benefits and developing benefits measures and targets, and then also keep them engaged during the benefits life-cycle, so the whole organisation is committed to the optimisation of benefits. Key stakeholder groups include users and may include funders, but could also cover any individual or group with high power and high interest. Therefore,
Recommendation 3 is that guidance needs to build on progress towards owners of the BRM process engaging key stakeholders in the development of benefits measures and
4
Developing the theme of the benefits life-cycle, there has been some progress towards the incorporation of an emergent approach to benefits measures and an emphasis on the post-implementation phase as a focus for benefits realisation. However, this needs to go further. Therefore,
Recommendation 4 is that guidance needs to emphasise the importance of benefits
measurement and management over the whole life-cycle, taking an emergent approach that stresses benefits realisation post-implementation.
While there are many areas in which progress is being made, a key challenge remains accountability for benefit identification and realisation at the Executive and Board levels in organisations, which is essential if potential long term benefits after handover are to be achieved. Equally well, operational managers can compromise the achievement of long term benefits if they do not take ownership for the benefits and therefore do not see benefit realisation as an integral part of their role, linked to strategic priorities. Therefore,
Recommendation 5 is that the P3M community needs to explore further ways of encouraging an enterprise-wide culture of value, from the Board through to operations, to enable
potential benefits from investment in change to be realised.
Identification of benefits measures, addressing measurement issues such as quantification and monetisation, setting targets, tracking benefits, incorporating emergent benefits and
maximizing long term commitment to the measurement and management of benefits all have many challenges. Some of these are technical, but they mainly concern behaviours and attitudes. Generally these issues have to be addressed in relation to the opportunities and constraints in different organisational contexts. Therefore,
Recommendation 6 is that guidance needs to set a framework which enables different
categories of investment and business sectors to adopt approaches to benefits measurement and management which fit their own context.
The study has found that there is much descriptive evidence on benefits measurement available, but that there are also many research gaps, some of which might be filled through inter-disciplinary working with researchers in areas such as change management, investment appraisal, evaluation and performance measurement/performance management. However, there is also a need for further research into many areas of benefits measurement and management. Examples include
- In-depth studies of the whole benefits life-cycle
5
- Roles in benefits measurement and management, particularly in terms of the variety of individuals and groups involved in different tasks at different levels
- The use of different benefits dependencies/mapping techniques and the influence of terminology on their effectiveness.
Therefore,
Recommendation 7 is that opportunities to increase inter-disciplinary collaboration with allied research areas should be promoted.
and
6
2. Introduction, questions asked and summary answers
This analytical literature review is concerned with metrics and the measurement of outcomes in benefits realization. Our brief was to address six questions, as outlined below, with details of the proposed approach:
1. What is the ‘state of the art’ in measuring benefits?
Under this question, both normative guidance on how to measure benefits and
descriptive evidence on existing practice will be included. We will look across the broad spectrum of approaches to develop a speculative analysis (best “guestimate”) of where the field is headed with regard to measuring benefits as well as a perspective on which, of the emerging measures, we anticipate may prove most useful.
The study will cover project, programme and portfolio levels. In the questions below, wherever ‘project’ is mentioned, our study will also incorporate programme and portfolio levels.
2. At what point(s) in the project are outcome benefits measures developed, defined and selected?
This question is concerned with timing, but will also address different types and levels of benefit. Particular attention will be paid to measures for ‘outcome’ benefits’ (other terms are sometimes used, such as ‘final’ or ‘end’ benefits) but the measures for other ‘intermediate’ benefits will also be analysed, and interdependencies between
intermediate and outcome benefits investigated.
We will seek to identify literature that maps different stakeholders to stakeholder-specific benefits (intermediate or outcome).
3. Who assesses the benefits and at what point during the project are they assessed?
a. Are measures added over the life of the project and/or beyond?
b. How far after the close-out of the project are benefits continued to be assessed, and at what intervals?
The term 'assess' in the question is taken to include identification, monitoring,
7
4. Does this vary by project type (e.g., change project, innovation or new product development, etc.) or by industry, project size, potential social impact, or even who the customer is?
The dimensions eventually chosen for this question will depend on the amount of evidence available. For example, public/private/voluntary sector may be a key categorisation, and perhaps degrees of project risk. Various different ways of
categorising projects will be investigated by grouping industries according to metrics-related characteristics. For example, application development projects vary from physical construction projects in the relevance of interim measures.
5. What kinds of measures are typically used to assess benefits, specifically Quantitative and/or Qualitative, and which are more frequently used? Does this vary by the same dimensions as #4 above?
Under this question we will investigate issues such as: whether the type of measures has changed over time? Are mixed methods used? Are there specific
industries/environments/project types that rely on one kind of measure more than another? If so, what is/are the underlying reasons?
We will include the use of methods of ‘quantifying’ qualitative measures, such as Likert Scales for attitudes and feelings, in relation to the balance of quantitative/qualitative metrics.
6. What happens with a gap between benefits accountability and project implementation?
This question will be concerned with the focus on BRM being lost during
implementation of the project or after it has been completed, specifically in relation to accountability for benefits measurement. It will link closely to Question 2 (timescale issues with metrics) and Question 3 (‘who’ is responsible for metrics) since the development of a gap between benefits accountability and project
8
The research project was carried out in the second half of 2017, based on the schedule of activities outlined below
.
The research undertaken was a literature review of documentation in the English language. As with the team’s first report for the PMI, four different sets of literature have been investigated
- Government body (aimed for comprehensive coverage of documents –67 in total) - Professional body (aimed for comprehensive coverage of documents – 42 in total)
- Consultant/practitioner (systematic coverage limited to books and published consultant reports – 24 in total).
- Academic (literature search identified 127 relevant academic sources)
The next section is ‘methodology’, which outlines how the framework for undertaking the literature searches was decided upon, and the detailed methods used for each review and the presentation of the results.
The ‘findings’ section addresses the six questions, summarizing the relevant information from each literature type.
The ‘reflections’ section is concerned with the main implications of the research. It sets out the main conclusions for each of the six questions.
The ‘conclusions and recommendations’ section makes eight recommendations based upon the analysis carried out in the report. These recommendations are concerned with the promotion of good practice in
15-May 15-Jun 16-Jul 16-Aug 16-Sep 17-Oct 17-Nov 18-Dec
Review, clarify and finalise scope Project Initiation Update literature source lists Develop templates for literature analysis Detailed plan submitted Government Body literature - analysis Professional Body literature - analysis Practitioner/Consultant literature - analysis Academic sources literature - analysis Guidance on metrics in BRM - results Interim summary of findings - normative Update source lists (June - October, 2017) Existing practice in metrics for BRM - results Review of other literature domains Synthesis of findings/prepare final report Submit final report
9
benefits measurement and management. We found no shortage of guidance on how to undertake benefits measurement, but the descriptive evidence of benefits measurement practice does not match up to it. There is also a shortage of detailed case study material, with the exception of the IT-enabled change field. Our report draws attention to guidance and examples which could be used to illustrate how to undertake benefits measurement, but our conclusion from this evidence and our collective experience is that there is a gap between what should be and what is, in terms of ‘state of the art’ as described in the guidance, and the ‘state of the art’ as evidenced in current practice.
Therefore, the report recommendations concentrate on a variety of actions of different types which might help to close that gap.
.
The report has been prepared by
Dr. Richard Breese, DBA, MAPM, FHEA (Sheffield Business School, Sheffield Hallam University) (Principal Investigator)
Stephen Jenner, CIMA, MBA, FCMA, FAPM (Portfolio Solutions) Carlos Serra, PMP, PRINCE 2, MCT (Independent researcher) John Thorp, CMC, ISP, ITCP (The Thorp Network)
10
3. Methodology
The original brief for the work specified that the report cover projects and, if possible, programs and portfolios as well. A key principle shared by the team is that where organisations utilise programs and portfolios as well as projects, benefits management/benefits realization management (BM/BRM) has to be applied across all three levels, so this was our starting point.
The method built on that employed for our first BRM RIS project, adapted to fit with the nature of the brief for ‘Measures for benefits realization’. The analytical literature review was based upon the four literature areas in the first study. Since the first project was undertaken, further documents have been published, such as the PMI’s own Thought Leadership Series on Benefits Realization Management. Therefore, one of the first tasks was to update the literature searches for each of the four areas, with
the focus being primarily on the topic of ‘measures’ and the context in which BRM uses them, with additional literature specific to this topic.
Following this exercise, the number of sources covered was,
- Government body 67 sources (58 in the first study)
- Professional body 42 sources (31 in the first study)
- Consultant/practitioner 24 sources (21 in the first study)
- Academic 127 sources (97 in the first study)
A further preliminary task was to develop the templates to be used for each of the four literature areas. It was decided to draw information to address the final question, Question 6, from the analysis of the other five questions. Even so, the five questions and the sub-elements within them meant that it was difficult to fit all the data to be collected into tabular format, without the columns becoming narrow. We therefore experimented with different approaches, with the result that the format of the tables for the Government Body and Consultant/practitioner reviews are slightly different from those used for the Professional Body and Academic reviews. The column headings nevertheless ensured that data was collected systematically and consistently across the different sources in each literature area, and ensured that the information recorded mapped onto the research questions.
The investigation of measures has two main areas, which cut across all six questions,
- guidance of a normative, ‘how to do it’ nature
- descriptions of existing practice, which sub-divide further into, for example, best practice and typical practices.
11
there is a lot written about IT-enabled change, but little on other sectors. A brief section in the reflections chapter is therefore devoted to other literature domains which might help to fill some of those gaps, from a different perspective (perhaps addressing benefits measures issues, but using different terminology).
The following sub-sections outline the sources used and search methods for each literature review.
Government Bodies Literature Search
We aimed to be comprehensive for sources in the English language. Publications from the following jurisdictions/bodies were reviewed, including some new sources recently published or ones which were particularly relevant to the subject matter for the research project,
United Kingdom: OGC (Now Axelos – a joint venture between the Cabinet Office and Capita); HM Treasury; Cabinet Office; and the National Audit Office.
UK Devolved administrations: Welsh Government & N Ireland Department of Finance & Personnel.
Europe – Germany.
Canada Treasury Board Secretariat.
USA - Office of Management and Budget (OMB); GAO; Legislation (Program Management
Improvement and Accountability Act 2015; Government Performance and Results Modernization Act 2010; and Government Performance and Results Act 1993); White House Circular No. A-94 Revised; CIO Council; National Electronic Commerce Coordinating Council; and Intergovernmental Advisory Board, Federation of Government information Processing Councils.
Australia – federal government and state governments – NSW, Queensland, Tasmania, Western Australia, and Victoria.
New Zealand
Inter-jurisdictional guidance including: the Better Business Cases initiative (UK, Welsh and New Zealand governments); World Bank; OECD; and European Commission-funded studies.
67 sources were reviewed, compared to 58 in the first study.
In the relevant section in Chapter 4 (Section 4.1), government bodies sources are cited using ‘GSR’ for ‘government sources review’, with a number which corresponds to the first column in Appendix 1.
Professional Bodies Literature Search
12
Information Systems Audit and Control Association); International Centre for Complex Project Management (ICCPM); and relevant ISO standards.
The analysis of the publications from these professional bodies is contained in Appendix 2, listed in order of professional body.
The analysis includes some new sources which have been published in 2016 and 2017, including the PMBoK (6th edition), a series of Thought Leadership reports on Benefits Realization
published by the PMI and new publications from the APM, ISACA and ISO. 42 sources are covered, compared to 31 in our 2016 report to the PMI on BM/BRM terminology.
In the relevant section in Chapter 4 (Section 4.2), professional bodies sources are cited using ‘PBR’ for ‘professional bodies review, with a number which corresponds to the first column in Appendix 2.
Consultants/Practitioner Literature Review
The systematic literature review covered
- Practitioner/consultant books - Consultancy publications.
As with the first study, other categories of consultant/practitioner outputs were not used, because of the reduced credibility of such sources compared to the ones we did use.
24 sources were reviewed, compared to 21 in our first study.
In the relevant section in Chapter 4 (Section 4.3), consultant/practitioner sources are cited using ‘CPR’ for ‘consultants/practitioners review’, with a number which corresponds to the first column in Appendix 3.
Academic publications Literature Search
13
The search terms used were:
Benefits+Management
Benefits+Realis(z)ation+Management
Benefit+Management
Benefit+Realis(z)ation+Management
These terms were fed into three databases
Google Scholar(title only)
Science Direct (keyword)
EBESCO (Business Source Premier) (keyword)
After the results were manually screened, this resulted in a list of 97 academic publications.
For this second study, a search was undertaken using the same method for additional
publications from 2016 and 2017, which post-date the searches for the first study. In addition, further books and academic theses which did not come up on the search results, and older sources referenced in the literature of particular relevance to benefits measures were added. This resulted in the total number of academic sources rising from 97 to 127.
14
4. Findings – Detailed responses to each research question
Introduction
The findings are structured based upon each literature review, rather than using the questions as the primary structuring dimension. We took this approach because of the overlap between the questions. It seemed that following through the characteristics of a group of sources against the questions in turn would help the flow of the argument in this particular context.
The reflections chapter is the place for a summary of the key points against each question to be covered, based upon the combined results of the four literature areas.
In reviewing the scope of the four literature areas, in general, the boundaries were clear. The main grey area concerns books on BRM. If books are written by academics, and draw from material which has also appeared in academic journals or academic conferences, then they are included in the academic literature review, e.g. Ward and Daniel (AOR88). If the book has been published by a Government agency or professional body and appears to represent the policies/views of that organisation, it is included in the Government Body or Professional Body review, e.g.Bradley, ‘Fundamentals of Benefits Realisation’ (OGC) (GSR6). Other books were included in the Consultants/Practitioner literature review.
15
4.1 Government Body Sources
Q1: What is the “state of the art” in measuring benefits? (Normative/descriptive, Project, Program or Portfolio)
Four broad categories of guidance were reviewed
BRM guidance issued to/by the P3M community.
Cost-benefit/business case guidance issued by central finance bodies.
e-Gov benefits literature.
Literature from audit bodies on how well the guidance is working i.e. to what extent is the guidance applied and does it work?
The sources in each category are:
Government PPM Benefits Management guidance – OGC/Axelos MSP® (GSR1) guidance in particular. Key sources include – UK (MSP (GSR2) & Bradley (GSR6), MoP® (GSR3), Northern Ireland), Canada, New Zealand, and Australian State governments, particularly Victoria and NSW.
Business Case & Cost-Benefit Analysis Guidance - Key Sources: HMT Green Book
(GSR20), BBC initiative (Wales, England, NZ) (GSR32), SROI (GSR27), US Circular No. A-94 Revised (GSR40), and Queensland (GSR53, GSR55).
e-gov benefits - Key Sources: HM Treasury (GSR25), VMM (GSR47), DVAM/NOIE study (GSR48); Intergovernmental Advisory Board, Federation of Government information Processing Councils (GSR36); OECD (GSR45); Foley (GSR64); and eGovernment Economics Project – Measurement Framework Final Version (2006, GSR65).
Literature on measurement/forecasting accuracy and benefits realisation measurement in practice – Key Sources: Mott McDonald report (GSR22), Green Book supplementary guidance (GSR23), and the NAO (GSR28, GSR30, GSR31).
A key finding is that there is a great deal of consistency between countries/jurisdictions within each of the above categories – but significant differences in focus and approach between the categories.
16
the focus of the cost-benefit/business case guidance – at least for monetisable benefits; and some of the e-gov literature). It generally has less of an emphasis on what specific measures can be used for specific benefit categories (which is the focus of the e-gov literature, and the HMT Green Book (GSR20) also includes guidance on valuing a range of social and environmental benefits). However, the New Zealand Government has prepared a Social Outcomes Catalogue (GSR Additional Note).
Most of the Government Body sources are exclusively concerned with normative guidance, although there are examples where descriptive information is provided. The breakdown is,
Normative: 47 Sources
Normative with examples/case studies or data on benefits measurement: 8 Sources
Descriptive: 12 Sources
The sources include some orientated specifically to projects, programs or portfolios, but a majority of sources were orientated towards projects and programs, with some publications concerned with the integration between all three levels. The breakdown is,
Project, Program and Portfolio – 10 Sources
Project & Program – 32 Sources
Portfolio – 2 Sources
Program – 9 Sources
Project (including e-Gov initiatives) – 14 Sources
Q2: At what point(s) in the project are outcome benefits measures developed, defined and selected?
24 sources did not address the question. Of the 43 that did, all sources agreed that pre-investment measurement is required. Common features identified were:
The Benefits Management Strategy describes how benefits will be measured and by who on a program/project.
Specific measure(s) for each benefit should be identified - at least one per benefit, although some sources emphasise using several measures to obtain a more-informed view on benefits realisation.
Existing organisational measures should be used where possible and be linked to the performance management system; and a standard set of measures should be
17
Benefit measures identified are recorded on a Benefit Profile/Register prepared alongside the Business Case, with the forecast scale of impact (some sources refer to targets) also being recorded in the Benefits Realisation Plan.
Business Cases do not always clearly identify the benefits and when they do they are commonly over-stated due to optimism bias and strategic misrepresentation. Solutions identified include: optimism bias adjustments and reference class forecasting; sensitivity analysis; confidence ratings; challenge; and stronger accountability.
In the Business Case & Cost-Benefit Analysis guidance there is
A focus on benefits being measured primarily as part of project appraisal (forecasts) and at the evaluation/post-implementation stage – although the emphasis is on the former.
Emphasis on measuring both financial and nonfinancial benefits in financial terms for inclusion in a NPV calculation in the Business Case.
Measures are based on market rates for financial benefits. Where market prices are not available, techniques such as stated and revealed preference can be used to value nonfinancial benefits.
Only 14 sources out of the 57 sources distinguished between outcomes/end benefits and intermediate benefits, using dualities (paired terms) such as intermediate/end,
intermediate/ultimate leading/lagging and short term/long term. Examples are
N. Ireland (GSR34) distinguishes between: Intermediate benefits, “these describe the actual operational improvement resulting from the programme or project, for
example quicker access to information, improved financial management, faster turnaround times; these functional or operational benefits must be able to be measured and if an intermediate benefit can’t be measured then it isn’t a useful benefit - an individual benefit profile is produced for each intermediate benefit and this is used to record the benefit, allocate responsibility for measuring it and to identify any activities required to manage benefit delivery” & End benefits, “these are strategic or organisational level benefits or benefits linked to the wider NICS and are generally aligned with organisational strategy and corporate plans; end benefits usually describe what the organisation is seeking to achieve as a result of the
business changes and measurement is achieved through the measurement of its component intermediate benefits”.
Bradley (GSR6) and OGC 2005 (GSR12) specifically refer to intermediate and end benefits and measuring each; SROI (GSR27)refers to monitoring intermediate benefits to provide a measure of ‘distance travelled’.
18
Canada Outcome Management (GSR45) distinguishes between intermediate and ultimate outcomes: “identification of intermediate outcomes that serve as milestones or leading indicators towards attaining the outcomes and to permit tracking of progress towards the final outcomes” & “To achieve the end results of an initiative, it is crucial to identify and track intermediate outcomes that can be used as milestones along the road.”
OGC (undated, GSR10) and Cabinet Office, 2017 (GSR16) refer to leading and lagging measures.
It should be noted that end benefits depend on intermediate benefits, but the reverse is not the case.
Many Benefits Management Guidance sources emphasise the importance of agreeing benefit measures with relevant stakeholders e.g. via facilitated workshops. Some sources from different categories of guidance link benefits/measures to stakeholder groups:
Better Business Cases (GSR33) guidance: “Public Sector benefits – those falling to the spending organisation, over which it has direct control of their realisation (Direct Benefits) and those falling to other parts of the public sector (Indirect Benefits); Wider Social benefits – those other indirect benefits falling to other sectors, including the private sector.”
IPA 2017 (GSR19): government, private sector partners and wider UK public.
HMT eGOV guidance 2003 (GSR25): Customer - Business & Citizens, Government, & Society.
US VMM (GSR47) – 5 sources of value: Direct User (Customer) value; Social (non-direct user/public) value; Government operational/foundational value; Government financial value; Strategic/political value; and by type: Govt to Citizen; Govt to Govt; Govt to Business; and Internal Efficiency and Effectiveness.
Australian DVAM (GSR48) - encompassed five forms of value: Agency benefits/value; Strategic value; Consumer financial benefits; Social benefits; and Governance value with three indicators: increased community participation in democratic processes; increased transparency of government processes; and increased accountability.
19
Qu 3: Who assesses the benefits and at what point during the project are they assessed?
a. Are measures added over the life of the project and/or beyond?
b. How far after the close-out of the project are benefits continued to be assessed, and at what intervals?
Who measures the benefits is not addressed/specified by 48 Sources (many address measurement but don’t specify who should do the measuring). Of the 19 sources that do address this issue, most specify that it is a business responsibility falling to:
Business Change Manager – MSP (GSR2), OGC 2006 (GSR12)
Benefit Owner – NSW BRM Framework (GSR52) & New Zealand: the benefit owner “Collects and reports data to evidence benefits realisation”
Bradley (GSR6) refers to “Measure monitors” with this role being shared among the stakeholders; as well as, “Benefit owners, who may be tracking the benefits
themselves”
N. Ireland (GSR34) guidance distinguishes between an “operational benefit owner – a business representative who is responsible for benefit measurement and the management of any activities required to ensure benefits are realised” and “A senior benefit owner is a senior business representative responsible for ensuring that the benefit is achieved once handover from the programme or project is complete…the actual measurement, monitoring and management of benefits will be done by named operational benefit owners and overseen by senior benefit owners.”
Canada Outcome Management (GSR45) - Outcome Owner’s who are, “responsible and accountable for achieving his or her target. In addition, there is often an
additional accountability for reporting on the metric, to distinguish between the two activities and responsibilities.”
Victorian ILM (GSR55) refers to a Benefit data provider: “A person who has been identified as the custodian of data that will be required as evidence that a KPI has been met.”
Other sources highlights the facilitating/coordinating role of PMO staff:
20
P3O (GSR4) refers to a Benefits role in the Project/Program/Portfolio Office who collates and facilitates measurement by business managers.
MSP (GSR2) refers to a similar role being performed by the Program Office.
Many sources emphasise the importance of stakeholder engagement in benefits measurement – for example:
SROI (GSR27) places “stakeholders at the heart of the measurement process” (NEF)
VMM (GSR47) “Valid results depend on project staff working directly with
representatives of user communities and partner agencies to define and array the measures in order of importance”
Canada Outcome Management (GSR45)– measures should be agreed with the Outcome Owners
DVAM (GSR48) - Emphasis on user involvement in identifying benefits, rating/scoring them and assessment of performance
Victorian ILM (GSR55) - Measures are developed with business stakeholders - “A benefit definition workshop is used to identify the KPIs, measures and targets that must be met to mitigate the effect of the problem.”
World Bank (GSR67), “Participation of key stakeholders in defining indicators is important because they are then more likely to understand and use indicators for management decision-making.”
Tasmania (GSR57) – measures should be agreed with the Benefit Owners.
There were two main groups on the approach to assessment over the benefits life-cycle. These were
Continuous or Regular/Periodic measurement: 3PM Guidance that emphasises continuous or at least regular measurement throughout the business change lifecycle e.g. Bradley (GSR6), MSP (GSR2), MoP (GSR3), New Zealand, Canada (GSR45), N Ireland (GSR34) etc. From baselining (e.g. OGC (GSR1), 2006, “in particular ensuring that the ‘before’ state is measured so that an assessment can be made as to whether the ‘after’ measurements indicate an improvement or not”), then tracking post-implementation at end of tranche and other benefit reviews, through to (and in some cases beyond) post-implementation review. For example:
o Australian Fed Govt (GSR46) (2012) - Benefits realisation is maximised where: “Benefits are measured routinely and are part of normal planning and reporting functions—not regarded as an optional and stand alone exercise”; and
o N. Ireland (GSR34) – “A pre-implementation baseline measurement followed by defined actual measurements at relevant points during, and post,
21
Pre and post investment measurement: Cost-Benefit Analysis Guidance (such as HMT Green Book (GSR20), Optimism Bias Guidance (GSR21), Better Business Case Guidance (GSR33), White House Circular No. A-94 Revised (GSR40), NSW Treasury (GSR51) etc.) focuses on measurement for project appraisal and to a lesser extent, evaluation (at the finish). Other sources with this focus include: SROI (GSR27) and e-Gov frameworks such as the US CIO VMM (GSR47) and Australian DVAM (GSR48). The focus is therefore on forecasting for the appraisal stage and then considering whether the forecast benefits have been realised – as expressed by the NSW guidance (GSR51) - “Benefits realisation is an established practice of ensuring that projects or programs produce the anticipated benefits claimed in the project’s economic appraisal”.
Are measures added over the project? Emergent benefits?
This is was not addressed by 52 sources. The 15 sources that include identifying & measuring emergent/unplanned benefits, include
NSW (GSR52) BRM Framework - “The process of organising and managing so that potential benefits arising from investment in change, are actually achieved.”
MSP (GSR2) – a Business Change Manager role.
P3O (GSR4) – benefits role to assist business managers/BCMs, “to identify additional opportunities for benefits realization”
SROI (GSR27): unintended benefits should be identified at the evaluation stage.
N. Ireland (GSR34) - review for emergent benefits at summary review points.
New Zealand (GSR59) focus on unplanned/emergent benefits across the BM lifecycle.
It should be noted that the Cost-benefit and Business Case guidance focuses on planned benefits with little reference to emergent benefits.
Measurement post-project & when?
This was not addressed by 55 Sources. Regarding the 12 sources that did cover it, the following points are noteworthy.
MSP (GSR2) - measurement continues after the program by BAU/operational
managers and can be the BCM. New Zealand guidance (GSR59) also sees the BCM as being accountable for benefits measurement following program closure.
22
Bradley (GSR6) sees post-closure measurement falling to the Benefit Owners – “Their role will continue beyond the life of the programme”. Similarly, in the N. Ireland guidance responsibility lies with the operational benefit owner; and the DWP Case Study (NAO, 2006 (GSR28, GSR30, GSR31)) refers to a benefits realisation plan that assigns responsibility for securing benefits to named individuals – benefits owners – over the medium-term of the first few years’ following implementation.
Canadian Outcome Management (GSR45)– “The outcomes monitoring and reporting process continues until all outcomes are realized and stable, particularly if the benefit pertains to a measurable performance level.”
Aus Fed Govt 2012 (GSR46) – the project/program must ensure, “the responsibilities for measurement are transferred to an appropriate (Agency) corporate area as part of its project/program closure activities.” Queensland Project Assurance Framework – 2 (GSR53, GSR55). Benefits Realisation, “a succession plan to handover any
benefits management plans, supporting benefit profiles and reporting responsibilities to the appropriate business owner”. NSW BRM Framework (GSR52) – “In order for benefits to be tracked after a program has ended there needs to be clear
identification of the owners of benefits within the business, and effective handover of benefits measurement and reporting to the business owner.”
Qu. 4: Does this vary by project type (e.g., change project, innovation or new product development, etc.) or by industry, project size, potential social impact, or even who the customer is?
The guidance is generic across project type, industry and size, except for those directed towards e-Gov. Initiatives. In terms of who the guidance is directed to, this breaks down into
3PM practitioners & managers, Cross-sector, global scope – 15 Sources
Central/State/Federal government specifically SROs, 3PM staff, business case writers – 38 Sources
e-Gov initiative participants/policy makers – 13 Sources
3rd sector initiatives – 1 Source (SROI (GSR27), where potential social impact is emphasised).
The Government Body literature therefore provides little help in identifying variations in benefits measurement practice across different dimensions.
23
36 sources do not distinguish between quantitative and qualitative benefits, with most of such sources focusing on quantitative measures. 31 sources do distinguish between quantitative and qualitative measures (or use similar/equivalent terms).
Sources referring to qualitative benefits/measures include those that see qualitative as of less value than quantitative measures - for example, HMT Green Book (GSR20), IPA 2017 (GSR19) and Better Business Cases Guidance - “ascertain whether the benefits are economic (non-cash releasing) or financial (cash releasing); measurable, but not in cash terms; or simply
qualitative.”; “cash releasing benefits (CRB). non-cash-releasing benefits (non-CRB). quantifiable benefits (QB). non-quantifiable benefits (non-QB). These are the qualitative benefits, which are of value that cannot be quantified.” & “Qualitative benefits (Qual) cannot be measured nor monetized (meaningfully).”
Those that recommend combining quantitative and qualitative measures include:
New Zealand (GSR59): “Qualitative (intangible) categorisationBenefits expressed in descriptive terms e.g., satisfaction rating. Quantifiable (tangible) categorisation Measures expressed in numerical terms e.g., hours saved, income generated etc.”
SROI (GSR27) - A mix of subjective or self-reported (e.g. what the stakeholder says) and objective indicators (data) are recommended;
N. Ireland (GSR34): “Quantitative benefits can easily be measured numerically; qualitative benefits are normally measured with a questionnaire and the response is measured numerically.” NI distinguishes between: Direct monetary benefits
(tangible); Direct non-monetary benefits (tangible); and Indirect benefits
(intangible) - can be identified, but cannot be easily quantified for example end user satisfaction, better access to information, organisational image, customer service, better morale, better perceptions.
Canada Outcome Management (GSR45)- Outcomes are classified as: Direct Quantitative – labour savings, Direct Quantitative – other direct savings, Indirect, and Qualitative; “Adopting both quantitative and qualitative measures for outcomes presents a broader view of expected value… Quantitative outcomes are measured in numeric terms; for example, dollars, hours, or turnover rates. Qualitative outcomes are measured in non-numeric terms, which are often monitored through in-depth interviews, direction observation, and/or written documentation.”
References to use of a balanced scorecard of measures - Balanced scorecard – OGC 2005 (GSR1), P3M3 (GSR13), Kelly et al (GSR26), US VMM (GSR47)
Monetising benefit measures is a theme explored in CBA/Business Case Guidance (HMT Green Book (GSR20); IPA 2017 (GSP19); Better Business Cases guidance (GSR33)); SROI (GSR27); White House Circular No. A-94 Revised (GSR40) and other sources. These publications typically
24
valuation/revealed preference methods for non-financial benefits. Similarly, MSP (GSR2) states, “best practice is to express benefits in financial terms wherever possible”. Other sources disagree and warn about measuring non-financial benefits in financial terms for benefits
realisation management purposes:
Bradley (GSR6) argues that giving financial values to non-financial benefits is dangerous and should only be done where there is “a real flow of money”
NSW BRM Framework (BSR52), “Care should be taken if trying to give financial values to non-financial benefits as this can be misleading if the value is used as part of an investment justification, but will not be able to be realised and measured”
NZ Guidance (GSR59) “Although many benefits can be quantified financially, there are others where it is difficult, undesirable, or insensitive to attribute a financial value…Often non-monetary benefits can be monetised using CBA techniques such as those in the CBA guidance. While this is an excellent technique for being able to compare projects across varying outcomes to aid decision makers, this monetised outcome should not be used for benefit realisation purposes as there is usually no associated cash flow impact.”
Linking benefit measures to Organisational KPI’s/Strategic Objectives is recommended in several sources, emphasising the importance of linking benefits measures to strategic objectives and organisational KPIs. For example:
MSP (GSR2)Benefit Profile includes –“KPIs in the business operations that will be affected by the benefit”
MoP (GSR3) refers to “development of a consistent set of metrics to link benefits to strategic objectives”
PRINCE2 (GSR7) - Benefits should be aligned to corporate objectives.
Reference to use of standard measures is made by:
MSP (GSR1) – in the Benefits Management Strategy
MoP (GSR3) - Benefits eligibility rules including a consistent portfolio-wide approach to benefits quantification and valuation
NSW (GSR52) Government are currently developing a Measures Dictionary for the NSW Government Digital Strategy
NZ Government Outcomes Catalogue Tool (Additional Note under GSR61) includes measures for a variety of social outcomes - “The Treasury and Superu have
developed a catalogue of the social outcomes for government priority programmes. The catalogue maps government priorities, outcomes, and proposed or actual
25
the data is collected, when and by whom. This catalogue is extremely helpful when developing the benefits for new social investments”
Other detailed practical points on benefits measurement include
Use existing information sources or performance measurement systems - OGC 2005 (GSR12)
Use of SMART measures – HMT Green Book (GSR20); Better Business Cases guidance (GSR33); NSW guidance (GSR51); Western Australia (GSR56); and NZ (SMAART) (GSR59)
Adjusting benefit forecasts:
o HMT Green Book (GSR20) adjust for leakage, deadweight,
displacement/substitution, distributional impacts, relative price movements, and optimism bias;
o SROI (GSR27) – adjust for ‘Deadweight’, Displacement’; ‘Attribution’ and ‘Drop off’ over time.
Use of a normalised scale – the VMM (GSR47) combines quantitative and qualitative metrics using a normalized scale in calculating the value score – “the normalized scale provides a method for integrating objective and subjective measures of value into a single decision metric.”
Aus Fed Govt 2012 (GSR46) – suggests the use of proxy measures for qualitative benefits.
Qu 6. What happens with a gap between benefits accountability and project implementation?
The government body literature on measurement/forecasting accuracy and benefits realisation measurement in practice identifies:
Business Cases do not always clearly identify the benefits and when they do they are commonly over-stated due to optimism bias and strategic misrepresentation. This issue is one of the root causes of a subsequent failure on accountability later on; and
26
4.2 Professional Body Sources
Q1: What is the “state of the art”in measuring benefits? (Normative/descriptive, Project, Program or Portfolio)
Of the 42 sources reviewed, 32 were exclusively or primarily normative, i.e. what should be the case, and 10 included a mixture of normative and descriptive content. None were purely
descriptive of current practice without any element of guidance. In the case of the PMI Thought Leadership reports (PBR 15-22) major surveys of current practice were used to inform
recommendations for change, whereas other publications used case studies and examples alongside guidance (for example APMG Managing Benefits, PBR 27). It should be noted that some documents, particularly PMI Practice Guides, are not focused primarily on benefits.
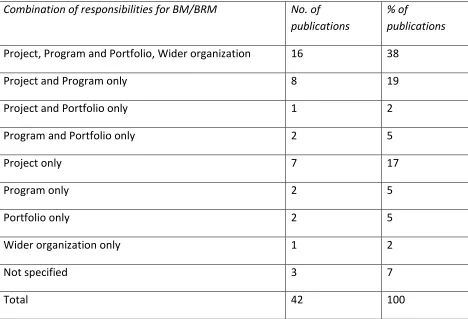
[image:27.612.74.542.390.709.2]In the professional bodies literature, the focus of the guidance will sometimes be specific to one level - projects, programs or portfolios – or it may be concerned with the respective responsibilities between these levels and the wider organisation. It is noteworthy that ISO Standards now cover the full range of project/program/portfolio management levels and also their integration. Table 4.1 indicates that many of the publications have a ‘joining up’ focus, while many others are concerned with either projects and programs or solely with projects.
Table 4.1 Focus of guidance
Combination of responsibilities for BM/BRM No. of publications
% of
publications
Project, Program and Portfolio, Wider organization 16 38
Project and Program only 8 19
Project and Portfolio only 1 2
Program and Portfolio only 2 5
Project only 7 17
Program only 2 5
Portfolio only 2 5
Wider organization only 1 2
Not specified 3 7
27
Some sources made specific reference to responsibilities for BRM at the project, program and portfolio level (for example, PMI Managing Change Guide, PBR6), while in others projects and programs are generally bracketed together when making recommendations for BRM (for example, PMI Thought leadership reports, PBR17 and PBR18; APM research fund report on Social Cost-benefit Analysis, PBR, 26). Some sources adopt the position that benefits are usually generated through programmes,
- ‘large projects can deliver benefits but most projects deliver capabilities, so benefits usually arise from the roll out of a programme’ (APM SIG White Paper ‘Social Return on Investment (SROI), PBR25, p6).
In the change management professional body literature the term ‘change initiative’ is favoured, rather than projects, programs and portfolios (see PBR28, PBR29, PBR34). Some sources
emphasize the importance of the portfolio level for managing benefits, and achieving alignment of strategy and investment in change. For example Val IT’s first guiding principle is that IT enabled investment will be managed as a portfolio, and portfolio management is one of the three domains for the application of the set of Val IT principles (PBR31), while the International Centre for Complex Project Management emphasises a portfolio, rather than a project
perspective on benefits management (PBR34).
Although most of the recent professional body sources pay attention to the levels at which BRM is to be focused, there is less on the subject of measurement of benefits. Some sources highlight the importance of measurement, for example,
- ‘In addition, the approach requires attention to metrics. Part of the conversation when benefits are identified is how the organization will know whether it’s on track to
achieving them. As central components of benefits realization management, metrics and benefits tracking help to define objectives and critical success factors and to determine if—and how—they are achievable’, PMI Pulse of the Profession report on strategic impact of projects (PBR15) p7.
However, there are few sources which provide practical advice on measurement. One of the few examples is the APMG Managing Benefits guide (PBR27), which includes measurement issues in the barriers to benefits management in chapter 4 and provides guidance on selecting measures in Chapter 7.
Q2. At what point(s) in the project are outcome benefits measures developed, defined and selected?
28
There is a consensus that benefits measurement is an activity that needs to be commenced early on in the life cycle of a project, program or portfolio, to provide a baseline for monitoring later on, and measures are therefore included in the business planning documentation. For example, the PMI Thought Leadership reports (PBR15-22) all have ‘identify benefits’ as the first of the three phases in the benefits life-cycle. The ‘Strengthening benefits awareness in the C-suite’ report (PBR19) includes a recommendation to ‘Embed BRM in strategy making and portfolio management from the start’ (p19).
In many of the publications, setting benefits measures is part of a second stage or phase in a process. For example, the APM Body of Knowledge (PBR23) has ‘Identify and structure benefits’ as the second stage in the benefits management process, including benefits mapping (P124-125). It follows on from ‘Benefits Management Plan’ where the overall approach is set out. In ISACA Cobit 5 (PBR32) metrics for Benefits Delivery at the portfolio, program and project level, (as well as at the operational level) are established in EDM02 Ensure Benefits Delivery,
following on from EDM01 Ensure Governance Framework Setting and Maintenance.
Some sources make explicit the gradual development of benefits measures as the nature of the project or program becomes clearer over time, linked with governance decisions. For example, BS ISO 21503: 2017 Guidance on program management (PBR40) states that
‘Benefit identification and analysis should begin when the programme is being
considered. After the programme has been established, a more detailed set of benefits to be realized should be identified, analysed and prioritized. Benefit identification and analysis may include, but are not limited to, the following: — identifying expected benefits; — identifying benefit owners for each benefit to be realized; — aligning benefits with strategic and other objectives; — defining performance metrics and reporting for each benefit; - determining time frames for benefit realization’ p.13.
29
Focus on outcome and/or intermediate benefits?
In reviewing this question, the relationship between the term ‘outcome’ and the term ‘benefit’ requires exploration, as they are sometimes viewed as synonymous, and sometimes as distinct from one another. As highlighted in our 2016 report to the PMI on BM/BRM terminology, a number of professional body sources define benefits as outcomes with certain characteristics, such as
PMI, The Standard for Program Management, 2013 (PBR3) defines benefits in outcome terms: “An outcome of actions, behaviors, products or services that provide utility to the sponsoring organization as well as to the program’s intended beneficiaries” (p165).
The ISACA Glossary also defines benefits in outcome terms: Benefit - “In business, an outcome whose nature and value (expressed in various ways) are considered
advantageous by an enterprise.”
On the other hand, the PMI, Managing Change in Organizations: A Practice Guide, 2013 (PBR6) states that ‘Capabilities lead to results, lead to outcomes, lead to benefits’ p73.
The term ‘outcome benefit’ did not appear to be used, but there were 10 sources out of the 42 which distinguished between different types of outcome or different types of benefit. ISACA Val IT (PBR31) referred specifically to different types of outcome,
‘Utilise appropriate methods and techniques, involving all key stakeholders, to develop and document a complete and shared understanding of the expected business outcomes (both intermediate, or lead, and end, or lag, outcomes) of the candidate programs, how they will be measured, and the full scope of initiatives required to achieve the expected outcomes’ (Part of IM2.1 Develop a clear and complete understanding of the candidate program).
Other sources also used the dualities ‘intermediate/end’ and ‘lead/lag’, but applied them to benefits. For example
The Change Management Body of Knowledge – Change Management Institute, 1st Edition (2013) (PBR28) refers to “The path from enabling changes through ‘intermediate benefits’ to ‘end benefits’”. p61.
30
As a slight variation, the APM SIG White Paper ‘Social Return on Investment (SROI) – a powerful tool for the realisation of benefits’ (PBR25) contrasted ‘intermediate’ with ‘ultimate’ outcomes, and gave a practical example,
‘Once the SROI framework has been established, it is relatively straightforward to follow through the causality chain, and measure at key points. This means that the business-as-usual team can measure how well they are doing against a particular desired result, either using the ultimate outcome (for example, people not using hospital for smoking-related conditions), or a proxy measure (sometimes termed intermediate outcome) that is more appropriate at the time of measurement (the number of people smoking, and the amount they smoke)’ P 15.
As another variation, the PMI, Managing Change in Organizations: A Practice Guide, 2013 (PBR6) refers to ‘intermediate and tangible benefits that are linked to the ultimate purpose, as well as the pace of delivery, are set during scope delineation’ (p88).
Other sources distinguish between short and long term benefits. The PMI, Pulse of the Profession report ‘The Strategic Impact of Projects: Identify benefits to drive business results’ found that ‘Only one-third of organizations report that they differentiate between short-term benefits (those expected shortly after project completion) and long-term benefits (those expected months or years later)’ (p14).
The SROI study quoted above refers to the causality chain as a mechanism to link different types of benefit, and a variety of benefits mapping and benefits dependency tools are used in the literature to draw distinctions between different benefit types and how they relate, on the one hand to strategic objectives, and, on the other hand, to the activities being undertaken. APMG ‘Managing Benefits’ guidance (PBR27) summarises a number of different approaches to benefits mapping, which are associated with sources covered in other literature reviews, such as
- The MSP benefits map (Government Bodies review)
- The Results Chain (Consultant/Practitioner review
- The benefits dependency network (Academic literature review).
One of the benefits mapping tools not covered elsewhere in this report is the ‘benefits logic map’, which distinguishes between intermediate benefits and end benefits. The APMG
‘Managing Benefits’ guidance (PBR27) refers to an example of the use of this technique, for the ‘Tell us once’ program, with intermediate benefits mainly falling to public authorities and end benefits mainly benefiting citizens (p65).
31
intermediate/end, intermediate/ultimate, lead/lag and short term/long term. There are different ways in which distinctions are made, including
- By importance, in the eyes of beneficiaries or other stakeholders - By relationship to strategic objectives
- By time of occurrence as to when they happen
- By time as to when they can be measured to monitor progress.
Often the above factors are related to one another in practice, but they are all slightly different in terms of their implications and the interdependencies implied. In a benefits map, the
interdependencies are shown, but there can be wider issues, in terms of the attribution of benefits, illustrated by the following excerpt from the Change Management Institute, The Effective Change Manager’s Handbook (2015) (PBR28),
‘There is often a chain of benefits with intermediate benefits linked to final or end benefits… From the perspective of tracking benefits realization, the point to note is that monitoring leading measures of intermediate benefit achievement provides evidence to confirm that end benefit realization can be attributed to a specific change initiative’ (p165-166).
In some cases, there is not necessarily any interdependence between categories of benefit. For example, short and long term benefits are not necessarily causally connected, and if they are, the question of degree of attribution will arise. None of the sources explored such issues in any depth.
Linking to specific stakeholders
Many of the sources make general statements about the importance of stakeholder engagement in benefits measurement, in terms of, for example,
- choosing measures that are meaningful for stakeholders (ICCPM - Complex Project Management Global Perspectives and the Strategic Agenda to 2025, Compendium of working papers, (PBR34, p154),
- maintaining communications with key stakeholders and optimising benefits for
stakeholders (PMI, Pulse of the Profession report – Beyond the project : sustain benefits to optimise business value (PBR17))
- reconciling the views of stakeholders on value (The European Standard EN 12973, (PBR35, p5).
Some sources go into detail on the engagement of beneficiaries. APMG ‘Managing Benefits’ (PBR27) includes guidance on customer and staff surveys, with two case studies, of ‘BT and the RiO system’ and the ‘Tell us Once programme’. APM SIG White Paper ‘Social Return on
32
benefits measures in SROI are derived from stakeholder interviews. A case study of the use of SROI is used, with the different stakeholder groups listed. APM Research Fund Series ‘The importance of conventions: a critical evaluation of current practice in social cost-benefit analysis’ (PBR26) contends that the interests of stakeholders are highlighted in the notion of conventions. The meanings attached to particular measures/indicators and the moral convictions driving those meanings are often not considered (p8).
Qu 3: Who assesses the benefits and at what point during the project are they assessed?
a. Are measures added over the life of the project and/or beyond?
b. How far after the close-out of the project are benefits continued to be assessed, and at what intervals?
Most of the 42 sources had something to say on this question, with only 13 not addressing it. Amongst the other sources, there are a variety of different roles identified, without any dominant individual being highlighted across the literature. Professional bodies with responsibilities across the project, programme and portfolio domains go some way to
identifying a coherent approach across the whole organisation, although this can be hampered when guidance documents have been produced at different times, as is the case, for example, for the ISO Standards.
For the PMI, the ‘Governance of Portfolios, Programs and Projects Practice Guide, 2016’ (PBR7) combines the roles in the Standards for Portfolio Management and Program Management (PBR3 and 4), in ascribing key roles to the Portfolio Manager and Program Manager in assessing the benefits. The PMI, Pulse of the Profession report – ‘Beyond the project : sustain benefits to optimise business value’ (PBR17) provides a complementary perspective emphasizing the transfer of projects. Various benefits-related activities at project transfer to BAU are listed and responsibilities for them identified. The project manager and business/benefit owner feature strongly in terms of responsibilities. However, the recommendations of the report strongly recommend cross-functional responsibilities and ownership (P17).
33
APMG ‘Managing Benefits’ (PBR27) provides guidance on the various roles which may be required to collaborate on identifying benefits measures
‘The usual approach to identifying benefits measures is via a facilitated workshop including: the Benefit Owners and end-users/customers; the Portfolio Benefits Manager; Business Change Managers; representatives from the performance management
function (to advise on what current measures may be appropriate); and those who will be responsible for collecting the data in due course including the Project/Programme Office Benefits Manager.’(P105).
Following the identification of benefits, the assessment of benefits may be split between many different individuals. BS ISO 21503: 2017 Guidance on program management (PBR40) advises that ‘Benefit owners should be identified for each benefit to be realized’ (p13), while the programme manager role includes coordination for achieving programme objectives and realizing programme benefits (p8).
In some instances, professional bodies are using management tools to provide detailed guidance on roles. For example, for each Val IT process (PBR30-33), a RACI (responsible, accountable, consulted and informed) chart is provided.
The RACI chart decomposes the process into a set of key activities, indicating for each of these activities who should be responsible, accountable, consulted and informed. For the Val IT version 2.0 (PBR31) the roles and structures Included in RACI charts comprise :
- Board
- Business Sponsor (or Service Owner)
- Business unit managers/executives
- Compliance, audit, risk and security functions
- CEO
- CFO
- CIO
- Investment and services board (ISB)
- HR
- Program manager
- Program management office (PMO)
- Value Management office (VMO)
The activities in the RACI chart are derived from Val IT’s key management practices, but are mostly defined at a more detailed level of granularity. Benefits are assessed at program stage-gates specified by portfolio management for different categories of investments.
34
experienced Senior Project Manager (p.8), but in other cases assessing benefits is pitched at the program and portfolio levels.
Accountability for benefits is often separated from responsibilities for measuring and monitoring them. The PMI Thought Leadership Series - Establishing Benefits Ownership and Accountability report (PBR20) found that
‘more mature organizations have a single person accountable for BRM for each initiative or group of initiatives—24 percent versus 13 percent of organizations with low
maturity……since many anticipated benefits are not seen until after the project is
delivered, having one owner for ongoing benefits measurement and validation is critical. It puts someone in charge of consciously and deliberately monitoring and measuring benefits. This role can fall under many names—business owner, business manager, program director, divisional head, or product manager. P4.
A specific high level structure is proposed by the PMI Thought Leadership Series - Benefits Thinking Movement report (PBR22), which suggests,
In the Identify phase: ‘Considerthe role of a Chief Benefits Officer (CBO) to set the policies, procedures, and measurement of benefits. This role could be fulfilled by an existing Chief Strategy Officer or EPMO equivalent body. The governance body forms a Benefits Alliance that:
• Reviews the business cases for all strategic initiatives
• Approves the identified benefits and proposed measurement methods
• Drives benefits culture in collaboration with end-user business units’ (p2)
Are measures added over the project? Emergent benefits?
18 sources address emergent benefits explicitly or implicitly, while 24 sources do not consider or plan for this eventuality. However, of the 18 sources, very few specifically refer to new measures. In most cases emergence is referred to as a general feature of P3M, or a similar term such as unplanned or unintended benefits is used.