1
Finite element analysis and experimental study of plastic lattice structures manufactured by selective laser sintering
Jie Niu1, Hui Leng Choo1, Wei Sun2
1 The University of Nottingham Ningbo China, 199 Taikang East Road, Ningbo, China. 2TheUniversity of Nottingham, Nottingham, NG7 2RD, UK.
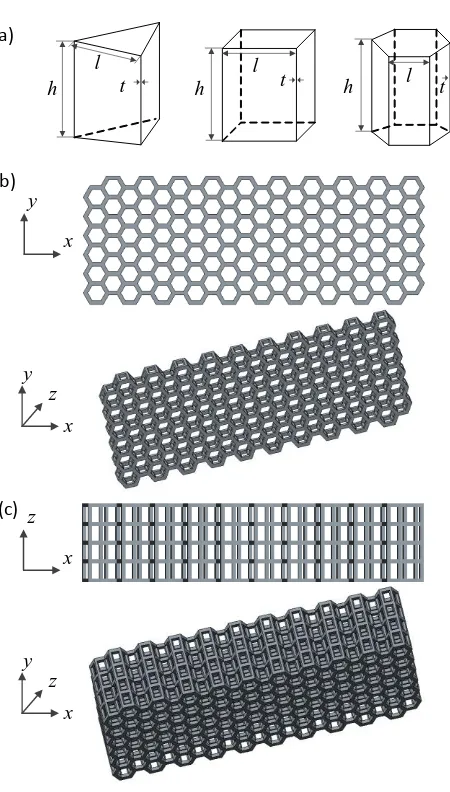
Abstract: The availability of Additive Manufacturing (AM) technologies in particular the selective laser sintering (SLS) process has enabled the fabrication of high strength, lightweight and complex cellular lattice structures. In this study, the effective mechanical properties of SLS produced periodic lattice structures were investigated. Three different types of lattice structures were designed by repeating three types of open-form unit cells consisting of triangular prism, square prism, and hexagonal prism. A novel approach of creating the complex and conformable lattice structures using traditional modelling software such as Creo® proposed by the authors was used. Based on the predesigned lattice structures, finite element analysis (FEA) was carried out to evaluate the mechanical properties of these structures. For the experimental study, nylon samples were printed using a plastic selective laser sintering system and tested using a universal testing machine. FEA results show that lattice structures with triangular prism perform better than the other two prisms in terms of Young’s modulus to relative density ratio. Tensile tests results show good conformance with the results obtained from FEA.
Keywords: lattice structure, unit cell, additive manufacturing, selective laser sintering, properties
2 Introduction
3
structures for use in the optimization and simulation processes of the additively manufactured structures [13]. Gandhi et al. investigated the most effective lattice cell layout, the design, modelling, production and validation of a compression block with Octet Framed-based unit cells [13]. Maskery et al. [12] studied the deformation processes and mechanical performance of several functionally graded and non-graded lattice structures using body-centred-cubic (BCC) and a reinforced variant called BCCz by SLS. They found that BCCz lattices possess remarkable mechanical anisotropy, being weaker when their reinforcing struts were perpendicularly applied, while BCC lattices tended to be more isotropic. Kinstlinger et al.[11] concluded for structures produced by SLS that mechanical properties vary between geometries and may be markedly different from the bulk material properties.
4
In this paper, the mechanical properties of lattice structures formed by three types of unit cells were investigated. The effects of the different types of unit cells and unit cell dimensions on mechanical properties were studied via finite element analysis (FEA). Tensile tests were carried out using nylon samples manufactured by SLS process to verify the FEA results.
Methodology
Geometry modelling
(a)
(c)
h t
l
h t
l
l
h t
(b)
x y
y
x z
x z
y
[image:4.612.192.417.259.655.2]x z
Figure 1 Geometrical evolution of lattice structures with three unit cells, (a) 3D skeleton unit cells of triangular prism, square
5
6
(a) (b) (c) (d)
Sharp and irregular edges by Trimming
Repaired edges by skin and cover
50 50
20
20
20
[image:6.612.84.530.68.248.2]20
Figure 2 Skimming for uniformly distributed unit cells and boundary treatment by Creo®, (a) profile of tailored structure in
in-plane direction, (b) profile of tailored structure in out-in-plane direction, (c) trimmed lattice structure with initial general dimension,
(d) post-processed conformal structure with ribs and caps. (Units: mm)
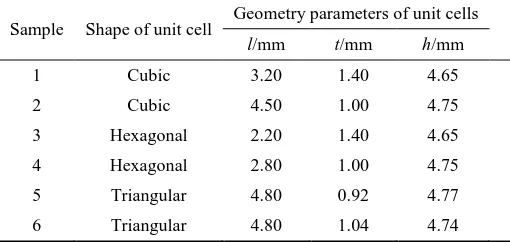
Table 1 Geometry parameters of the unit cells used to build the models investigated in this project.
Sample Shape of unit cell Geometry parameters of unit cells l/mm t/mm h/mm
1 Cubic 3.20 1.40 4.65
2 Cubic 4.50 1.00 4.75
3 Hexagonal 2.20 1.40 4.65
4 Hexagonal 2.80 1.00 4.75
5 Triangular 4.80 0.92 4.77
6 Triangular 4.80 1.04 4.74
Material parameters
[image:6.612.178.433.361.482.2]7
Table 2 Mechanical properties of SLS Nylon 12 (PA2200, EOS GmbH) [23].
Tensile strength (MPa)
Tensile modulus (MPa)
Tensile elongation at break (%)
Part melting (°C)
Particle size, average (μm)
Part moisture absorption, 23 °C (%)
45 1700 20 184 58 0.52
Finite element analysis
Lightweight structures pose a special challenge to FEA. In addition to the global response of a structure, careful analysis of local details such as areas of load introduction or localized instabilities can be crucial for reliable predictions [2]. In this work, the combination of quadratic tetrahedron element (tet 10) and hexahedron element (hex 20) was used. The conformable lattice structure was firstly divided into small sample parts and meshed by different element types, then emerged into a single part. Mesh-sensitivity was carried out using node number and maximum stress to select the appropriate element size. The strength converged when the element size is a quarter of the thickness of the strut. In this project, the average element quality is more than 0.95 and the skewness is lower than 0.3, indicating satisfied mesh quality [24].
An applied force F was varied at 50 N, 100 N and 200 N, and the corresponding deformation was obtained by FE models. To calculate the effective Young’s modulus of each nylon sample, a gauge length of 25 mm within the central area is selected. As shown in Figure 3, AA’ and BB’ are the left and right side of the effective part, where DL is the deformation at left side and DR
indicates the deformation along the right side. The values of DL and DR can be extracted in
8
DL DR
A
A’
B
B’
F
Gauge length
[image:8.612.172.435.73.197.2]25 mm
Figure 3 Gauge length determined in the workpiece.
Experimental sample preparation
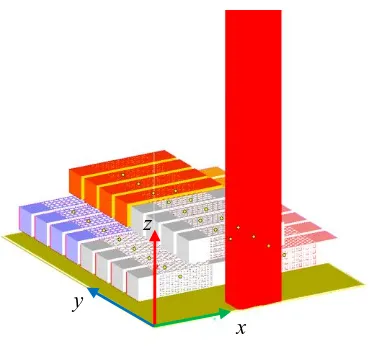
[image:8.612.181.432.450.620.2]Samples listed in Table 1 were fabricated using SLS system FORMIGA P110 from EOS. The material used was PA2200 as described previously. Four samples of each model were printed using the parameters listed in Table 3. All samples were placed in the x-direction as shown in Figure 4 to obtain maximum Young’s modulus.
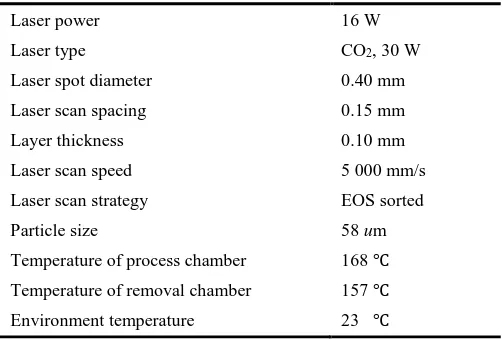
Table 3 Sintering process parameters.
Laser power 16 W
Laser type CO2, 30 W
Laser spot diameter 0.40 mm
Laser scan spacing 0.15 mm
Layer thickness 0.10 mm
Laser scan speed 5 000 mm/s
Laser scan strategy EOS sorted
Particle size 58 um
Temperature of process chamber 168 ℃
Temperature of removal chamber 157 ℃
9
x y
[image:9.612.211.396.68.241.2]z
Figure 4 Position of workpieces in the platform of Magics.
Tensile tests
Tensile tests were carried out using Instron 8950 universal testing machine. Each model was tested at least three times to obtain the average Young’s modulus. The tests were carried out at a speed of 2.5 mm/min. Extensometer with a gauge length of 25 mm was used to measure the deformation of the samples for Young’s modulus calculation.
Results and Discussion FEA results
Table 4 shows the Young’s modulus results obtained from FEA (ET-FEA), relative density (RD)
and ratio of ET-FEA to RD (ERD). As each sample has a different RD, which represents the
amount of material available to withstand a given load, it becomes unreliable to compare the ET
values directly. Hence, ERD is more appropriate for comparison. In general, increasing RD
increases the ERD for each of the unit cell shape although at varying degrees. Comparing Sample
10
two unit cells [16, 25]. The results obtained also show the critical sensitivity of unit cell dimensions to the properties of the lattice structures. For triangular unit cell, with a small increase in t of 0.12 mm for Sample 5 and 6 (l remains constant), RD increases 3.75 times while ET and ERD increase by around 340 % and 18 % respectively. However for cubic unit cell, a
change in both l and t do not have significant effect on ERD even with a 2.5 times difference in
[image:10.612.65.537.328.450.2]RD. Further studies in the future will focus on investigating and quantifying the effects of each unit cell parameters on the ET of the lattice structure.
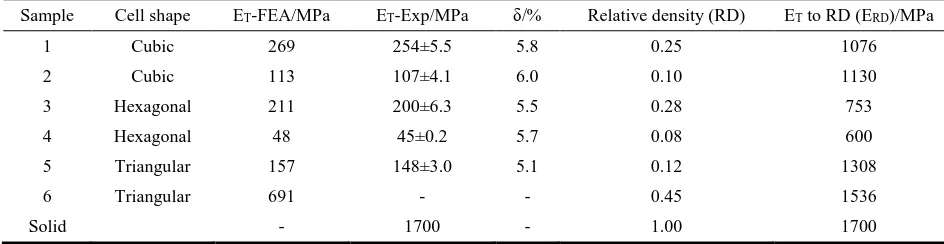
Table 4 Calculation of effective Young’s modulus by linear forces and responding deformations by FEA, relative error, relative density and ratio of ET-FEA to RD.
Sample Cell shape ET-FEA/MPa ET-Exp/MPa δ/% Relative density (RD) ET to RD (ERD)/MPa
1 Cubic 269 254±5.5 5.8 0.25 1076
2 Cubic 113 107±4.1 6.0 0.10 1130
3 Hexagonal 211 200±6.3 5.5 0.28 753
4 Hexagonal 48 45±0.2 5.7 0.08 600
5 Triangular 157 148±3.0 5.1 0.12 1308
6 Triangular 691 - - 0.45 1536
Solid - 1700 - 1.00 1700
Quality of manufactured samples
11
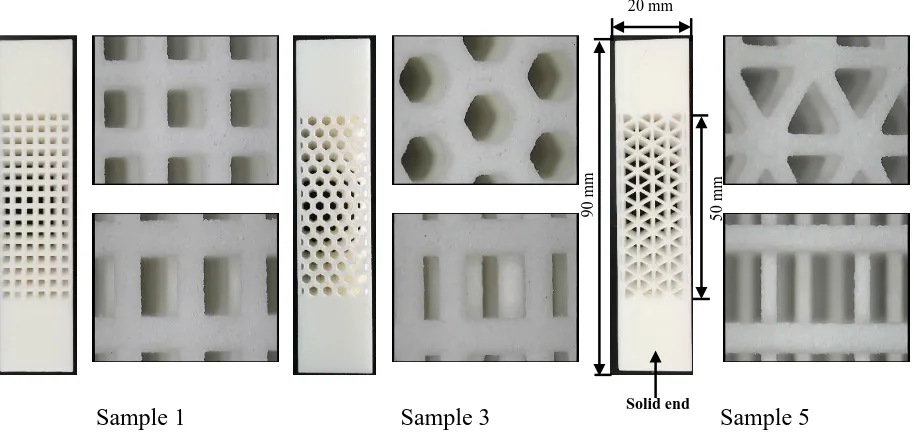
[image:11.612.76.533.82.300.2]Sample 1 Sample 3 Sample 5
Figure 5 Samples printed by SLS process and microscopic images of the unit cell in both the in-plane and out-plane directions.
Tensile tests results
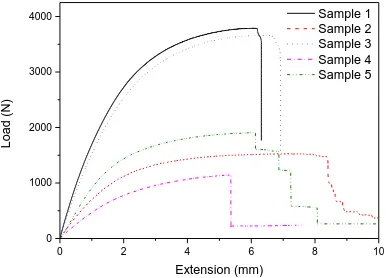
Figure 6 shows typical load-extension curve for each of the tested samples. Samples 1, 3 and 4 show classic tensile behaviour as expected with solid materials. However, Sample 5 shows several plateau of yielding beyond the maximum load. From observation during the experiment, each plateau corresponds to the complete detachment of each layer of the unit cell. Sample 2 shows similar results to Sample 5 but not as obvious. This behaviour will be further investigated in future work.
9
0
mm
20 mm
5
0
mm
12
Figure 6 Load-extension curves of the five samples.
The values of Young’s modulus obtained from experiments are shown in Table 4 (ET-Exp). Both
experimental and FEA results show good conformance with a maximum error of 6.0 %. This shows that the FEA model in this project could be used in the future for further analysis of the effects of unit cell parameters on tensile properties of the lattice structures.
Conclusions and Future Work
FEA results showed that lattice structures with triangular prism perform better than the other two prisms in terms of tensile elastic Young’s modulus to relative density ratio. Different types of unit cells and geometry parameters showed varying degrees of effects on mechanical properties of lattice structures. Young’s modulus results from experiment show good conformance with the results obtained from FEA. This shows that the element types tet 10 and hex 20 are suitable to be
0 2 4 6 8 10
0 1000 2000 3000 4000
L
o
a
d
(
N
)
Extension (mm)
13
used in FEA of lattice structures. SLS process was also demonstrated to be able to manufacture the samples with good surface quality and mechanical properties. In the future, the effects of geometry parameters of the unit cells will be investigated in detail. Non-linear behaviour of the plastic region and fracture of the lattice structures will also be studied in-depth.
References
1. Wong, K.V. and A. Hernandez, A review of additive manufacturing. ISRN Mechanical Engineering, 2012. 2012.
2. Hao, L. and D. Raymond. Design and additive manufacturing of cellular lattice structures. in The International Conference on Advanced Research in Virtual and Rapid Prototyping (VRAP). Taylor & Francis Group, Leiria. 2011.
3. Ju, J. and J.D. Summers, Compliant hexagonal periodic lattice structures having both high shear strength and high shear strain. Materials & Design, 2011. 32(2): p. 512-524.
4. Klahn, C., B. Leutenecker, and M. Meboldt, Design for Additive Manufacturing – Supporting the Substitution of Components in Series Products. Procedia CIRP, 2014. 21: p. 138-143. 5. Parthasarathy, J., B. Starly, and S. Raman, A design for the additive manufacture of
functionally graded porous structures with tailored mechanical properties for biomedical applications. Journal of Manufacturing Processes, 2011. 13(2): p. 160-170.
6. Vayre, B., F. Vignat, and F. Villeneuve, Designing for Additive Manufacturing. Procedia CIRP, 2012. 3: p. 632-637.
14
8. Nguyen, J., S.-i. Park, and D. Rosen, Heuristic optimization method for cellular structure design of light weight components. International Journal of Precision Engineering and Manufacturing, 2013. 14(6): p. 1071-1078.
9. Yan, C., et al., Evaluations of cellular lattice structures manufactured using selective laser melting. International Journal of Machine Tools and Manufacture, 2012. 62: p. 32-38.
10. Gorguluarslan, R.M., et al., Design and fabrication of periodic lattice-based cellular structures. Computer-Aided Design and Applications, 2016. 13(1): p. 50-62.
11. Kinstlinger, I.S., et al., Open-Source Selective Laser Sintering (OpenSLS) of Nylon and Biocompatible Polycaprolactone. PloS one, 2016. 11(2): p. e0147399.
12. Maskery, I., et al., An investigation into reinforced and functionally graded lattice structures. Journal of Cellular Plastics, 2016: p. 0021955X16639035.
13. Gandhi, U., et al., DESIGNING LATTICE STRUCTURES FOR 3D PRINTING.
14. Ahmadi, S.M., et al., Mechanical behavior of regular open-cell porous biomaterials made of diamond lattice unit cells. J Mech Behav Biomed Mater, 2014. 34: p. 106-15.
15. Gibson, L.J. and M. Ashby. The mechanics of three-dimensional cellular materials. in Proceedings of the Royal Society of London A: Mathematical, Physical and Engineering Sciences. 1982. The Royal Society.
16. Ashby, M.F. and R.M. Medalist, The mechanical properties of cellular solids. Metallurgical Transactions A, 1983. 14(9): p. 1755-1769.
17. Onck, P., E. Andrews, and L. Gibson, Size effects in ductile cellular solids. Part I: modeling. International Journal of Mechanical Sciences, 2001. 43(3): p. 681-699.
15
uniaxial and bending load. Journal of Materials Processing Technology, 2013. 213(9): p. 1558-1564.
19. Youssef, S., E. Maire, and R. Gaertner, Finite element modelling of the actual structure of cellular materials determined by X-ray tomography. Acta Materialia, 2005. 53(3): p. 719-730.
20. Smith, M., Z. Guan, and W.J. Cantwell, Finite element modelling of the compressive response of lattice structures manufactured using the selective laser melting technique. International Journal of Mechanical Sciences, 2013. 67: p. 28-41.
21. Park, S.-I., et al., Effective mechanical properties of lattice material fabricated by material extrusion additive manufacturing. Additive Manufacturing, 2014.
22. Jin, T., et al., Experimental study on the effects of specimen in-plane size on the mechanical behavior of aluminum hexagonal honeycombs. Materials Science and Engineering: A, 2015. 635: p. 23-35.
23. Zarringhalam, H., et al., Effects of processing on microstructure and properties of SLS Nylon 12. Materials Science and Engineering: A, 2006. 435-436: p. 172-180.
24. Lee, H.-H., Finite Element Simulations with ANSYS Workbench 14. 2012: SDC publications.