VOLUME 20 ISSUE 36 MAY 2016 ISSN 1366-5278
A programme of studies including assessment of
diagnostic accuracy of school hearing screening tests
and a cost-effectiveness model of school entry
hearing screening programmes
assessment of diagnostic accuracy of
school hearing screening tests and a
cost-effectiveness model of school entry
hearing screening programmes
Heather Fortnum,
1
Obioha C Ukoumunne,
2
Chris Hyde,
3
* Rod S Taylor,
3
Mara Ozolins,
1
Sam Errington,
1
Zhivko Zhelev,
2
Clive Pritchard,
4
Claire Benton,
5
Joanne Moody,
6
Laura Cocking,
7
Julian Watson
8
and Sarah Roberts
4
1
National Institute for Health Research, Nottingham Hearing Biomedical Research
Unit, Hearing and Otology Group, Division of Clinical Neuroscience, School of
Medicine, University of Nottingham, Nottingham, UK
2
National Institute for Health Research, Collaborations for Leadership in Applied
Health Research and Care South West Peninsula, University of Exeter Medical
School, Exeter, UK
3
Institute of Health Research, University of Exeter Medical School, Exeter, UK
4
Optimity Advisors, Kemp House, London, UK
5
Nottingham Audiology Services, Nottingham University Hospitals, Nottingham, UK
6
Cambridgeshire Community Services, Community Child Health, Ida Darwin
Hospital, Fulbourn, Cambridge, UK
7
Peninsula Clinical Trials Unit, Plymouth University Peninsula Schools of Medicine
and Dentistry, Plymouth, UK
8
Parent representative, Nottingham, UK
*Corresponding author
Declared competing interests of authors:Dr Fortnum and Professor Taylor were co-authors on the previousHealth Technology Assessment(HTA) publication reporting evaluation of the school entry hearing screen [Bamford J, Fortnum H, Bristow K, Smith J, Vamvakas G, Davies L, et al. Current practice, accuracy, effectiveness and cost-effectiveness of the school entry hearing screen.Health Technol Assess2007;11(32)]. Professor Taylor is chairperson of the National Institute for Health Research (NIHR) Health Services and Delivery Research researcher-led panel, March 2014–February 2016 (appointment extended to February 2018), and a member from 2013. He is also a member of NIHR Priority Research Advisory Methodology Group (PRAMG), August 2015–present, is a core member of NIHR HTA Themed Call Board, 2012–present and is a member of the core group of methodological experts for the NIHR Programme Grants for Applied Research programme, 2013–present.
Published May 2016
Fortnum H, Ukoumunne OC, Hyde C, Taylor RS, Ozolins M, Errington S,et al. A programme of studies including assessment of diagnostic accuracy of school hearing screening tests and a cost-effectiveness model of school entry hearing screening programmes.Health Technol Assess 2016;20(36).
Health Technology Assessmentis indexed and abstracted inIndex Medicus/MEDLINE,Excerpta Medica/EMBASE,Science Citation Index Expanded(SciSearch®) andCurrent Contents®/
ISSN 1366-5278 (Print)
ISSN 2046-4924 (Online)
Impact factor: 5.027
Health Technology Assessmentis indexed in MEDLINE, CINAHL, EMBASE, The Cochrane Library and the ISI Science Citation Index.
This journal is a member of and subscribes to the principles of the Committee on Publication Ethics (COPE) (www.publicationethics.org/).
Editorial contact: [email protected]
The full HTA archive is freely available to view online at www.journalslibrary.nihr.ac.uk/hta. Print-on-demand copies can be purchased from the report pages of the NIHR Journals Library website: www.journalslibrary.nihr.ac.uk
Criteria for inclusion in theHealth Technology Assessmentjournal
Reports are published inHealth Technology Assessment(HTA) if (1) they have resulted from work for the HTA programme, and (2) they are of a sufficiently high scientific quality as assessed by the reviewers and editors.
Reviews inHealth Technology Assessmentare termed‘systematic’when the account of the search appraisal and synthesis methods (to minimise biases and random errors) would, in theory, permit the replication of the review by others.
HTA programme
The HTA programme, part of the National Institute for Health Research (NIHR), was set up in 1993. It produces high-quality research information on the effectiveness, costs and broader impact of health technologies for those who use, manage and provide care in the NHS.
‘Health technologies’are broadly defined as all interventions used to promote health, prevent and treat disease, and improve rehabilitation and long-term care.
The journal is indexed in NHS Evidence via its abstracts included in MEDLINE and its Technology Assessment Reports inform National Institute for Health and Care Excellence (NICE) guidance. HTA research is also an important source of evidence for National Screening Committee (NSC) policy decisions.
For more information about the HTA programme please visit the website: http://www.nets.nihr.ac.uk/programmes/hta
This report
The research reported in this issue of the journal was funded by the HTA programme as project number 10/63/03. The contractual start date was in August 2012. The draft report began editorial review in March 2015 and was accepted for publication in November 2015. The authors have been wholly responsible for all data collection, analysis and interpretation, and for writing up their work. The HTA editors and publisher have tried to ensure the accuracy of the authors’report and would like to thank the reviewers for their constructive comments on the draft document. However, they do not accept liability for damages or losses arising from material published in this report.
This report presents independent research funded by the National Institute for Health Research (NIHR). The views and opinions expressed by authors in this publication are those of the authors and do not necessarily reflect those of the NHS, the NIHR, NETSCC, the HTA programme or the Department of Health. If there are verbatim quotations included in this publication the views and opinions expressed by the
interviewees are those of the interviewees and do not necessarily reflect those of the authors, those of the NHS, the NIHR, NETSCC, the HTA programme or the Department of Health.
© Queen’s Printer and Controller of HMSO 2016. This work was produced by Fortnumet al.under the terms of a commissioning contract issued by the Secretary of State for Health. This issue may be freely reproduced for the purposes of private research and study and extracts (or indeed, the full report) may be included in professional journals provided that suitable acknowledgement is made and the reproduction is not associated with any form of advertising. Applications for commercial reproduction should be addressed to: NIHR Journals Library, National Institute for Health Research, Evaluation, Trials and Studies Coordinating Centre, Alpha House, University of Southampton Science Park, Southampton SO16 7NS, UK.
Editor-in-Chief
NIHR Journals Library
Professor Tom Walley Director, NIHR Evaluation, Trials and Studies and Director of the HTA Programme, UK
NIHR Journals Library Editors
Professor Ken Stein Chair of HTA Editorial Board and Professor of Public Health, University of Exeter Medical School, UK
Professor Andree Le May Chair of NIHR Journals Library Editorial Group (EME, HS&DR, PGfAR, PHR journals)
Dr Martin Ashton-Key Consultant in Public Health Medicine/Consultant Advisor, NETSCC, UK
Professor Matthias Beck Chair in Public Sector Management and Subject Leader (Management Group), Queen’s University Management School, Queen’s University Belfast, UK
Professor Aileen Clarke Professor of Public Health and Health Services Research, Warwick Medical School, University of Warwick, UK
Dr Tessa Crilly Director, Crystal Blue Consulting Ltd, UK
Dr Peter Davidson Director of NETSCC, HTA, UK
Ms Tara Lamont Scientific Advisor, NETSCC, UK
Professor Elaine McColl Director, Newcastle Clinical Trials Unit, Institute of Health and Society, Newcastle University, UK
Professor William McGuire Professor of Child Health, Hull York Medical School, University of York, UK
Professor Geoffrey Meads Professor of Health Sciences Research, Health and Wellbeing Research and
Professor John Norrie Health Services Research Unit, University of Aberdeen, UK
Professor John Powell Consultant Clinical Adviser, National Institute for Health and Care Excellence (NICE), UK
Professor James Raftery Professor of Health Technology Assessment, Wessex Institute, Faculty of Medicine, University of Southampton, UK
Dr Rob Riemsma Reviews Manager, Kleijnen Systematic Reviews Ltd, UK
Professor Helen Roberts Professor of Child Health Research, UCL Institute of Child Health, UK
Professor Helen Snooks Professor of Health Services Research, Institute of Life Science, College of Medicine, Swansea University, UK
Professor Jim Thornton Professor of Obstetrics and Gynaecology, Faculty of Medicine and Health Sciences, University of Nottingham, UK
Please visit the website for a list of members of the NIHR Journals Library Board: www.journalslibrary.nihr.ac.uk/about/editors
Editorial contact: [email protected] Development Group, University of Winchester, UK
Centre of Evidence-Based Dermatology, University of Nottingham, UK
Abstract
A programme of studies including assessment of
diagnostic accuracy of school hearing screening tests
and a cost-effectiveness model of school entry hearing
screening programmes
Heather Fortnum,
1Obioha C Ukoumunne,
2Chris Hyde,
3*
Rod S Taylor,
3Mara Ozolins,
1Sam Errington,
1Zhivko Zhelev,
2Clive Pritchard,
4Claire Benton,
5Joanne Moody,
6Laura Cocking,
7Julian Watson
8and Sarah Roberts
41National Institute for Health Research, Nottingham Hearing Biomedical Research Unit, Hearing and Otology Group, Division of Clinical Neuroscience, School of Medicine, University of Nottingham, Nottingham, UK
2National Institute for Health Research, Collaborations for Leadership in Applied Health Research and Care South West Peninsula, University of Exeter Medical School, Exeter, UK
3Institute of Health Research, University of Exeter Medical School, Exeter, UK 4Optimity Advisors, Kemp House, London, UK
5Nottingham Audiology Services, Nottingham University Hospitals, Nottingham, UK 6Cambridgeshire Community Services, Community Child Health, Ida Darwin Hospital,
Fulbourn, Cambridge, UK
7Peninsula Clinical Trials Unit, Plymouth University Peninsula Schools of Medicine and Dentistry, Plymouth, UK
8Parent representative, Nottingham, UK *Corresponding author [email protected]
Background:Identification of permanent hearing impairment at the earliest possible age is crucial to maximise the development of speech and language. Universal newborn hearing screening identifies the majority of the 1 in 1000 children born with a hearing impairment, but later onset can occur at any time and there is no optimum time for further screening. A universal but non-standardised school entry screening (SES) programme is in place in many parts of the UK but its value is questioned.
Objectives:To evaluate the diagnostic accuracy of hearing screening tests and the cost-effectiveness of the SES programme in the UK.
Design:Systematic review, case–control diagnostic accuracy study, comparison of routinely collected data for services with and without a SES programme, parental questionnaires, observation of practical implementation and cost-effectiveness modelling.
Setting:Second- and third-tier audiology services; community.
Participants:Children aged 4–6 years and their parents.
Results:The review of diagnostic accuracy studies concluded that research to date demonstrates marked variability in the design, methodological quality and results. The pure-tone screen (PTS)
(Amplivox, Eynsham, UK) and HearCheck (HC) screener (Siemens, Frimley, UK) devices had high sensitivity (PTS≥89%, HC≥83%) and specificity (PTS≥78%, HC≥83%) for identifying hearing impairment. The rate of referral for hearing problems was 36% lower with SES (Nottingham) relative to no SES (Cambridge) [rate ratio 0.64, 95% confidence interval (CI) 0.59 to 0.69;p<0.001]. The yield of confirmed cases did not differ between areas with and without SES (rate ratio 0.82, 95% CI 0.63 to 1.06;p=0.12). The mean age of referral did not differ between areas with and without SES for all referrals but children with confirmed hearing impairment were older at referral in the site with SES (mean age difference 0.47 years, 95% CI 0.24 to 0.70 years;p<0.001). Parental responses revealed that the consequences to the family of the referral process are minor. A SES programme is unlikely to be cost-effective and, using base-case
assumptions, is dominated by a no screening strategy. A SES programme could be cost-effective if there are fewer referrals associated with SES programmes or if referrals occur more quickly with SES programmes.
Conclusions:A SES programme using the PTS or HC screener is unlikely to be effective in increasing the identified number of cases with hearing impairment and lowering the average age at identification and is therefore unlikely to represent good value for money. This finding is, however, critically dependent on the results of the observational study comparing Nottingham and Cambridge, which has limitations. The following are suggested: systematic reviews of the accuracy of devices used to measure hearing at school entry; characterisation and measurement of the cost-effectiveness of different approaches to the ad-hoc referral system; examination of programme specificity as opposed to test specificity; further observational comparative studies of different programmes; and opportunistic trials of withdrawal of SES programmes.
Trial registration:Current Controlled Trials ISRCTN61668996.
Contents
List of tables xiii
List of figures xvii
List of abbreviations xix
Plain English summary xxi
Scientific summary xxiii
Chapter 1Background and main questions 1
Childhood hearing impairment and screening 1
Previous Health Technology Assessment study 3
Assessment of cost-effectiveness 3
Study aims and objectives 4
Structure of the project and the report 4
Patient and public involvement 6
Chapter 2Update of the diagnostic accuracy systematic review 7
Introduction 7
Objectives 7
Methods 7
Search strategy 7
Inclusion/exclusion criteria 8
Selection of studies and data extraction 8
Assessment of the methodological quality 9
Statistical analysis and data synthesis 9
Results 9
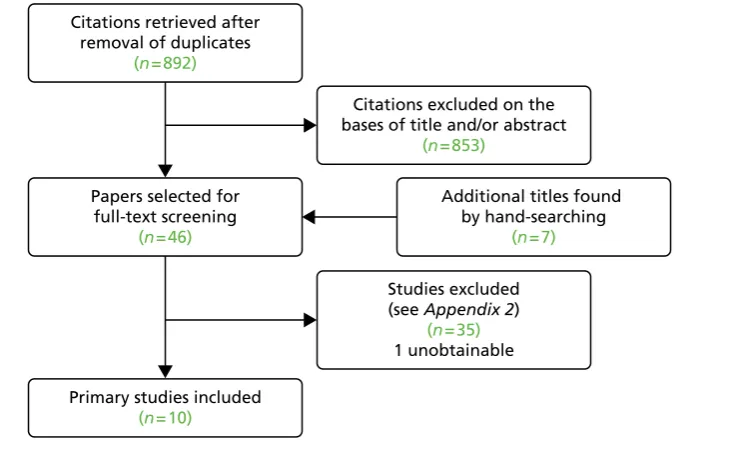
Search results and selection of studies 9
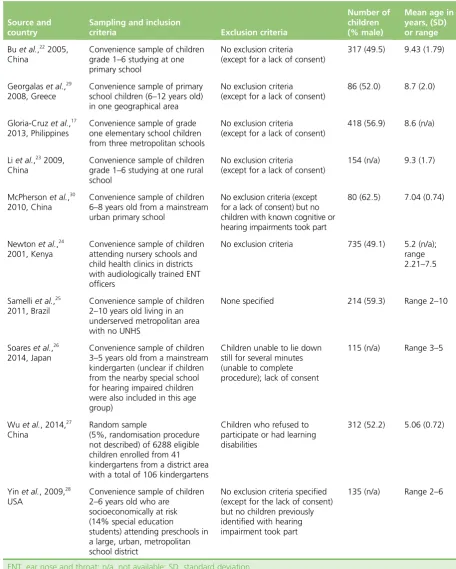
Characteristics of included studies 10
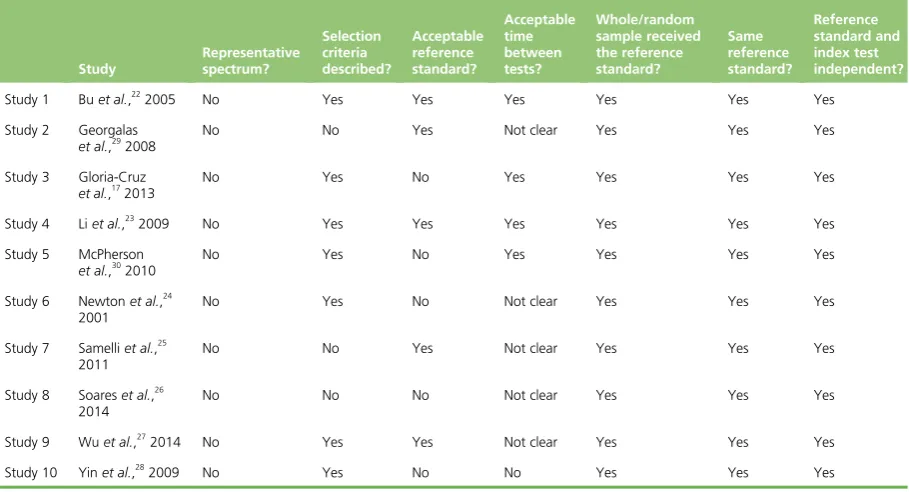
Methodological quality of included studies 15
Test accuracy 15
Discussion 22
Summary of the findings from the 2007 Health Technology Assessment report 22
Combining the results from the 2007 Health Technology Assessment report and
the current update 23
Conclusion 25
Chapter 3Diagnostic accuracy of the pure-tone screen and HearCheck screener
for identifying hearing impairment in school children 27
Introduction 27
Objectives 27
Methods 28
Design 28
Recruitment 28
Assessment 29
Screening tests 30
Sample size calculation 32
Statistical analysis 32
Missing data 33
Results 33
Participants 33
Demographic characteristics 37
Time interval between screening test and reference standard for children nominally
recruited as cases 38
Missing data and indeterminate results 38
Concordance between nominal case–control status and pure-tone audiometry
reference standard classification 38
Accuracy of the pure-tone screen and HearCheck screener for identifying hearing
impairment at the level of the ear 39
Accuracy of the pure-tone screen and HearCheck screener for identifying hearing
impairment at the level of the child 43
Discussion 46
Strengths and limitations 47
Results in comparison with other studies 49
Chapter 4False-negative results from screening tests 51
Introduction 51
Objectives 52
Methods 52
Results 52
Literature review 52
Diagnostic accuracy study (seeChapter 3) 53
Discussion 55
Chapter 5Comparison of a site with a school hearing screening programme (Nottingham) with a site without a school hearing screening programme
(Cambridge) 57
Introduction 57
Objectives 57
Methods 57
Background to study sites 57
Data collection 61
Statistical analysis 62
Results 62
Referral rate and yield 62
Discussion 66
Strengths and limitations 67
Chapter 6Exploring the impact on the child and family of a child being referred
by the school hearing screen: findings from a questionnaire survey 69
Introduction 69
Objectives 69
Methods 69
Study population 69
Questionnaire 69
Data collection 69
Results 70
Quantitative data 70
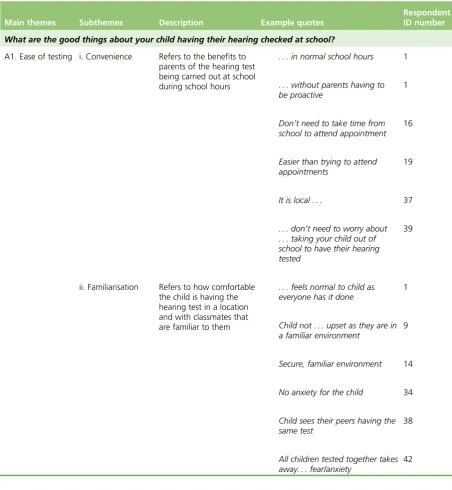
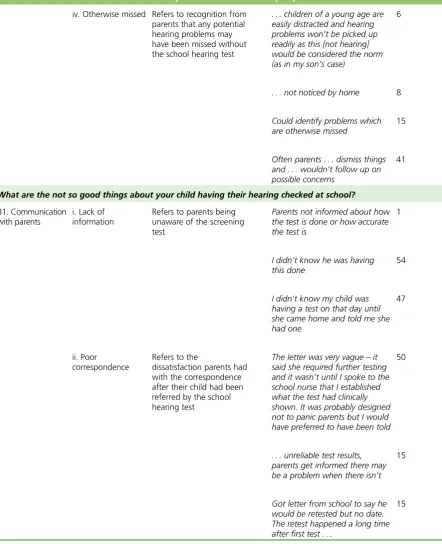
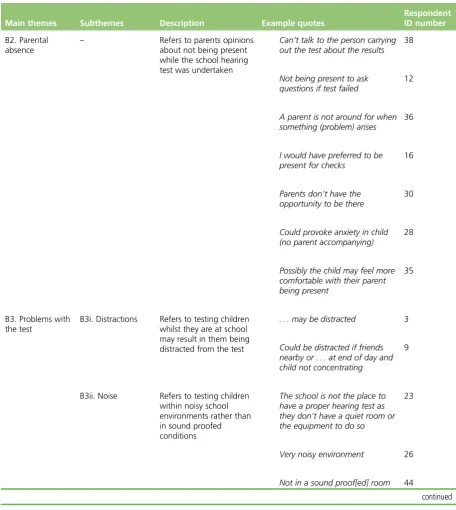
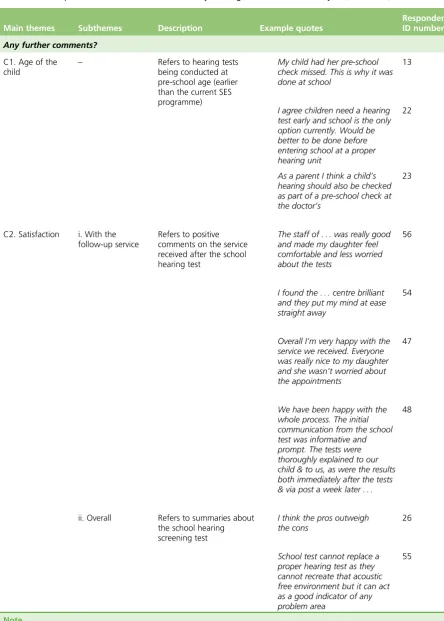
Qualitative data 72
Discussion 77
Main findings 77
Strengths and weaknesses 77
Results in the context of other studies 78
Chapter 7Observations of the practical implementation of screening tests for
hearing in schools 79
Introduction 79
Objectives 79
Methods 79
Sample size 80
Analysis 81
Results 81
Time taken 81
Observations of researchers and nurses 82
Discussion 83
Strengths and weaknesses 83
Results in the context of other studies 83
Chapter 8Modelling cost-effectiveness of school entry hearing screening 85
Introduction 85
Objectives 85
Methods 85
Overall approach 85
Decision-analytic structure 87
Initial model development 89
Model development incorporating new clinical data 90
Total referrals and cases of hearing impairment 91
Distribution of referrals over time 92
Management of hearing impairment 93
Sources of parameter inputs 93
Reviews of the literature 94
Referrals 94
Number of children with hearing impairment 95
Diagnostic accuracy 95
Probabilities of hearing impairment by severity 96
Management probabilities 96
Resource use and costs 96
Screening costs 96
Cost of travelling to appointments 97
Unit costs of the pure-tone screen and HearCheck screener 97
Management costs 99
Utilities 99
Modelling the potential costs and consequences of false-positive results 99
Results 101
Number of referrals to diagnostic evaluation and numbers diagnosed with
hearing impairment 101
School entry hearing screening versus no screening: costs and quality-adjusted life-years 102
Sensitivity analysis 103
Discussion 104
Discussion of key assumptions 104
Strengths and weaknesses 105
Findings in comparison with other health economic evaluations 106
Chapter 9Conclusions and recommendations 107
Summary of findings 107
Systematic review of diagnostic accuracy (seeChapter 2) 107
Diagnostic accuracy study (seeChapter 3) 107
Assessment of false negatives (seeChapter 4) 107
Comparison of school entry hearing screening and non-school entry hearing
screening services (seeChapter 5) 107
Survey of parents (seeChapter 6) 108
Practical implementation (seeChapter 7) 108
Cost-effectiveness of school entry hearing screening (seeChapter 8) 108
Discussion 108
Overall conclusions and recommendations 111
Implications for practice 111
Implications for research 111
Acknowledgements 113
References 117
Appendix 1Executive summary from 2007 report 121 Appendix 2Systematic review 125 Appendix 3Diagnostic accuracy study: information 139 Appendix 4The relationship between the pure-tone screen and HearCheck
screener results 159
Appendix 5Parent questionnaire 165 Appendix 6Practical implementation of screening tests for hearing in
List of tables
TABLE 1 Study characteristics: sampling and participants 10 TABLE 2 Study characteristics: index test and reference standard 11 TABLE 3 Results from the methodological quality assessment 16 TABLE 4 Diagnostic accuracy outcomes 20 TABLE 5 Sensitivities and specificities of all studies evaluating questionnaires and included in the 2007 HTA report and the current update 23 TABLE 6 Sensitivities and specificities of all studies evaluating audiometry-based
tests and included in the 2007 HTA report and the current update 24 TABLE 7 Sensitivities and specificities of all studies evaluating TEOAE and
included in the 2007 HTA report and the current update 24 TABLE 8 Numbers of invitations, replies and consents by centre 35 TABLE 9 Demographic characteristics of recruited children 37 TABLE 10 Time interval in weeks between administering the screening tests
(PTS and HC) and the reference standard (PTA) for children nominally recruited
as cases only (n=75) 38
TABLE 11 Cross-tabulation of the PTS vs. HC test results: impaired ears defined as those with a PTA score of≥30 dB on at least one of the four frequencies– analyses include all impaired ears regardless of whether belonging to children
nominally recruited as cases or controls 42
TABLE 12 Accuracy of the PTS and HC screener in ear-level analyses: impaired ears defined as those with a PTA score of≥30 dB on at least one of the four frequencies–analyses include all impaired ears regardless of whether belonging
to children nominally recruited as cases or controls 42 TABLE 13 Accuracy of the PTS and HC screener at ear level across different
definitions of impairment status and using different subsets of impaired ears
based on whether they belong to children nominally recruited as cases or controls 43 TABLE 14 Cross-tabulation of the PTS vs. HC test results: impaired children
defined as those with a PTA score of≥30 dB on at least one of the four frequencies in at least one ear–analyses include all children regardless of
whether nominally recruited as case or control 45
TABLE 15 Accuracy of the PTS and HC screener in child-level analyses: impaired children defined as those with a PTA score of≥30 dB on at least one of the four frequencies in at least one ear–analyses include all impaired children regardless
TABLE 16 Accuracy of the PTS and HC tests at child level across different
definitions of impairment status and using different subsets of impaired children based on whether they were nominally recruited as cases or controls 46 TABLE 17 Two-by-two table of the PTS and HC test results for hypothetical
screening population of 10,000 children where the prevalence of impairment is
0.5% and given the child-level accuracy estimates 47 TABLE 18 Comparison of referral and yield rates (as at last appointment)
between Nottingham and Cambridge expressed per 1000 children per year 63 TABLE 19 Percentage of referred children who were subsequently confirmed as
cases (at last appointment), stratified by site and, for Nottingham, whether or
not referral was via SES 63
TABLE 20 Comparison of the mean age of referral (in years) between
Nottingham and Cambridge 63
TABLE 21 Characteristics of children referred 64 TABLE 22 Characteristics of confirmed cases of hearing loss 65 TABLE 23 Parental anxiety about school hearing screen referral 71 TABLE 24 What parents think about the school entry hearing screen:
thematic analysis 72
TABLE 25 Time taken (minutes) to do screening tests and comparison between
the PTS and HC screener 81
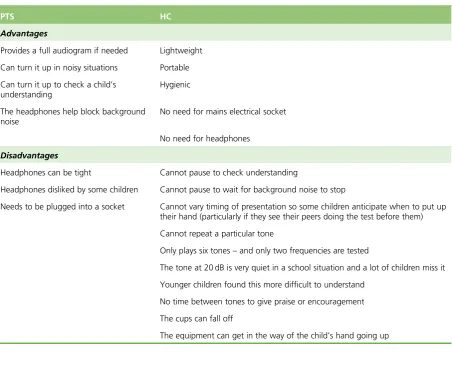
TABLE 26 Advantages and disadvantages of the PTS and the HC screener as
observed when used by school nurses 82
TABLE 27 Ratings of three nurses on the practical implementation of the PTS and HC screener in schools on 20 occasions–scoring from 0 (low) to 10
(maximum) 82
TABLE 28 Key data points derived from clinical studies 91 TABLE 29 Screening results: persons per hypothetical cohort of 10,000
children screened 92
TABLE 30 Diagnostic accuracy 92 TABLE 31 Percentage of children being referred to diagnostic evaluation by
year: base case 93
TABLE 32 Distribution of referrals by type of referral 93 TABLE 33 Data sources used for the current model in comparison with the 2007
HTA report 94
TABLE 35 Distribution of hearing impairment states 96 TABLE 36 Distributions of management types 97 TABLE 37 Unit costs of the PTS and HC tests 98 TABLE 38 Unit costs of all non-screening forms of identification 99 TABLE 39 NHS management-related reference costs used in the model 100 TABLE 40 Utilities used in the model 100 TABLE 41 Rate at which children are referred to diagnostic evaluation with
audiologist in each model arm: base case 101
TABLE 42 Rate at which children are diagnosed in each model arm (based on a
hypothetical 10,000 population) 101
TABLE 43 Undiscounted costs 102
TABLE 44 Discounted costs 102
TABLE 45 Quality-adjusted life-years for children with hearing impairment 102 TABLE 46 Incremental costs and QALYs (discounted) 103 TABLE 47 Cross-tabulation of the PTS vs. HC results for ear-level analysis:
analyses include only impaired ears that belong to children recruited as cases– impaired ears defined as those with a PTA score of≥30 dB on at least one of the
four frequencies 159
TABLE 48 Cross-tabulation of the PTS vs. HC test results for ear-level analyses: analyses include only impaired ears that belong to children recruited as controls– impaired ears defined as those with a PTA score of≥30 dB on at least one of the
four frequencies 160
TABLE 49 Cross-tabulation of the PTS vs. HC test results for ear-level analyses: analyses include all impaired ears regardless of whether belong to children recruited as case or control–impaired ears defined as those with an average
PTA score of≥30 dB across the four frequencies 160 TABLE 50 Cross-tabulation of the PTS vs. HC test results for ear-level analyses:
analyses include only impaired ears that belong to children recruited as cases– impaired ears defined as those with an average PTA score of≥30 dB across the
four frequencies 161
TABLE 51 Cross-tabulation of the PTS vs. HC test results for ear-level analyses: analyses include only impaired ears that belong to children recruited as controls– impaired ears defined as those with an average PTA score of≥30 dB across the
TABLE 52 Cross-tabulation of the PTS vs. HC test results for child-level analyses: analyses include only impaired children who were nominally recruited as cases–impaired children defined as those with an PTA score of≥30 dB on at
least one of the four frequencies 162
TABLE 53 Cross-tabulation of the PTS vs. HC test results for child-level analyses: analyses include only impaired children who were nominally recruited as controls–impaired children defined as those with a PTA score of≥30 dB on at
least one of the four frequencies 162
TABLE 54 Cross-tabulation of the PTS vs. HC test results for child-level analyses: analyses include all impaired children regardless of whether recruited as case or control–impaired children defined as those with an average PTA score of
≥30 dB across the four frequencies 163
TABLE 55 Cross-tabulation of the PTS vs. HC test results for child-level analyses: analyses include only impaired children who were nominally recruited as cases–impaired ears defined as those with an average PTA score of≥30 dB
across the four frequencies 163
TABLE 56 Cross-tabulation of the PTS vs. HC test results for child-level analyses: analyses include only impaired children who were nominally recruited as controls–impaired ears defined as those with an average PTA score of≥30 dB
List of figures
FIGURE 1 Planned participant flow 5 FIGURE 2 Flow diagram of the selection process 9 FIGURE 3 Forest plot of sensitivity and specificity of different types of hearing
screening tests 18
FIGURE 4 Summary ROC plot of different hearing screening tests 19
FIGURE 5 The HC screener 30
FIGURE 6 Numbers of case children in the diagnostic accuracy study 34 FIGURE 7 Numbers of control children in the diagnostic accuracy study 37 FIGURE 8 Nominal recruitment status at the ear level and the reference standard classification by or of hearing impairment status based on a PTA score of≥30 dB
on at least one of the four frequencies 40
FIGURE 9 Nominal recruitment status at the child level and the reference standard classification by or of hearing impairment status based on a PTA score
of≥30 dB on at least one of the four frequencies for at least one ear 40 FIGURE 10 Pure-tone screen results at the ear level by hearing impairment status based on a PTA score of≥30 dB on at least one of the four frequencies 41 FIGURE 11 HearCheck screener test results at the ear level by hearing
impairment status based on a PTA score of≥30 dB on at least one of the
four frequencies 41
FIGURE 12 Pure-tone screen test results at the child level by hearing impairment status based on a PTA score of≥30 dB on at least one of the four frequencies in
at least one ear 44
FIGURE 13 HearCheck test results at the child level by hearing impairment status based on a PTA score of≥30 dB on at least one of the four frequencies in at
least one ear 44
FIGURE 14 False negatives from diagnostic accuracy study (PTA average criterion:
average of four frequencies is≥30 dB 54
List of abbreviations
AABR automated auditory brainstem response
CCS Cambridgeshire Community Services
CHAC Children’s Hearing Assessment Centre
CHQS Chinese Hearing Questionnaire for School Children
CI confidence interval CRF case report form
DEA diagnostic evaluation with an audiologist
ENT ear, nose and throat GP general practitioner
HC HearCheck
HI hearing impaired HL hearing level
HTA Health Technology Assessment ICER incremental cost-effectiveness ratio ID identifier
IQR interquartile range
NHBRU Nottingham Hearing Biomedical Research Unit
NHI not hearing impaired NHSP Newborn Hearing Screening
Programme
NICE National Institute for Health and Care Excellence
NIHR National Institute for Health Research
OAE otoacoustic emission OME otitis media with effusion PenCTU Peninsula Clinical Trials Unit PSA probabilistic sensitivity analysis PTA pure-tone audiometry
PTS pure-tone screen QALY quality-adjusted life-year QUADAS quality assessment of diagnostic
accuracy studies
ROC receiver operating characteristic SD standard deviation
SES school entry screen(ing) SNPC sensorineural or permanent
conductive
TEOAE transient-evoked otoacoustic emission
UNHS Universal Newborn Hearing Screening
Plain English summary
D
iscovering if a child has problems with their hearing is important for development and education. Screening babies when they are born identifies most problems but hearing problems can start at any age. Many parts of the UK screen children for hearing problems when they start school but others have stopped doing this. We wanted to see whether having the screen was better or worse than not having it. We also wanted to see what was the best test to use.We compared the screening test that is most commonly used, the pure-tone screen (PTS) (Amplivox, Eynsham, UK), with a hand-held device, the HearCheck screener (Siemens, Frimley, UK), which might be quicker to use but has not been used in schools before.
We found the two tests were equally good at finding children with hearing problems but that school nurses preferred to use the PTS.
We compared an area that has a school hearing screening programme (Nottingham) with an area that does not (Cambridge). We found that more children were referred for further testing in the area that did not have the screen but there was little evidence of a difference between the areas in terms of finding the children with problems.
Scientific summary
Background
Identification of permanent hearing impairment at the earliest possible age is crucial to maximise the development of speech and language, and contribute to the best opportunities for educational achievement and quality of life. Approximately 1 in every 1000 children in the UK is born with a permanent bilateral hearing impairment>40 dB (average across four frequencies: 0.5, 1, 2 and 4 kHz) and a further 0.6 per 1000 has a unilateral impairment. This equates to 800 children per year born with a permanent bilateral hearing impairment (moderate or greater) and 500 with a unilateral impairment. The introduction of the highly sensitive and specific Universal Newborn Hearing Screening (UNHS) programme has led to the identification of the vast majority of children born with a hearing impairment who undergo the screen. However, not all children who will ultimately have a hearing impairment are identifiable at birth.
The adjusted prevalence of permanent hearing impairment>40 dB (average of 0.5, 1, 2 and 4 kHz) at age 3 years is reported as 1.07 per 1000 and the prevalence for children aged 9–15 years as 2.05 per 1000. Thus, because of acquisition, progression or late onset of hearing impairment and/or geographical movement of families, there remains a significant number of children to be identified with a permanent hearing impairment after the newborn period. The onset of hearing impairment in children can occur at any time, which means there is no optimum time for a further universal hearing screen. The universal distraction hearing test, established in the UK in the 1950s and undertaken by health visitors at around 8 months of age, was abandoned following the introduction of UNHS, based on a lack of robust implementation and a low yield of cases. Without formal screening between the newborn period and school entry, identification of hearing impairment in children is achieved through parental and professional awareness and a close follow-up of children who pass the neonatal screen but are considered to be at risk. A universal hearing screen when children start school, the school entry screening (SES) programme, was established in 1955 and remains in place in many parts of the UK. It is considered as a‘back-stop’screen to identify children as part of a‘captive population’at school entry.
Objectives
The overarching aims of this project were to evaluate the diagnostic accuracy of hearing screening tests and the cost-effectiveness of screening for hearing impairment at school entry in the UK.
The specific research objectives of this project were:
l to update the latest systematic review of diagnostic accuracy of tests used for SES, summarising the literature that has been published since the previous review and drawing together the evidence from the previous review and the updated review
l to estimate and compare the diagnostic accuracy of the pure-tone screen (PTS) (Amplivox, Eynsham, UK), and HearCheck (HC) screener (Siemens, Frimley, UK) tests for discriminating between children with a hearing impairment (of any type) and children with no hearing impairment, using pure-tone audiometry (PTA) results as the reference standard
l to compare children referred for investigation of suspected hearing impairment in a geographical area that applies a routine SES programme (Nottingham) with those referred in an area with no routine SES programme (Cambridge) with respect to the number of referrals, the age at referral, the source of referral, the route through assessment to intervention, the number of children ultimately identified to have a hearing impairment (yield) and the nature of hearing impairment identified
l to determine the impact, both psychological and economic, for the child and the family of the child being referred for further assessment following SES (both true and false positives)
l to determine the time resource in implementing either of the two alternative screening methods (PTS and HC) in primary schools and to elicit the views of the school nurses implementing the screening tests
l to refine an existing SES economic model {from the 2007 Health Technology Assessment (HTA) report [Bamford J, Fortnum H, Bristow K, Smith J, Vamvakas G, Davies L,et al.Current practice, accuracy, effectiveness and cost-effectiveness of the school entry hearing screen.Health Technol Assess2007;11(32)]} and assess the cost-effectiveness of the SES programme
l to estimate the health-related quality of life, costs and utilities of the SES programme compared with no screening, and of the PTS compared with HC screener, with comparisons based on cost per quality-adjusted life-year (QALY) gained.
Methods
In order to explore and summarise the existing literature we updated the review of diagnostic test accuracy reported in a previous HTA report and reviewed the literature on false-negative rates in hearing screening.
For children with a known hearing impairment and for children assumed to have no hearing impairment we compared the diagnostic accuracy of two screening methods administered at or around the time children start school. These were the established and widely used PTS (which is applied using headphones) and HC screener (a hand-held PTS). We used PTA as a reference standard.
The yield, referral age and route through assessment to intervention for childhood hearing impairment were assessed for a paediatric audiology service that implements a routine universal SES programme (Nottingham) and one that does not (Cambridge) by collecting data prospectively for all children aged between 3 years and 6 years 364 days.
We surveyed parents of children referred from the SES programme in Nottingham via a postal
questionnaire to assess the impact for the child and the family of a positive result from a screen (both true and false positives).
We determined the time spent in implementing either of the two screening tests in primary schools and explored the practical issues involved and the views of nurses conducting the screening tests.
Results
The updated review of diagnostic accuracy studies confirms the conclusion from the 2007 HTA report that research to date demonstrates marked variability in the design, methodological quality and results. Robust conclusions about the performance of individual test types for use in SES cannot be drawn. It was
found that:
l Parental questionnaires had the poorest diagnostic accuracy compared with all other tests.
l The findings from the new audiometry-based studies evaluating computer-based devices and the HC screener reported higher and more consistent specificity but lower and widely varying sensitivity estimates compared with the sweep PTA studies included in the original report.
l Studies evaluating transient-evoked otoacoustic emissions reported variable sensitivity with wide confidence intervals (CIs), whereas specificity estimates were relatively high and more consistent. l The study evaluating the automated auditory brainstem response reported high sensitivity
and specificity.
The review included studies from countries with and without an established UNHS system and with very different systems of health-care delivery. The generalisability of the findings to other situations, including the UK NHS system, is likely to be limited.
The findings of our diagnostic accuracy study indicate that the PTS and HC devices have a high level of sensitivity (PTS≥89%, HC≥83%) and specificity (PTS≥78%, HC≥83%) for identifying hearing impairment at the level of the ear. These conclusions appear robust, the child-level analyses indicating similar levels of sensitivity and specificity.
From our review of the existing literature and data from the diagnostic accuracy study, we are unable to quantify the effect of false-negative results for the PTS or HC screener, but were able to confirm that the rate was extremely low. Of the 16 ears in our diagnostic study (totaln=630) that passed one or both of the screening tests but were referred by the PTA measure, only four were confirmed to have a hearing impairment at diagnostic evaluation and all were mild.
There was strong evidence that the rate of referral for hearing problems is lower when a SES programme is present. The referral rate was 36% lower in Nottingham (SES) relative to Cambridge (no SES) (rate ratio 0.64, 95% CI 0.59 to 0.69;p<0.001).
There was little evidence that the yield of confirmed cases differs between areas with and without a SES programme (rate ratio 0.82, 95% CI 0.63 to 1.06;p=0.12); a higher proportion of referred children were subsequently confirmed to be hearing impaired in the area with a SES programme (17.0% in Nottingham vs. 10.6% in Cambridge).
The mean age of referral was nearly identical between areas with and without a SES programme when looking at all referrals, but for children who were subsequently confirmed as having a hearing impairment there was strong evidence that the children in the site with a screening programme are older at referral (mean age difference 0.47 years, 95% CI 0.24 to 0.70 years;p<0.001).
We found from our survey of parents of children referred by the SES programme in Nottingham that the consequences of the referral process for parents and children, including false positives, are minor. The difference for parents whose child is referred by the SES programme is that they may have had no concerns prior to the screening test.
Our economic modelling showed that SES is unlikely to be cost-effective and, using base-case assumptions, is dominated by a no screening strategy. This is consistent with the observed results of the clinical studies, which suggest that cases of hearing impairment are identified in similar numbers but at a younger average age in the absence of SES.
Two situations where SES might be cost-effective were identified. In the first situation, a reduction in the number of referrals associated with SES or, conversely, an increase in referrals without SES, can give a cost-effectiveness ratio for the no screening option above the National Institute for Health and Care Excellence (NICE) £30,000 per QALY benchmark. This is supported by the observation from our clinical study that the referral rate (and by assumption, potential false positive rate) was lower in the site where SES had been in place for many years. However, in order for this to be the case, the reduction in referrals would need to be attributable to SES and there is considerable uncertainty about this. The second situation is subject to still greater uncertainty and requires referrals to happen more quickly with screening than is observed from our study comparing SES and non-SES sites.
Conclusions
In the context of the UK NHS, and similar health-care systems, SES using screening tests, such as the PTS and HC screener, is unlikely to be effective in increasing the number of cases of hearing impairment identified and lowering the average age at which these cases were identified. SES is also unlikely to be cost-effective when judged against the benchmarks normally used by NICE, relative to a system entirely reliant on ad-hoc referral when a suspicion of hearing impairment is raised.
Implications for practice
Although our finding of the lack of cost-effectiveness of SES may be considered as a reason to withdraw SES where it is currently being practised, we would highlight aspects of the results that suggest caution. First, we have shown that there are at least two scenarios in which it may be cost-effective. Second, our findings are very dependent on findings in the two specific areas (Nottingham and Cambridge) that were used here, and our conclusions from comparing areas with a SES programme and without a SES programme may not be generalisable to other areas. Third, the cost-effectiveness of SES depends on how effective (or ineffective) the‘no SES system’is. This in turn is highly dependent on the effectiveness of ad-hoc identification and referral for a diagnostic evaluation with an audiologist (DEA), which is not only largely unknown, but likely to be variable. It seems plausible that SES may have greater potential to be cost-effective where ad-hoc identification and referral is less well developed than in a system where it is well established. If withdrawal of the SES programme is to be considered it needs to be carefully managed to ensure that the ad-hoc referral system is working effectively. Health professionals, school and nursery staff, and parents who would then be responsible for referral of children about whom there were concerns in the school entry year may need to be reminded to be more vigilant for signs of hearing impairment.
Implications for research
Systematic reviews of the accuracy of devices, which might be used to measure hearing in children at around school entry age, should continue to be pursued.
Characterising and measuring the cost-effectiveness of different approaches to the ad-hoc referral system with a view to optimising it should be undertaken.
We should improve understanding of why the referral rate varies across different sites and determine if this is related to the presence of SES. Further observational studies similar to our comparison between
Nottingham and Cambridge could be undertaken, albeit recognising the difficulty of matching the geographical areas.
Further research to better quantify the impact of referral, particularly with respect to anxiety, and whether or not all referrals are affected to the same degree as respondents in our study may be required,
particularly if it appears that overall effectiveness and cost-effectiveness could be critically dependent on the costs and disutility experienced by false positives.
If withdrawal of SES is contemplated in particular settings, this could be used as an opportunity for further data collection; in particular where the pattern of referrals and cases was known over many years in the run up to withdrawal, any change in pattern of referrals/cases could be very useful evidence confirming the lack of effectiveness and cost-effectiveness of SES, or challenging it. More formally, if SES cessation is being contemplated in many areas, a randomised trial of withdrawal of SES services could be designed using referrals and hearing impairment cases identified as outcomes.
Trial registration
This trial is registered as ISRCTN61668996.
Funding
Chapter 1
Background and main questions
Childhood hearing impairment and screening
Identification of permanent hearing impairment at the earliest possible age is crucial to maximise the development of speech and language and contribute to the best opportunities for educational achievement and quality of life.1Approximately 1 in every 1000 children born in the UK has a permanent bilateral hearing
impairment of>40 dB (average across four frequencies: 0.5, 1, 2 and 4 kHz) and a further 0.6 per 1000 has a unilateral impairment.2This equates to 800 children per year born with a permanent bilateral hearing
impairment (moderate or greater) and 500 with a unilateral impairment. The introduction of the highly sensitive and specific Universal Newborn Hearing Screening (UNHS) programme has led to the identification of the vast majority of children born with a hearing impairment who undergo the screen.3,4However, not all
children who will ultimately have a hearing impairment are identifiable at birth. Data published in 20015
reported an adjusted prevalence of permanent hearing impairment of>40 dB (average of 0.5, 1, 2 and 4 kHz) at age 3 years of 1.07 per 1000 and a prevalence for children aged 9–15 years of 2.05 per 1000. Thus, because of acquisition, progression or late onset of hearing impairment and/or geographical movement of families, there remain a significant number of children to be identified with a permanent hearing impairment after the newborn period. The onset of hearing impairment in children after the newborn period can occur at any time, which means there is no optimum time for a further universal hearing screen. The universal
distraction hearing test, established in the UK in the 1950s and undertaken by health visitors at around 8 months of age, was abandoned following the introduction of UNHS, based on a lack of robust implementation and a low yield of cases.6,7Identification of hearing impairment in children in the time
between the newborn period and school entry is achieved through parental and professional awareness and a close follow-up of children who pass the neonatal screen but are considered to be at risk.8A universal hearing
screen when children start school, the school entry screening (SES) programme, was established in 1955 and remains in place in many parts of the UK. It is considered as a‘back-stop’screen to identify children as part of a‘captive population’at school entry. Note: SES always refers to the hearing screening in this report.
A number of studies and reviews2,9–12have explored evidence for the value of the SES programme but
without clear conclusions. Research has shown that the number of children identified by this screen around age 5 years (the yield) has decreased following the introduction of UNHS, and widespread development of a system that is responsive to professional and parental concerns at any age.8,12The SES
programme is no longer universally applied. Bamfordet al.12reported in 2007 that one in eight services
had stopped offering the screen by 2005 and it is more likely that others have stopped since 2005 than that services have reinstated the screen. There are no guidelines on standard methodology nationally and procedures are variable. However, despite a lack of evidence of its value, many support its continuation as a‘back-stop’to identify an acknowledged small number of children who would otherwise not be identified with the consequent effect on their development of speech and language.
Childhood hearing impairment can be permanent (usually sensorineural although permanent conductive impairment also occurs) and will not improve, or transient (also referred to as conductive) and will usually fluctuate and can get better.
Many more children will have a transient hearing impairment at some point in their childhood than will have a permanent impairment. A conductive loss occurs when there is a problem with the outer or middle ear, such as impacted wax in the ear canal or a build up of fluid in the middle ear [otitis media with effusion (OME), which usually is associated with colds and respiratory tract infections]. Conductive impairments are usually temporary, unless there is a malformation of the outer or middle ear, which can lead to a permanent impairment. Prevalence is greatest in the first year of life and again at around age 4–5 years. For children <6 years, 80% will experience OME.13,14Most episodes of OME get better in a couple of months but a
small proportion (3–4%) can be persistent and severe and lead to problems with behaviour, communication and progress at school. It is therefore important to identify those children with an ongoing problem, as their hearing impairment needs management to ensure that they can access spoken language clearly. The recommended management options are initially to watch and wait. Owing to the fact that the majority of these transient impairments will resolve spontaneously, most children will be observed for 3 months before any active management takes place, then the usual options are surgical insertion of grommets if the child’s hearing impairment meets national recognised criteria,15or for them to be fitted with a hearing aid.
Some children with permanent sensorineural impairments may also have an additional transient conductive impairment that would require management.
Screening tests for hearing impairment identify any child who has a hearing impairment. The tests do not discriminate between a permanent impairment and a transient impairment. They are also able to identify a hearing impairment in one ear or in both ears. Thus, all children with a hearing impairment, whether permanent or transient, bilateral or unilateral, should be identified by the screening test if it is
100% sensitive.
Testing children between the ages of 4 and 6 years can be difficult. Most tests require the engagement of the child in a simple task, such as raising their hand or putting a ball on a stick. Some children may find it difficult to maintain their attention throughout the test and this can give rise to spurious results. It is important that the screener/tester has experience in working with children to enable them to identify when their attention could be affecting the results of the test and be able to change their own behaviour
accordingly to engage with the child. At any age it is possible that some children may not be able to co-operate with the testing because of specific learning or behavioural needs.
The pure-tone screen (PTS) (Amplivox, Eynsham, UK) test involves placing headphones over the child’s ears and then presenting pure tones across the key frequencies for speech understanding (0.5, 1, 2 and 4 kHz). The child needs to indicate by a simple action that they have heard a sound. The screen works on the basis that a child needs to hear two out of three presentations of each frequency at 20 dB hearing level (HL) in each ear to pass the screen.
The HearCheck (HC) screener (Siemens, Frimley, UK) is placed over the child’s ear and an automatic sequence of pure tones is played once at each of three levels at each of the frequencies 1 kHz (55 dB, 35 dB and 20 dB) and 3 kHz (75 dB, 55 dB, 35 dB), which is six tones in total. The child needs to indicate, usually by raising their hand that they have heard each tone.
Any child identified by a screening test as having a possible hearing impairment should be referred to audiology services, but many children at school entry have a transient conductive impairment and hence it is the case that many children referred will ultimately be found to have no permanent impairment.
This is important because there are conflicting opinions on the target group of children to be identified by SES. Should it be designed to only identify children with a permanent impairment for whom intervention is a priority, or should it be designed to identify any impairment to ensure every child is assessed
appropriately and intervention provided for all who would benefit, regardless of the permanence of the condition? For this report, in both the analyses of diagnostic accuracy inChapter 3and in the analyses of yield inChapter 5, we have considered identification of any type of impairment as the outcome for assessing the screening tests or the screening programme as a whole.
Previous Health Technology Assessment study
A previous National Institute for Health Research (NIHR) Health Technology Assessment (HTA) programme-commissioned study to evaluate SES by Bamfordet al.12reported a survey of current practice, longitudinal
data on yield, a systematic review of effectiveness of SES (which included a systematic review of the
diagnostic accuracy of screening tests) and an economic model estimating cost-effectiveness. The 2007 HTA report12concluded that there was insufficient good-quality data on which to base a decision about the value
of SES following the introduction of UNHS. The executive summary of the report is included asAppendix 1. However, the 2007 study did report longitudinal data from a single district in London which indicated a small but significant number of children with a permanent hearing impairment first identified via SES in that particular population,8and national survey data which reported examples of children not identified by
other methods.
One of the recommendations of the 2007 HTA report12was the need for trials to compare the
effectiveness and cost-effectiveness of alternative approaches to the identification of a post-newborn screen for permanent hearing impairment. Studies concerned with the relative accuracy (in terms of sensitivity and specificity) of alternative screening tests are difficult to compare and are often flawed by differing referral criteria and differing case definitions. The 2007 HTA report12identified 25 publications
reporting studies of alternative screens or tests for screening at school entry. These data indicate that, using full PTA as the reference standard, the PTS test appears to have high sensitivity and high specificity for minimal, mild and greater hearing impairments–better than alternative tests for which evidence was identified. Spoken word tests were reported with acceptable levels of sensitivity and specificity but are variable in their implementation. Otoacoustic emissions (OAEs), tympanometry, acoustic reflectometry, parental questionnaires and otoscopy were reported with either variable or poor sensitivity and specificity. Only one study, published in 1980,16has compared screening with no screening and the results
were inconclusive.
Assessment of cost-effectiveness
In order to best provide a service for the identification of permanent childhood hearing impairment while making best use of scarce NHS resources, it is important to gather robust evidence to support particular cost-effective implementations of service delivery at times relevant to the aetiology of hearing impairment and the child’s development. There is no question that screening for hearing impairment at birth is
efficient and cost-effective,3but the value of any further universal screen remains uncertain. Aside from the
minimal and very weak evidence for the effectiveness and cost-effectiveness of different implementations of SES reported by the 2007 HTA report12we are not aware of literature on the resource implications of
Study aims and objectives
The two overarching aims of this project were to evaluate the diagnostic accuracy of hearing screening tests and to assess the cost-effectiveness of screening for hearing impairment at school entry.
The specific research objectives of this project were:
l To determine and compare the diagnostic accuracy of two screening methods used to identify hearing impairment at or around school entry. These are the widely established PTS (which is applied using headphones) and the HC screener, a hand-held PTS.
l To investigate the impact of a potential false-negative result.
l To update the 2007 HTA report12systematic review of diagnostic accuracy of tests used for SES.
l To assess the yield, referral age and route through assessment to intervention for childhood hearing impairment and measure the costs of referrals for a service that employs a routine SES programme and for a service that does not.
l To determine the impact, both psychological and economic, on the child and the family of the child being referred for further assessment following the school entry hearing screen (both true and false positives).
l To determine the resource costs in implementing either of the two alternative screening methods in primary schools and to elicit the views of the school nurses implementing the screening tests. l To refine an existing SES economic model (from the 2007 HTA report12) and to assess the
cost-effectiveness of SES.
l To provide estimates of the yield and nature of hearing impairment detected in a system with no SES system; the yield, consequences and costs of screen-positive individuals in a SES system; and the costs of setting up a SES system.
This study thus addressed the question of whether or not there should be a screening programme to identify permanent hearing impairment in children when they start primary school. It assessed if the cost of such a screen is appropriate for the outcomes achieved, that is, the number of children identified by this method compared with a system with no screen, which is responsive to parental or professional concern, along with comparisons of diagnostic accuracy of two different ways of doing the screen. Based on the findings, we make recommendations to contribute to decisions regarding the continued implementation of SES and the form that implementation should take.
Structure of the project and the report
The project comprised four primary studies, a questionnaire survey and two systematic reviews. The planned participant flow for the four studies is illustrated inFigure 1.
Chapter 2reports results from a systematic review undertaken to update the 2007 HTA report12review of
diagnostic accuracy of tests used for SES.
Chapter 3reports results from the study that assessed the diagnostic accuracy of two methods of screening for the identification of hearing impairment for children aged 4–6 years. The PTS (four frequencies and one level) was compared with the HC screener (two frequencies and three levels) with respect to sensitivity and specificity.
Chapter 4reports results from a systematic review of the issues around false negatives in screening for hearing impairment, and from the diagnostic accuracy study described above.
80 hearing impaired children
PTS and HC
Reference standard (if not already done)
Calculate sensitivity Calculate specificity Measure • Yield • Age at referral • Disorder detected • Outcome of disorder
160 hearing children
PTS and HC PTS and HC
At risk in Cambridge 2012–14
Diagnostic accuracy Service comparison
Approximately 16 referrals per annum
Reference standard
Measure • Yield • Age at referral • Disorder detected • Outcome of disorder • Costs • Family
At risk in
Nottingham 2012–14 100 per annum referred from SES programme
Measure • Equipment cost • Time to complete test • Staff involved • Other costs
Schools
taking part in SES in Nottingham
Practical
implementation
in schools
180 children in six schools
Economic model
Cost-effectiveness
modellin
g
No patient flow
FIGURE
1
Planned
participant
Chapter 6reports results from a questionnaire survey of parents of children referred to audiology services in Nottingham from SES. Data on parent experience are reported.
Chapter 7reports results of a study of the practical implementation of the two screening tests in a primary school environment.
Chapter 8reports results from the cost-effectiveness model of SES. Data fromChapters 3,5,6and7 informed the parameters in the model.
Finally,Chapter 9summarises the discussion points from each part of the project and makes conclusions and recommendations.
Patient and public involvement
We acknowledge the importance of the involvement of members of the public in all health research. This project evaluated a screening system for children and input from parents to the development and interpretation of the research question was very important. Recruiting such a person proved challenging, as parents have childcare responsibilities and/or employment considerations, which mean they have little time to spare and commit to a 2.5-year project. Having advertised and discussed the project with several parents, most of whom were unable to commit the time, we recruited the parent of a child who had experienced conductive hearing impairment during his early school years. This parent became a full member of the research team (JW).
He provided comments on research literature for parents, including the questionnaire used for the survey of parents of children referred to audiology services from SES. He also contributed to the development of methodology, offering advice on how to deal with lower-than-expected recruitment. He attended all the meetings of the research team, either in person or via the telephone, and contributed to discussions of the findings, presentation of results and development of recommendations. The project addressed various issues concerned with the identification of hearing impairment in children, and we recognise that
Chapter 2
Update of the diagnostic accuracy
systematic review
Introduction
This chapter presents an update of the systematic review of the diagnostic test accuracy undertaken in the 2007 HTA report.12That report identified 25 publications reporting studies of alternative screens or tests for
screening at school entry, showing that, using full PTA as the reference standard, the PTS test appears to have high sensitivity and high specificity for minimal, mild and greater hearing impairments–better than alternative tests for which evidence was identified. Other tests (spoken word tests, OAEs, tympanometry, acoustic reflectometry, parental questionnaires and otoscopy) had either variable or poor sensitivity and specificity. Using additional evidence published since the 2007 HTA report, the aim of this update was to produce an updated summary of diagnostic test accuracy.
Objectives
To update the 2007 HTA report systematic review of diagnostic accuracy of tests used for SES. This work summarises the literature that has been published since the previous review and draws together the evidence from the previous review and the updated review.
Methods
Search strategy
The search strategy used and published in the 2007 HTA report on SES12was reviewed and updated
Inclusion/exclusion criteria
The inclusion and exclusion criteria were identical to those of the 2007 HTA report12unless
stated otherwise:
l Study design: we included all primary diagnostic accuracy studies regardless of their specific design. l Population: we included children 4–6 years old. We excluded studies with a discrete age range that was completely outside our criteria (e.g. 1–3 years or 7–10 years). If a study included 4- to 6-year-old children but the age range was too wide (e.g. 6–19 years) and the results for different age categories were not reported separately, the study was also excluded from the review. We included, however, studies that at least partially covered but slightly exceeded the 4–6 years age range (e.g. 5–10 years) provided they met all other inclusion criteria. Whenever relevant and possible, the age of the included children is noted in the list of excluded full-text studies (seeAppendix 2).
l Screening tests or programmes: studies that evaluated one or more of the following hearing screening tests were included: sweep PTA, single-frequency PTA, transient-evoked otoacoustic emissions (TEOAE), distortion product otoacoustic emissions, questionnaires, otoadmittance tests, tympanometry,
reflectometry and speech audiometry. (Note: sweep PTA and PTS are alternative terms for the same procedure. Where publications have used the term sweep PTA this description has been maintained.) Tests had to have been undertaken in either a primary school or the community [e.g. community clinic, family home or general practitioner (GP) surgery]. This could include hearing screening as a component of a multifaceted screen, such as a school entry medical examination.
l Comparator: no hearing screening or hearing screening based on different tests or test protocols. We did not exclude studies without a comparator (studies that evaluated a single screening test) as long as they measured the performance of the evaluated test against an acceptable reference standard. l Reference standard: we included all studies that assessed the accuracy of the evaluated test(s) against
a reference standard that included PTA.
l Outcomes: the 2007 HTA review12had a wider scope and also included studies that reported (1) the
screen performance, that is, uptake (the number of children who actually received the screen) and yield (the number of cases identified); and (2) screen effectiveness, that is, language skills, health-related quality of life, communication skills, social interaction and educational performance. The current update focused on diagnostic accuracy only and included studies that reported the diagnostic accuracy of the evaluated test(s), regardless of whether or not the reported data were sufficient to reconstruct two-by-two table(s). l Language: no language restrictions were applied to the search and selection of studies.
Selection of studies and data extraction
After removing the duplicates, all records identified by the electronic searches were screened
independently by two reviewers (HF and ZZ) at title and abstract level. Full-text copies were obtained for all publications identified as potentially relevant by at least one of the reviewers. Their suitability for inclusion in the review was assessed by one reviewer (ZZ) and checked by a second reviewer (CH) against the criteria specified above. Data were extracted from included studies by one reviewer (ZZ), entered into an Excel 2010 (Microsoft Corporation, Redmond, WA, USA) spreadsheet and checked by a second reviewer (CH).