Abstract-- Various uncertainties arise in the operation and management of power systems containing Renewable Energy Sources (RES). These uncertainties may arise due to system parameter changes or design parameter choice, affecting the systems power quality. In this work, the impact of uncertainties on the prediction of harmonic indices in a power system containing multiple Voltage Source Converters (VSCs) is investigated. The study focuses on the prediction of harmonic distortion level in multiple VSCs when some system or design parameters are only known within certain constraints. The Univariate Dimension Reduction (UDR) method was utilized in this study as an efficient predictive tool for the level of harmonic distortion of the VSCs measured at the Point of Common Coupling (PCC) to the grid. Two case studies were considered and the UDR technique was also experimentally validated. The obtained results were compared with that of the Monte Carlo Simulation (MCS) results.
Index Terms—Harmonics, Monte Carlo Simulation, Power Quality, Total Harmonic Distortion, Uncertainty, Univariate Dimension Reduction, Unscented Transform, Voltage Source Converters.
I. INTRODUCTION
ONTROLLABLE small distribution networks containing closed assemblage of distributed generators, Renewable Energy Systems (RES), storage systems and loads are becoming increasingly common in Electrical Power Systems (EPS). The optimization of RES, such as wind turbines and photovoltaics has been successful thus far. This can be attributed to the advancement and use of power electronic converters; which help to achieve higher power and voltage level operation in wind turbines and photovoltaics.
In recent years, the Voltage Source Converter (VSC) is popularly used and has enjoyed more attention than other converters due to its better controllability and fast switching responses [1, 2]. Nevertheless, VSCs generate harmonic voltages and currents that are transmitted to the rest of the grid. These harmonics may cause malfunction or damage of the power system and equipment on the system.
The first author would like to acknowledge the Petroleum Technology Development Fund (PTDF), Nigeria for supporting this research.
The authors are with the Department of Electrical and Electronics Engineering, Electrical Systems and Optics Research Group, University of Nottingham, Nottingham, UK. (e-mail: [email protected]; [email protected]; [email protected]; [email protected]).
On an EPS, harmonics can significantly increase and become difficult to predict where variations are present in certain factors like the operating conditions (output power) or system parameters (grid voltage background distortion) [3]. Furthermore, in a case where many VSCs are connected to the EPS, the net effect of the harmonics on the EPS’s Power Quality (PQ) becomes more challenging to predict as harmonics do not add up arithmetically. This and the inherent stochastic nature of harmonics, necessitates the use of statistical techniques in predicting the cumulative harmonic distortion level of power converters in an EPS. The use of statistical techniques was also suggested by the IEEE Probabilistic Aspects Task Force on Harmonics for quantifying harmonic distortions [4].
Statistical techniques such as the Monte Carlo Simulation (MCS) [5], have been extensively used as a common approach in predicting the harmonic distortion level of power converters [6, 7]. However, it requires tens of thousands of simulations to obtain an accurate prediction and this affects the feasibility of using such approach for systems containing large number of VSCs.
In some previous studies [8-14], an analytical approach was used to predict the level of harmonics generated by power converters. The studies represented harmonic vectors as phasors having random amplitudes and angles. The probability density functions (pdfs) of the phasors were obtained and represented in the rectangular coordinates for the convenience of adding phasors. In cases of a large number of harmonic sources/loads the harmonic phasor’s pdfs are then vectorially summed. The studies predicted harmonics in terms of low harmonic orders such as the 3rd, 5th, 7th and 11th harmonic
orders. This may be due to the type of power converter utilized (6/12 pulse converter) and their associated harmonics generated. In a VSC system, the majority of the harmonics appear at the switching frequency and multiplies of the switching frequency [1, 2]. Another way to quantify the harmonics would be to use the Total Harmonic Distortion (THD) [2].
Furthermore, an analytical approach usually entail assumptions to handle the complex interaction of a large number of random harmonic quantities [15, 16] and practical converter systems were usually simplified and represented by mathematical formulas to accommodate the approach as seen in [8-14]. However, other methods which do not require these simplification or assumptions in designing the systems/converters or in generating random occurrences can
Predicting Harmonic Distortion of Multiple
Converters in a Power System
P. M. Ivry,
Graduate Member, IEEE
, O. A. Oke,
Graduate Member, IEEE
, D. W. P. Thomas,
Senior
Member, IEEE
, and M. Sumner,
Senior Member, IEEE
be deployed. They include the Monte Carlo Simulation (MCS) [5, 17, 18], Unscented Transform (UT) [19, 20], Point Estimate Method (PEM) [21], and Univariate Dimension Reduction (UDR) [22, 23]. For instance, in Probabilistic Load Flow (PLF) studies, some of these methods have been utilized. The UDR which has proved successful for problems with complex and large number of statistical variation will be utilized in the probabilistic harmonic analysis because of its ability to drastically reduce computational cost, time and burden. In this study, practical VSC models are simulated with a full switching model.
In VSC design and utilization, the interfacing inductor value depends on the VSC switching frequency to achieve adequate attenuation of harmonics and it is usually chosen with a tradeoff between harmonic attenuation capability and filter cost. Furthermore, various formulas [24-28] can be used in estimating the inductance value with each giving a different filter size, thus contributing to the uncertainty. In most RES, output power is variable. For wind turbine systems, the output power is a function of the wind speed, while for photovoltaics, output power depends basically on incident sun rays on the photovoltaic cells. This gives rise to further uncertainty as wind speed/sun light varies with time, day, season and place. All these uncertainties have to be properly accounted for to ensure harmonic distortion within the EPS is within prescribed limits.
This paper presents a method for predicting current harmonics at the PCC of an EPS in the presence of uncertainties in the filter parameter and operating power of multiple VSCs. The level of harmonic distortion is quantified using statistical evaluators such the mean and standard deviation. The Univariate Dimension Reduction (UDR) for 3 and 5 points approximation is utilized. It is utilized as an alternative to the Monte Carlo Simulation (MCS) in predicting the harmonics distortion level of multiple connected VSCs because of its significant reduction of computational cost, time and burden associated with the MCS. The results obtained and the accuracy of the UDR for each of the cases were compared with the MCS and presented in the sections below. The results for the UDR technique were also validated using a laboratory experiment.
II. UNSCENTEDTRANSFORM ANDUNIVARIATEDIMENSION REDUCTION
A. Unscented Transform (UT)
The UT works by approximating a nonlinear mapping by a set of selected points called sigma points. The sigma points are developed using the moments of the distribution functions pdf, and the weighted average of the sigma points produces the expectation of the mapping [29]. The UT has been utilized in nonlinear problems in electromagnetic compatibility [19, 20, 30] and medical statistics amongst other fields [22]. This method can be used in approximating a continuous distribution function with pdf w(x) as a discrete distribution using deterministically chosen points called sigma points (Si) and
weights(wi) such that the moments of both distributions are
equal [31]. This is mathematically represented in (1);
(
k)
k( )
i iki
E x
x w x dx
w S
(1)Si contains the location of the abscissas at which the
function f(x) is to be evaluated while wi are the weighting
coefficients which when multiplied by Si gives an
approximation to the integral off(x).krepresents the moments of the expectation (E) where,k= 1 implies the mean value and
k= 2 implies variance.
The Gaussian quadrature technique is applied to solve (1) such that the integration points for integratingf(x)correspond to the desired sigma points Si. Hence, for a function f(x)
assumed as a polynomial, with pdf (weighting function)w(x), the nonlinear mapping for the expectation is given as;
( )
( ) ( )
i(
i)
i
E f x
f x w x d x
w f S
(2)The sigma points of the distribution function can be obtained as the roots of its associated orthogonal polynomial when (1) or (2) is integrated using Gaussian quadrature. This method can be easily applied, as most common distributions have known classical orthogonal polynomials associated with them. The associated orthogonal polynomials for some distribution functions can be found in [32].
B. Univariate Dimension Reduction (UDR)
The procedure discussed in the section above is only directly applicable when obtaining individual sigma points and weights. For problems involving more than one variable (N), the simplest technique is based on tensor product of the individual sigma points (n), giving the number of evaluations
Evas:
N
V
n
E
(3)Unfortunately, the technique is plagued by the curse of
dimensionality problem as the number of variables increase.
The dimension reduction technique is thus employed in this work.
The dimension reduction [22, 29, 33, 34] is an approximate technique for estimating the statistical moments of an output function. The technique involves an additive decomposition of an N-dimensional function involving n-dimensional integral into a series sum ofD-dimensional functions such thatD<N. It provides a means of efficiently combining the sigma points and weights for a large number of variables such that the number of evaluation points can be minimized [22, 29]. For D=1 the method is referred to as the univariate dimension reduction (UDR) while it is called bivariate dimension reduction (BDR) for D=2.
The UDR method has been utilized in stochastic mechanics [23] and probabilistic load flow studies [22, 35, 36] however, it has been less applied to harmonic analysis. The UDR method is briefly described below while a detailed mathematical derivation of the techniques can be found in [33].
1 1 1 1 1
( )
( , ,
, ,
,
) (
1) ( , ,
)
N
i i i N N
i
f
f x
x x x
x
N
f x
x
x
(4)whereμiis the mean of theithrandom variable.
The resultant function in (4) can easily be integrated since only one randomly distributed variable is present at every instance while the others are held constant at their mean values. The moments of the function are approximately the same as those of the decomposed function as represented in (5). 1 2 1 1
ˆ
[ ( )]
[ ( )]
[ ( ,
,
, ,
)]
(
1) [ ( ,
,
)]
N
i N
i
N
E f
E f
E f x x
x x
N
E f x
x
x
x
(5)
The same procedure is applied for getting the higher order moments.
The number of evaluations (EV) required for an N
-dimensional function usingnestimation (sigma points) for the UDR is given in (6) [33].
1
)
(
n
N
E
V (6)For problems where all random variables are symmetrical and
n(sigma points) is odd, the estimation points for the UDR can be further reduced to (7) while still maintaining the same level of accuracy. For clarity, this will be referred to as reduced UDR (rUDR).
1
)
)
1
((
n
N
E
V (7)This is clearly a substantial saving in computational time over the alternative ofnNevaluations.
III. UNCERTAINTYREPRESENTATION
The appropriate design and sizing of the system filter has a great impact on the amount of distortion seen at the grid side of the converter. If not designed properly, it can affect the systems stability. When an RES is integrated to the grid, one of the main concern is to reduce the harmonic current injected into the grid [24]. In designing harmonic filters for converters, the maximum ripple current should be less than 20% of the rated current [24]. This current is a function of the inductance
Lf1, the switching frequency and the DC link voltage.
However, to achieve a decrease of the ripple current, the inductance is the most flexible parameter since increasing the switching frequency affects the system efficiency. The value of the inductance can be obtained using:
1 max
1
ˆ
8
dc f sw LV
L
f
I
(8)wherefswis the switching frequency,Vdcis the dc voltage and
max
ˆ
LI
is the peak ripple of the maximum rated load currentILmax.
In deciding the filter inductance value, another solution is to choose the value relative to the total system inductance. It was
suggested in [25], [28] that the total system inductance should be about 10% of the base inductance value. Since no fixed value can be used but that which is determined at the discretion of the designer, the interfacing inductor Lf can be
viewed as a stochastic variable such that the optimal size can be determined. The value of the inductance will be in a range,
howbeit as a percentage of
I
ˆ
Lmax. The value of the inductance can thus be represented using the uniform distribution such that an optimal value can be easily predicted. Hence, (9) can be substituted into (8) to account for this variation.max
ˆ
(5
20%)
L rated
I
I
(9)andLf2is calculated as,
2 1
f f
L
L (10)where is a factor limitingLf2to be less thanLf1.
The VSC harmonic filter is designed using (8) – (14). The value for the filter capacitor (Cf) can be obtained using (10).
2
15%
3 2
rated f m ratedP
C
f
V
(11)where Cf is calculated by limiting the total reactive power
required by the capacitor to be within 15% of the total rated active power.
It is important to consider resonant frequency of an LC or LCL filter as they usually require a damping element to maintain stability and to ensure optimum operation.
The resonant frequency is usually within
10
2
sw
n res
f
f
f
For an LC, filter the resonant frequency is calculated from
1
1
res
f f
L C
(12)
For an LCL filter it is
1 2
1 2 f f res
f f f
L L
L L C
(13)
The damping resistor is calculated using
f res d
C
R
3
1
(14) -100 -50 0 50 100 M a g n it u d e (d B ) [image:3.595.306.547.428.741.2]101 102 103 104 105 106 -225 -180 -135 -90 -45 P h a s e (d e g ) Bode Diagram Frequency (rad/s)
Similarly, other uncertainties that emanate from various RES due to the dependence of their power output on several random factors such as the weather conditions have to be represented. Several models have been proposed in the literature for modeling these uncertainties; wind speed has been modeled using the Weibull distribution, Rayleigh distribution, normal distribution, etc. [37]. For simplicity, the power variation is also modeled using the uniform distribution.
Fig.1 shows the bode plot of the designed filter and highlights the effectiveness of the filter.
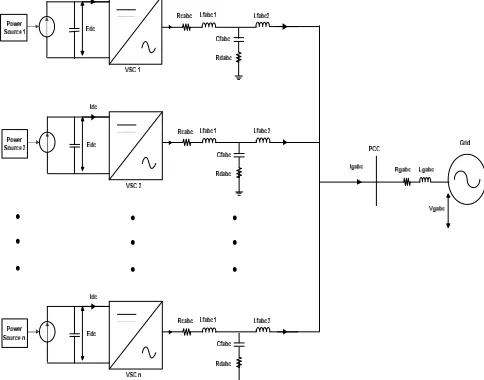
IV. EPSSTRUCTURE
The studied RES system comprises of the DC Power Source, DC capacitor, RES interfacing VSC, VSC reactors/filter, grid impedance and 3-phase grid voltage (representing further parts of the grid). Fig. 2 shows multiple number of VSCs connected in parallel and interfaced to the grid at the PCC via the grid impedance. The system was simulated using PLECSTM [38] and MATLAB SimulinkTM
[39] simulation tools.
The VSC is modeled as a 2-level VSC and the switching pattern is based on the Sinusoidal Pulse Width Modulation (SPWM) as in [2]. The VSC is controlled based on the commonly used instantaneous power theory [1] using PI controllers. The first PI controller controls the DC capacitor voltage to remain as regulated. The output of the regulated voltage gives the reference Idrefthat is required to regulate the
active current component which in turn controls the active power [1, 3]. The second current PI controller controls the reactive current component Iqref. For this study Iqref= Iq= 0 [1].
[image:4.595.47.289.478.668.2]The control scheme used in [3] was adopted for each of the VSCs.
Fig. 2. Multiple VSCs Connected to a Common Point to the Grid. V. UDR HARMONICPREDICTIONPROCESS
A summary of the main steps for implementing the UDR technique for predicting current and voltage harmonic distortion at the PCC of the EPS is highlighted below.
Step 1) Identify all randomly varying functions within the system (e.g. power, filter inductance) and obtain their probability distribution functions.
Step 2) Compute the sigma points and weights using Univariate Dimension Reduction technique.
Step 3) Input the EPS data including the sigma points and weights obtained in 2.
Step 4) Run the EPS simulation while obtaining necessary statistical data for the output variables (current/voltage THD, current/voltage IHD).
Step 5) Compute the statistical data for the output variables using the measured output data values and weights of the UDR (e.g. mean current THD).
Step 6) Display statistical data of output variables (e.g. mean current/voltage THD/IHD).
VI. SIMULATIONRESULTS
Two (2) studies are considered in predicting the level of harmonic distortion based on the variation of output power and filter inductor value. In the first study, the effect of filter inductor value Lf1on the level of harmonic distortion in the
current at the PCC using multiple VSCs is examined. For this system, Lf1 was calculated using techniques in [24] and [40]
which gives a value of 5.76mH which is typical for systems of this level. Based on this, and assuming the filter inductor value can be modeled using the uniform distribution, the value was chosen to be between 3.46mH and 8.06mH. This range was chosen assuming a ±40% trade-off between harmonic filter effectiveness and cost of filter inductor.
In the second study, the effect of output power variations on the level of harmonic distortion is considered. The output power is assumed to vary randomly within a range following the uniform distribution between 25% and 100% of its rated power. The point here is to show wide variability of the RES output power.
In the considered cases, 1000 simulations were carried out for the MCS to ensure accuracy. This is sufficient as this ensures a 95% confidence interval that the errors in the mean THD values are less than 3% as calculated using (15) and (16). The mean and standard deviation values utilized in this calculation were obtained after running the simulations and then used to check against the 95%CI.
95% CI x Z n
(15)
SE
n
(16)To show the adequacy of the chosen number of simulations used, Fig. 2 presents the results for the mean current THD for a system with 2 VSCs using 10, 100, 1000, 5000 and 10000. The simulations were carried out using a Windows 7, 32-bit operating system, i3 processor 4GB RAM PC.
Fig. 3. Result of IgaTHD for 2 VSCs Connected in Parallel for Various Numbers of Simulation.
The 3 and 5 points approximated rUDR were utilized in predicting the THD of the power converters in the EPS. The obtained results were then compared with that of the MCS. The results obtained in terms of the mean and standard deviation of the THD and the accuracy of the methods for each of the cases are discussed in the sections below.
A. Effect of Filter Variation on Current THD
The mean current and voltage THD arising from Lf
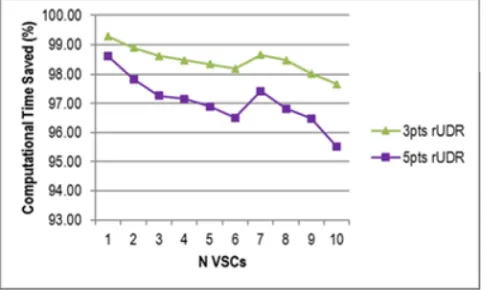
variations using 1 to 10 VSCs are presented in Fig. 5 and Fig. 6 respectively. Fig. 4 shows the amount of time saved when the rUDR methods were utilized and compared with the MCS. For 10 VSCs the amount of simulation time for the rUDR 3 points, rUDR 5 points and MCS were approximately 1100s, 2100s and 52000s respectively.
Fig. 4. Computation Time Saved by UDR 3pts and UDR 5pts.
From Fig. 5, it can be observed that the impact of the variation ofLfon the current THD progressively reduces as the
number of VSC increases. This is as expected, since the total number of filters in the system increases as the number of VSC increases, thus limiting the current distortion. Also, with increased number of VSCs, there is a higher probability of harmonic cancellation due to current diversity and attenuation
factor [24, 41, 42].
[image:5.595.303.547.173.323.2]It is observed that the rUDR methods accurately predict the current and voltage THD as the curve follows the same graph trend as that of the MCS. With 10 VSCs, there seems to be a slight underestimation with the UDR methods which could be accepted considering the amount of computation time saved in obtaining the results (Fig. 4. and 5.).
Fig. 5. Predicted IgaTHD using MCS, UDR 3pts and UDR 5pts under Filter Variation.
Fig. 6. Predicted VgaTHD using MCS, UDR 3pts and UDR 5pts under Filter Variation.
B. Effect of Power Variation on Current THD
The impact of operating power variation on the current and voltage THD seen at the PCC of the EPS was also investigated. The predicted current and voltage THD using the UDR and MCS approach are presented in Fig. 7 and Fig. 8. The impact of power variation on the current THD is more significant than the case ofLf1 variation as evident in Fig. 7.
[image:5.595.304.547.355.503.2] [image:5.595.47.290.509.654.2]Fig. 7. Predicted IgaTHD using MCS, UDR 3pts and UDR 5pts under Power Variation.
Fig. 8. Predicted VgaTHD using MCS, UDR 3pts and UDR 5pts under Power Variation.
VII. EXPERIMENTALVALIDATION OF THEUDR TECHNIQUE The aim of this experiment is to validate the efficiency of the UDR technique in predicting the harmonic distortion of VSCs in the presence of uncertainty for a small Electrical Power System (EPS).
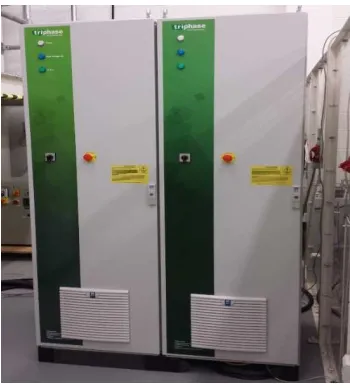
Fig. 9 shows the schematic of the laboratory setup. The experiment was conducted using 3 VSCs, a programmable power/voltage supply (Fig. 10) as the RES source, current and voltage measuring device and 3 isolating transformers.
The 3 VSCs are connected in parallel, and supplied from the mains through a 3 phase distribution line and a transformer. The VSCs are isolated by the use of 3 Transformers at the grid side of the VSC and connected to the grid side of the programmable power/voltage supply (RES Source).
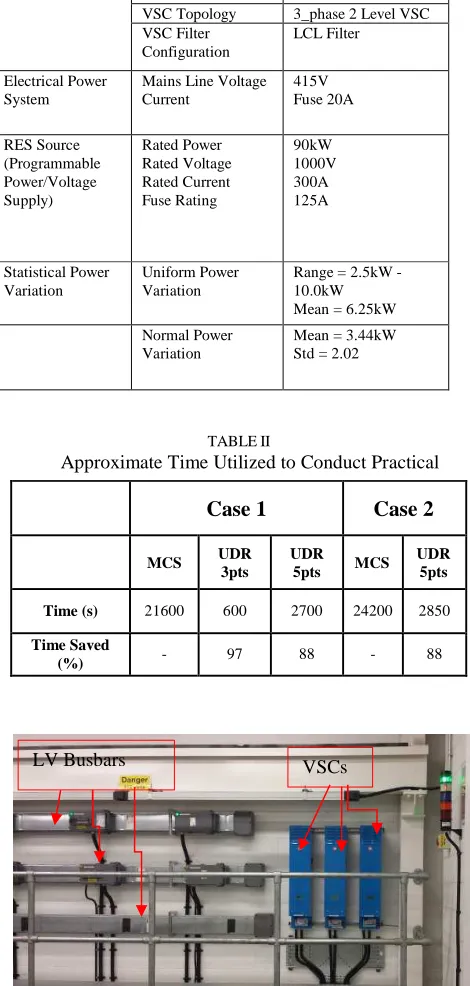
[image:6.595.307.542.170.663.2]The isolating transformers are necessary to protect the equipment and also to prevent short circuit. The main utility feed represents the grid so the VSCs are operating in the grid tied mode. The voltage and current measurements was done with Labview on a CompactRIO using NI-9227 and NI-9225 units, the current is passed through 100:5 CT’s prior to feeding it into the measuring blocks. The time taken to conduct the practical is presented below (see Table II).
TABLE I
Microgrid and VSC Laboratory Parameters VSC Parameter Rated Power,P 12.5 kW
Rated line Voltage 415V Rated Current 32A
VSC Topology 3_phase 2 Level VSC VSC Filter
Configuration
LCL Filter Electrical Power
System
Mains Line Voltage Current
415V Fuse 20A RES Source
(Programmable Power/Voltage Supply)
Rated Power Rated Voltage Rated Current Fuse Rating
90kW 1000V 300A 125A
Statistical Power Variation
Uniform Power Variation
Range = 2.5kW -10.0kW Mean = 6.25kW Normal Power
Variation
Mean = 3.44kW Std = 2.02
TABLE II
Approximate Time Utilized to Conduct Practical
Case 1
Case 2
MCS UDR 3pts
UDR 5pts MCS
UDR 5pts
Time (s) 21600 600 2700 24200 2850
Time Saved
(%) - 97 88 - 88
Fig. 9. Laboratory Set-up showing 415V LV Line and 3 VSCs.
Fig. 10. Controllable Power and Voltage Source (Triphase).
A. Case Study 1: Prediction under Uniform Power Variation
Output power variations have been earlier shown to affect THD and this study aims to predict the net harmonics of 3 VSCs in a case where the output power uniformly varies randomly and independently (range: 2.5kW – 10.0kW).
The VSCs were first varied with thousands of random power input value to imitate the MCS approach. Then the net harmonics are measured and recorded. The UDR sigma points and weights also generated. These were fed into the VSCs as power inputs and the net harmonics measured at the PCC. The results of the MCS-type approach and the UDR are then statistically analyzed and compared to measure the efficiency of the UDR technique.
TABLE III
THD Result of Random Uniform Variation in Output Power of Multiple VSCs Using MCS, 5pts UDR
ITHD(%) VTHD(%)
Mean Std Mean Std
MCS 4.46 1.44 1.93 0.52
UDR 5.07 1.67 2.06 0.60
Diff 0.61 0.23 0.13 0.08
Fig. 12. Predicted IgaTHD using MCS, UDR 5pts and UDR 3pts for Uniform Power Variation.
Fig. 13. Predicted IgaTHD using MCS, UDR 5pts and UDR 3pts 3pts for Uniform Power Variation.
From Fig. 12 and Table III it is clear that the UDR predicted results f or ITHDand VTHDhave a good match with the MCS
approach.
B. Case Study 2: Prediction under Normal Power Variation
In this case study, the output power was varied randomly following a Gaussian distribution (mean value =3.44kW and Std = 2.02e+3). Just as in case 1, the VSCs power was varied with thousands of random power inputs to mimic the MCS approach. The statistical information of the distribution is recorded and the THD measured. Then the 5pts UDR sigma points and weights were generated and inputted to evaluate the performance of the UDR technique using the MCS as a benchmark
TABLE IV
THD Result of Random Normal Variation in Output Power of Multiple VSCs Using MCS, 5pts UDR
ITHD(%) VTHD(%)
Mean Std Mean Std
MCS 4.61 1.62 1.95 0.51
UDR 4.72 1.19 2.25 0.54
[image:7.595.56.231.80.274.2]Diff 0.11 -0.43 0.30 0.03
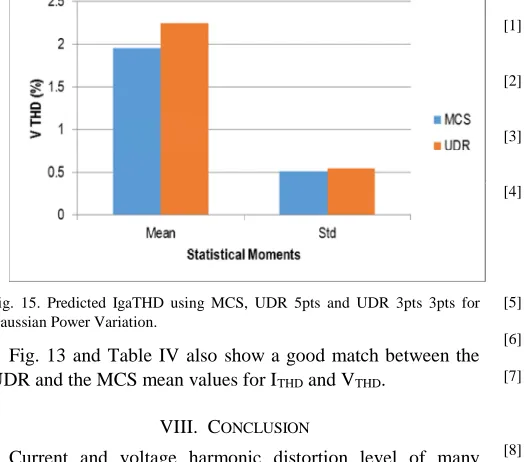
[image:7.595.49.555.461.724.2]Fig. 15. Predicted IgaTHD using MCS, UDR 5pts and UDR 3pts 3pts for Gaussian Power Variation.
Fig. 13 and Table IV also show a good match between the UDR and the MCS mean values for ITHDand VTHD.
VIII. CONCLUSION
Current and voltage harmonic distortion level of many connected converters has been successfully predicted using the 3 and 5 points approximated Univariate Dimension Reduction (UDR) technique. The effects of the variations in filter inductor value and operating power on harmonic distortion levels of VSCs at the PCC of an EPS was also presented. The EPS test system was designed using PLECS and MATLAB simulation tools.
The proposed prediction method (UDR) ensured full interactions between the harmonic sources (VSCs) and the entire EPS in predicting the THD at the PCC unlike most analytical techniques where the harmonic sources are assumed to be independent.
It was observed from the results that the 3 and 5 points reduced UDR (rUDR) technique effectively predicted the mean and standard deviation of the harmonics at the PCC of the EPS and can be used as an alternative predictive tool for the Monte Carlo Simulation approach. One very significant advantage of the rUDR highlighted in this study, is its drastic reduction of computational time and burden in predicting harmonics. The UDR technique was also experimentally validated and the results obtained were in good agreement with the MCS approach.
The study showed that the reduced UDR can be used by utility companies/design engineers in the choice of parameters since the effect of real world uncertainties possible in the operation of modern EPS are being taken into account. It also provides possible outcomes of variation of design parameter/system characteristics on the generated harmonics of an EPS containing multiple power converters. This technique can be further utilized on other power converters, non-linear loads and harmonic sources, and can also be applied to predict other harmonic indices like the individual harmonic distortions of currents and voltages.
IX. REFERENCES
[1] A. Yazdani, and R. Iravani,Voltage-Source Converters in Power Systems: Modelling, Control and Applications: John Wiley and Sons, Inc., 2010.
[2] N. Mohan, T. M. Undeland, and W. P. Robbins, Power Electronics, Converters, Applications and Design, Third ed.: John Wiley and Sons, Inc., 2003.
[3] P. M. Ivry, M. J. Rawa, D. W. P. Thomas, and M. Sumner, “Power Quality of a Voltage Source Converter in a Smart Grid,” in IEEE Powertech, Grenoble, France, 2013.
[4] Y. Baghzouz, R. F. Burch, A. Capasso, A. Cavallini, A. E. Emanuel, M. Halpin, A. Imece, A. Ludbrook, G. Montanari, K. J. Olejniczak, P. Ribeiro, S. Rios-Marcuello, L. Tang, R. Thaliam, and P. Verde, “Time-varying harmonics. I. Characterizing measured data,”Power Delivery, IEEE Transactions on,vol. 13, no. 3, pp. 938-944, 1998.
[5] M. H. Kalos, and P. A. Whitlock,Monte Carlo Methods, 2nd ed.: Wiley-VCH Verlag GmbH & Co. KGaA, Weinheim, 2008. [6] H. Junping, J. Jianguo, H. Jiangjiang, and C. Wei, "Model of EMI
coupling paths for an off-line power converter." pp. 708-713 vol.2. [7] M. Ferber, C. Vollaire, L. Krahenbuhl, J. L. Coulomb, and J. A. Vasconcelos, “Conducted EMI of DC-DC Converters With Parametric Uncertainties,” Electromagnetic Compatibility, IEEE Transactions on,vol. 55, no. 4, pp. 699-706, 2013.
[8] S. R. Kaprielian, A. E. Emanuel, R. V. Dwyer, and H. Mehta, “Predicting voltage distortion in a system with multiple random harmonic sources,”Power Delivery, IEEE Transactions on,vol. 9, no. 3, pp. 1632-1638, 1994.
[9] P. T. Staats, W. M. Grady, A. Arapostathis, and R. S. Thallam, “A statistical method for predicting the net harmonic currents generated by a concentration of electric vehicle battery chargers,”
Power Delivery, IEEE Transactions on,vol. 12, no. 3, pp. 1258-1266, 1997.
[10] K.-H. Liu, “Analysis of Probabilistic Harmonic Currents and Voltages of Electronic Power Converter Contributed in Distributed Systems,”Research Journal of Applied Sciences, Engineering and Technology,vol. 5, no. 4, pp. 1263-1270, 2013.
[11] Jen-Hao Teng, Rong-Ceng Leou, Chuo-Yean Chang, and S.-Y. Chan, "Harmonic Current Predictors for Wind Turbines,"
Energies,6, 2013].
[12] Y. G. Hegazy, and M. M. A. Salama, "Calculations of diversified harmonic currents in multiple converter systems." pp. 727-731 vol. 2.
[13] Y. J. Wang, L. Pierrat, and L. Wang, “Summation of harmonic currents produced by AC/DC static power converters with randomly fluctuating loads,”Power Delivery, IEEE Transactions on,vol. 9, no. 2, pp. 1129-1135, 1994.
[14] E. Ngandui, E. J. Mohammed, and A. Cheriti, "Prediction of harmonics produced by multiple variable speed drives with randomly fluctuating loads." pp. 1157-1161 vol.2.
[15] H. V. Haghi, and M. T. Bina, "A study on probabilistic evaluation of harmonic levels produced by static compensators." pp. 1-6. [16] D. G. Infield, P. Onions, A. D. Simmons, and G. A. Smith, “Power
quality from multiple grid-connected single-phase inverters,”
Power Delivery, IEEE Transactions on,vol. 19, no. 4, pp. 1983-1989, 2004.
[17] MathWorks. "Monte Carlo Simulation," 09 March, 2015;
http://uk.mathworks.com/discovery/monte-carlo-simulation.html. [18] P. Jorgensen, J. S. Christensen, and J. O. Tande, "Probabilistic
load flow calculation using Monte Carlo techniques for distribution network with wind turbines." pp. 1146-1151 vol.2. [19] D. W. P. Thomas, O. A. Oke, L. R. A. X. De Menezes, and C.
Christopoulos, "The use of unscented transforms in modeling the statistical response of nonlinear scatterer in a reverberation chamber." pp. 1-4.
[20] L. R. A. X. De Menezes, D. W. P. Thomas, C. Christopoulos, A. Ajayi, and P. Sewell, "The use of Unscented Transforms for statistical analysis in EMC." pp. 1-5.
[22] O. A. Oke, “Enhanced Unscented Transform Method for Probabilistic Load Flow Studies,” Electrical and Electronics Engineering, University of Nottingham, Nottingham, 2013. [23] S. Rahman, and H. Xu, “A univariate dimension-reduction method
for multi-dimensional integration in stochastic mechanics,”
Probabilistic Engineering Mechanics,vol. 19, no. 4, pp. 393-408, 2004.
[24] K. H. Ahmed, S. J. Finney, and B. W. Williams, "Passive Filter Design for Three-Phase Inverter Interfacing in Distributed Generation." pp. 1-9.
[25] M. Liserre , F. Blaabjerg, and A. Dell’Aquila, “Step-by-step design procedure for a grid-connected three-phase PWM voltage source converter,”International Journal of Electronics,vol. 91, no. 8, pp. 445-460, 2004/08/01, 2004.
[26] A. A. Rockhill, M. Liserre, R. Teodorescu, and P. Rodriguez, “Grid-Filter Design for a Multimegawatt Medium-Voltage Voltage-Source Inverter,” IEEE Transaction on Industrial Electronics,vol. 58, no. 4, pp. 1205-1217, 2011.
[27] R. Teodorescu, M. Liserre, and P. Rodriguez,Grid Converters for Photovoltaic and Wind Power Systems: John Wiley and Sons Ltd., 2011.
[28] I. Sefa, N. Altin, and S. Ozdemir, "An implementation of grid interactive inverter with reactive power support capability for renewable energy sources." pp. 1-6.
[29] P. M. Ivry, “Predicting Stochastic Harmonics of Multiple Converters in a Power System (Microgrid),” Electrical and Electronic Engineering, University of Nottingham, Nottingham, 2016.
[30] D. W. P. Thomas, O. A. Oke, and C. Smartt, "Statistical analysis in EMC using dimension reduction methods." pp. 316-321. [31] O. A. Oke, D. W. P. Thomas, and G. M. Asher, "A new
probabilistic load flow method for systems with wind penetration." pp. 1-6.
[32] Gautschi W., Orthogonal Polynomials: Computation and Approximation, New York: Oxford University Press, 2004. [33] H. Xu, and S. Rahman, “A generalized dimension-reduction
method for multidimensional integration in stochastic mechanics,”
International Journal for Numerical Methods in Engineering,vol. 61, no. 12, pp. 1992-2019, 2004.
[34] I. Lee, K. K. Choi, L. Du, and D. Gorsich, “Dimension reduction method for reliability-based robust design optimization,”
Computers & Structures,vol. 86, no. 13–14, pp. 1550-1562, 2008. [35] B. Zou, and Q. Xiao, “Probabilistic load flow computation using univariate dimension reduction method,” International Transactions on Electrical Energy Systems, pp. n/a-n/a, 2013. [36] F. J. Ruiz-Rodriguez, J. C. Hernández, and F. Jurado,
“Probabilistic load flow for photovoltaic distributed generation using the Cornish–Fisher expansion,” Electric Power Systems Research,vol. 89, no. 0, pp. 129-138, 2012.
[37] H. Bayem, M. Peti, P. Dessante, F. Dufourd, and R. Belhomme, "Probabilistic Characterization of Wind Farms for Grid Connection Studies."
[38] "PLECS 3.5.1," Plexim GmbH, Zurich, 2014.
[39] "MATLAB 8.1.0.604 (R2013a)," MathWorks, Inc., 2013. [40] P. M. Ivry, M. J. Rawa, and D. W. P. Thomas, "Factors Affecting
the Harmonics Generated by a Generic Voltage Source Converter Within a Microgrid." pp. B-65.
[41] E. E. Ahmed, and W. Xu, “Assessment of harmonic distortion level considering the interaction between distributed three-phase harmonic sources and power grid,”Generation, Transmission & Distribution, IET,vol. 1, no. 3, pp. 506-515, 2007.
[42] A. Mansoor, W. M. Grady, A. H. Chowdhury, and M. J. Samotyi, “An investigation of harmonics attenuation and diversity among distributed single-phase power electronic loads,”Power Delivery, IEEE Transactions on,vol. 10, no. 1, pp. 467-473, 1995.
X. BIOGRAPHIES
Preye Milton Ivry (M’12) received the B.Eng. degree in electrical and electronics engineering from the Niger Delta University, Nigeria in 2006. In 2010, he received his M.Sc. degree in electrical engineering and the Ph.D. degree in electrical and electronic engineering both from the University of Nottingham, U.K.
In 2008 he joined the Department of Electrical and Electronics Engineering, Niger Delta University, Nigeria as a Graduate Assistant. His research interests include power system analysis, power system design, power system harmonics, power quality, power system converters and control, integration of renewable energy systems to the grid.
Oluwabukola Oke (M’10) received her B.Eng. degree in Electrical and Electronic Engineering from the University of Ado-Ekiti, Nigeria in 2007. She completed a master degree in Electrical Technology for Sustainable and Renewable Energy Systems, in 2009 and a Ph.D. degree in Electrical Engineering in 2013 both at the University of Nottingham, UK. Her research in Nottingham focused on applying probabilistic methods in accounting for the uncertainties from renewable energy systems within the power system.
Her research interest includes integration of renewable energy systems into power grid, probabilistic modelling and analysis, power system planning, and power quality.
David W. P. Thomas(M’94–SM’09) received the B.Sc. degree in physics from Imperial College of Science and Technology, London, U.K., the M.Phil. degree in space physics from Sheffield University, Sheffield, U.K., and the Ph.D. degree in electrical engineering from Nottingham University, Nottingham, U.K., in 1981, 1987, and 1990, respectively.
In 1990, he joined the Department of Electrical and Electronic Engineering, University of Nottingham, Nottingham, as a Lecturer, where he is currently a Professor of Electromagnetic Applications. His research interests include power system transients, power system protection, electromagnetic compatibility, and electromagnetic simulation.
Dr. Thomas is a member of CIGRE and a Convenor for CIGRE JWG 4.207. He is also vice-chair for IEEE EMC Technical committee 7 “Low frequency EMC”.
Mark Sumner(SM’05) received the B.Eng. degree in electrical and electronics engineering from Leeds University, Leeds, U.K., in 1986 and the PHD. Degree in induction motor drives from Nottingham University, Nottingham, U.K., in 1990.