pressure loss in aero-engine
air-oil separators
A. Laura Cordes laura.cordes@kit.edu
B. Tim Pychynski, C. Corina Schwitzke and D. Hans-Jörg Bauer Karlsruhe Institut für Technologie (KIT)
Institut für Thermische Strömungsmaschinen (ITS) Karlsruhe
Germany
A. Thiago P. de Carvalho and B. Hervé P. Morvan Gas Turbine & Transmission Research Centre Nottingham
United Kingdom
ABSTRACT
The results of extensive experimental testing of an aero-engine air-oil separator are presented and discussed. The study focuses on the pressure loss of the system. Oil enters the device in the form of dispersed droplets. Subsequently, separation occurs by centrifuging larger droplets towards the outer walls and by film formation at the inner surface of a rotating porous material, namely an open-cell metal foam. The work described here is part of a study led jointly by the Karlsruhe Institute of Technology (KIT) and the University of Nottingham (UNott) within a recent EU project.
The goal of the research is to increase the separation efficiency to mitigate oil consumption and emissions, while keeping the pressure loss as low as possible. The aim is to determine the influencing factors on pressure loss and separation efficiency. With this knowledge, a correlation can eventually be derived. Experiments were conducted for three different separator configurations, one without a metal foam and two with metal foams of different pore sizes. For each configuration, a variety of engine-like conditions of air mass flow rate, rotational speed and droplet size was investigated. The experimental results were used to validate and improve the numerical modelling.
Results for the pressure drop and its dependencies on air mass flow rate and the rotational speed were analysed. It is shown that the swirling flow and the dissipation of angular momentum are the most important contributors to the pressure drop, besides the losses due to friction and dissipation caused by the flow passing the metal foam. It was found that the ratio of the rotor speed and the tangential velocity of the fluid is an important parameter to describe the influence of rotation on the pressure loss. Contrary to expectations, the pressure loss is not necessarily increased with a metal foam installed.
Received 7 April 2017; revised 10 February 2017; accepted 22 March 2017.
https://www.cambridge.org/core
. University of Nottingham
, on
07 Aug 2017 at 12:42:44
, subject to the Cambridge Core terms of use, available at
Keywords:Experimental; oil separation; pressure loss; jet engines; breather
NOMENCLATURE
As area of streamtube cross section
C constant for vortex equation ˙
mair air mass flow rate
n exponent for vortex equation
pin inlet pressure
pout outlet pressure
v velocity
V volume
r radius/radial direction of cylindrical co-ordinate system
z axial direction of cylindrical co-ordinate system
Greek Symbols
ν kinematic viscosity
ϕ tangential direction of cylindrical co-ordinate system
ρ density
ζ loss coefficient
Indices
co metal foam of coarser grade
f flow
f i metal foam of finer grade
min minimal value:m˙air=20 g/s crit critical value
0 initial/inlet value
1; 2; 3 values at the position indicated
I; II vortex I (rr0 >0.4); Vortex II (rr 0 <0.4)
1.0 INTRODUCTION
Aero-engine bearings require a steady supply of oil for lubrication and cooling. Ideally, all of the oil running through the bearings is recycled to minimise the total weight of the oil carried on board. At the same time, the oil is not allowed to enter the engine air system, as it might contribute to pollution of the environment and cabin air. Oil leakage from the bearing chamber into the secondary air system is mainly prevented by applying sealing air to the bearing chamber seals. Oil leaving the bearing, and sealing air entering the chamber, mix and generate a complex two-phase flow consisting of oil film formation and droplets of a large range of different diameters, down to one micrometre and below. The two-phase flow in the bearing chamber and the related heat transfer have been studied by various authors(1-6). Oil and air are scavenged through the scavenge port and vent port, respectively. The rotational speed of the shaft and bearing influence the share of oil leaving with the air(4). The polluted
https://www.cambridge.org/core
. University of Nottingham
, on
07 Aug 2017 at 12:42:44
, subject to the Cambridge Core terms of use, available at
https://www.cambridge.org/core/terms
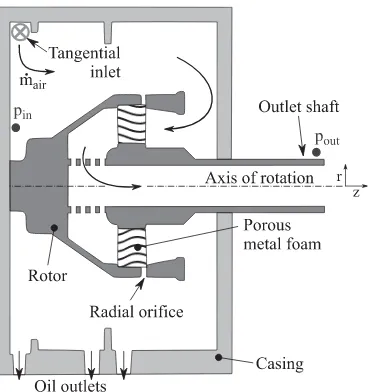
Figure 1. Schematic of a separator. Static and rotating parts indicated in light and dark grey, respectively.
air exiting the bearing chamber through the vent cannot simply be exhausted overboard. This would cause high oil consumption, pollution of the environment and increasing maintenance costs. Therefore, a means to separate the oil from the air is necessary.
Commonly called a breather, the separator consists of a static casing and a rotor, in which a porous medium is installed. A typical breather design, which has been investigated for the present study, is shown inFig. 1. The air-oil mixture enters the casing tangentially and passes through the rotor and the porous medium. The larger droplets are centrifuged due to the swirl flow in the casing and the smaller droplets are separated by wall adhesion and centrifugal forces in the porous medium. The separated oil is collected in the casing and returned to the oil system. The cleaned air leaves the rotor and is exhausted.
For the breather design, different possibilities have been suggested and studied. Most work is focused on the separation of oil. Gruselle et al(7) investigated a separator where the air-oil mixture is circumferentially accelerated through rotating blades. Results showed that the separation quality depends on the backpressure of the oil outlet, depending on whether the separated oil film was scavenged too fast or too slow. In a further study by Steimes et al(8), an improved prototype was investigated with a metallic foam installed, which lead to an increase in oil separation efficiency. They reported that increasing the oil flow rate leads to a higher absolute oil consumption. They state in a later study(9) that this is likely due to the overall increasing number of droplets, which also implies more small droplets. In the same study, pressure drop across the metallic foam was measured. They showed that the pressure drop increases with the air mass flow rate and depends strongly on the geometry and size of the metallic foam.
Feng et al(10)investigated a centrifugal separator. They found that the separation efficiency improved when more oil was injected but explained it with the presence of more droplets of a larger diameter.
Sheridan et al(11)proposed a breather design where a positive pressure difference is created by radially accelerating the flow like an impeller. While the pressure drop results are very promising, it slightly decreases the oil separation efficiency.
https://www.cambridge.org/core
. University of Nottingham
, on
07 Aug 2017 at 12:42:44
, subject to the Cambridge Core terms of use, available at
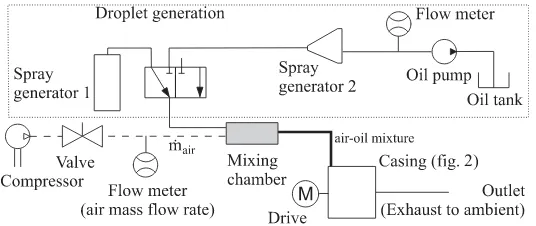
Figure 2. Schematic of the rig set-up.
A configuration similar to the one used in the present study was investigated by Willenborg et al(12). They found that reducing the air mass flow leads to a decrease of separation efficiency while increasing rotational speed causes it to rise. It was observed that the effect of the breather speed on the pressure drop is stronger than that of the air mass flow rate.
Ideally, the breather exhibits separation efficiencies of 100% with no pressure loss. While high separation efficiencies of up to 99.8% have been reported(10,13), the oil, which is not separated, consists mainly of droplets of a diameter of 3–4μm and below(12).
This research is aimed at deriving design guidelines for reduced pressure loss and improved separation efficiencies. Investigations found in the literature have mostly been dealing with the separation efficiencies, although some improvements regarding the pressure loss have been made(11). The objective of this paper is to investigate and to analyse the main contributors to the pressure drop. This knowledge is crucial for further improvements. Numerical results are used to support and explain the experimental findings. The numerical set-up and results were presented by de Carvalho et al(14).
First, the experimental set-up is described, followed by a detailed discussion of the pressure loss.
2.0 EXPERIMENTAL SET-UP
The rotating test rig consists of an overhung rotor, which is driven by an electric motor up to 7,000 rpm. The rotational speed is measured by means of a reflected-light barrier and an electronic tachometer with an accuracy of 0.01% of the actual value. The casing size enables testing of different rotor designs. However, this study only presents results for the rotor geometry indicated inFig. 1.
The rig set-up with its air and oil supply is shown inFig. 2. The test rig is supplied with compressed air up to 10 bar at mass flow rates between 10 and 100 g/s, which is of the same magnitude as the air mass flow rate leaving the bearing chamber(15). The air mass flow is measured with a hot film probe, which has an accuracy of m˙m˙ ≤ ±3% over the whole range. Inlet pressure and mass flow rate are controlled using valves, while outlet pressure is close to ambient at all times. The air reaches the mixing chamber at approximately ambient temperature.
Two spray generators are used to represent the smaller droplet spectrum of the air-oil-mixtures leaving the bearing chamber. The droplet sizes are smaller than 10μm, which has been determined by means of the laser diffraction method. The entering oil mass flow rate can reach values up to 1.8 l/h, depending on the air mass flow rate. This is due to the design of the
https://www.cambridge.org/core
. University of Nottingham
, on
07 Aug 2017 at 12:42:44
, subject to the Cambridge Core terms of use, available at
https://www.cambridge.org/core/terms
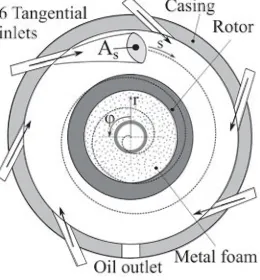
Figure 3. Front view of the separator with an arbitrary projected streamline. Tangential inlets and rotor shown.
chamber where air and oil mix. At low air mass flow rates, up to 50% of the oil settles there. Oil droplets already separate in the mixing chamber due to gravity and adhesion. This amount is measured and taken into account for the oil mass flow rate.
After the mixing chamber, the air-oil-mixture enters the casing through six tangential inlets with a diameter of 13 mm each, as indicated inFigs 2and3. This inlet configuration creates the tangential velocity componentvt,0, which depends on the air mass flow rate. The resulting
pre-swirl is supposed to facilitate the separation of large oil droplets through centrifugal effects, as is the case in a cyclone.
Between the casing inlet and exit, the flow has to undergo several 90◦ and 180◦ turns in ther-z-plain (seeFig. 1). The flow enters the outlet shaft through several large holes, which cover two thirds of the shaft circumference. In addition to the flow turns, a porous medium can be placed in the rotor, covering the complete flow path of the air-oil mixture as indicated inFig. 1. This porous medium is supposed to catch passing oil droplets by wall adhesion and divert them radially outwards to the inner rotor wall, thus improving separation efficiency. In order to prevent separated oil being retained at the outer radius of the porous medium, 16 radial orifices are manufactured into the rotor wall (seeFig. 1). Centrifugal forces cause ejection of the collected oil through these radial orifices. The metal foam is an additional obstacle for the flow. It is therefore expected that it causes the overall pressure loss to rise.
In this study, a metal foam was used as a porous medium and is often referred to as Retimet®. Two Retimet®designs with different grades of porosity VPores
Vtotal were used. Overall, pressure losses for three different configurations have been studied:
1. Baseline without a metal foam,
2. With a coarse metal foam of higher porosity and 3. With a fine metal foam of lower porosity.
For each of these three cases, a full factorial test matrix was used varying the air mass flow rate m˙air and the rotor speed ω. The boundary conditions used are summarised in Table 1. The baseline case reveals the breather’s pressure loss and separation efficiency only due to inertia and centrifugal effects. It is expected that the pressure loss and the separation
https://www.cambridge.org/core
. University of Nottingham
, on
07 Aug 2017 at 12:42:44
, subject to the Cambridge Core terms of use, available at
Table 1
Investigated boundary conditions. A full factorial test matrix was applied
˙
mair[g/s] 10 20 40 60 80 100
ω[rpm] 0∗ 2,000 4,000 6,000
∗could not be reached atm˙air=100 g/s.
efficiency rise with decreasing porosity of the metal foam. Then, an optimum between those two characteristics needs to be found.
One differential pressure transducer with an accuracy of 0.04% full scale output, which corresponds to±40 Pa, was used to quantify the difference between the static inlet pressure
pin at the back plate of the casing and static outlet pressure pout in a pipe that encloses the
rotating shaft at the breather exit, as indicated inFig. 1. This value is equivalent to the pressure loss due to the loss mechanisms, as will be discussed in the next section. Hence, the pressure loss is defined as:
p=pin−pout. … (1)
In order to account for transient effects, the differential pressure is sampled 500 times at a rate of 1 kHz and averaged. The pressure drop measurements were performed once without and once with oil droplets in the system. The difference was within measurement accuracy. Additionally, two absolute pressure sensors were used to measurepinandpoutindependently.
Due to their inferior accuracy only the data from the differential pressure transducer was used for the following analysis. The pressure loss was investigated for all three configurations with varying rotational speeds and air mass flow rates.
The data for mass flow rate and pressures are acquired with a peripheral component interconnect device by National Instruments with a 12-bit analog-to-digital conversion.
3.0 PRESSURE LOSS
The pressure loss between inlet and outlet is an important breather characteristic, as it affects the pressure and mass flow distribution in the secondary air system and also contributes to overall engine efficiency. The total pressure loss is the result of different contributors:
t Shear forces and thus friction on the wall and within the fluid, t Pressure loss across the metal foam,
t Pressure loss due to centrifugal effects,
t Work/momentum transferred between the rotor and fluid.
Understanding the significance of the various effects and how they depend on the breather configuration, mass flow rate and rotational rotor speed is important for the improvement of future shaft breather designs with respect to the overall pressure loss. This section deals with the characterisation and analysis of the resulting total pressure loss of the shaft breather design studied experimentally. First, the experimental results are presented and discussed. Second, the observed pressure loss behavior will be analysed and described phenomenologically using simple analytical modelling and Computational Fluid Dynamics (CFD) results obtained
https://www.cambridge.org/core
. University of Nottingham
, on
07 Aug 2017 at 12:42:44
, subject to the Cambridge Core terms of use, available at
https://www.cambridge.org/core/terms
ω
Δ
ω
[image:7.482.114.377.58.251.2]1,000 2,000 3,000 4,000 5,000 6,000
Figure 4. Experimental results for pressure losspfor 20 g/s◦, 60 g/sand 100 g/sair mass flow. Points connected for visualisation. Critical rotational speeds where losses with a metal foam exceed
those with a foam are indicated.
by Carvalho et al(14). This approach allows both identification and quantification of the dominating effects.
The measured pressure losses across the separator are plotted in Fig. 6 for all three configurations as a function of rotational rotor speed and air mass flow rate. Only selected results are shown in Fig. 6to facilitate visualisation. For both configurations with a metal foam (coarse and fine), it was not possible to reach zero rotor rotation for high air mass flow rates because the rotor was set into motion by the swirling flow.Figure 6demonstrates that the pressure drop increases linearly with rotational rotor speed for all three configurations. The slope of the pressure drop increases with increasing mass flow rate. This effect is particularly pronounced for the configurations with a metal foam installed. As expected, the pressure loss is always larger for the configuration with a finer foam than for the coarse foam configuration at the same operating conditions. This difference increases for higher mass flow rates. Surprisingly, however, up to a certain critical rotational speedωcrit, the pressure loss for the configurations with a metal foam is lower than for the baseline configuration without a metal foam installed. This tendency is reversed for higher rotational speeds. It is interesting to note that this critical rotational speed seems to increase with increasing mass flow rate. Using this effect for application in a breather means that the installation of a metal foam is highly beneficial in terms of pressure loss if the rotational speed stays below the critical speed.
The following analysis is separated into two sections. The first section deals with the analytic description of the pressure loss for the case of zero rotor rotation. This case will allow the explanation and quantification of:
t The lower total pressure losses observed for the configurations with metal foam at low rotational speeds,
t The increasing effect of the mass flow rate on pressure loss.
https://www.cambridge.org/core
. University of Nottingham
, on
07 Aug 2017 at 12:42:44
, subject to the Cambridge Core terms of use, available at
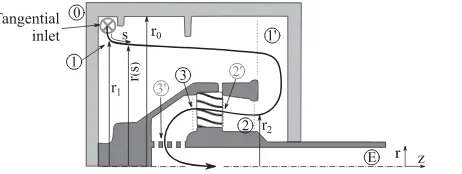
Figure 5. Projected arbitrary streamline through the separator with evaluated positions indicated. Two radiir1andr2sketched exemplarily.
In the second section, the effect of rotational speed will be explained phenomenologically based on the CFD results and on the analytical model derived in the first section.
3.1 Non-rotating case
First, the equations used to describe the flow are introduced. Using those with the geometry information, an analytical description of the tangential velocityvϕ = f(r)is derived. Using these results along with numerical data, a detailed discussion of the phenomena occurring in the system is performed. Then, the effects of a metal foam installed in the rotor are discussed and described analytically.
A projected typical flow path through the breather is indicated inFig. 5. In reality, the flow follows a helical path, even in the case without rotor rotation, as the flow enters through tangential inlets (comp.Fig. 3). As the swirling fluid is deflected towards a smaller radius, the tangential velocityvϕincreases according to the conservation of specific angular momentum
h:
h=Asvϕr=const. … (2)
As corresponds to the cross section of the stream tube perpendicular to the tangential
velocity as defined inFig. 3. The tangential velocity can be expressed by a vortex equation
vϕ(r)= Crn, … (3)
which is typical for the flow in a cyclone(16). The corresponding change in static pressure between two different radiir1 andr2 can be determined using the momentum equation in
radial direction. Under the assumption that the radial velocity is negligible, it remains only the pressure change due to centrifugal effects:
pv=
r2
r1
ρ(vϕ(r))2
r dr=
r2
r1
ρ C2
r2n+1dr … (4)
The evolution of the streamtube cross sectionAsalong a radiusrcan be estimated based on the
inlet conditions, test rig geometry and CFD results. For this purpose, an arbitrary streamline was investigated, and the streamtube cross sectionAs and the radius rwere determined at
several representative points, as indicated inFig. 5. With Equation (2), the tangential velocity vϕis then calculated. It becomes clear that two vortices exist, separated by a velocity decrease
due to an increase of streamtube cross sectionAs between points 1 and 1ʹ. Knowing the
https://www.cambridge.org/core
. University of Nottingham
, on
07 Aug 2017 at 12:42:44
, subject to the Cambridge Core terms of use, available at
https://www.cambridge.org/core/terms
Point 0 1 1 2 3 3
Vortex I II
r r0 45r0 34r0 31r0 13r∗0 18r∗0
vϕ vϕ0 54vϕ0 54vϕ0 vϕ0 vϕ∗0
8 5v∗ϕ0
C vϕ0r0 0.65vϕ0r00.5
n 1 0.5
∗: without foam, with foam:vϕ=0.
1,400.0
1,275.0
1,025.0
1,150.0
1,175 1,175
1,275 1,175
1,175
1,025
1,025 1,275
Figure 6. Static pressure contour plot for configurations without and with a fine metal foam without rotation at 20 g/s air mass flow rate(14). Both outlet shafts have been shortened.
tangential velocity profile, C and n from Equation (3) can be identified. The corresponding values of the radius, tangential velocity and of the resulting coefficients C and n for the non-rotating test cases are summarised inTable 2. They were determined assuming incompressible flow conditions, as Ma<0.3 according to the CFD results obtained by de Carvalho et al(14). Using the respective inlet velocityvϕ0 as a reference, the values forCandnonly depend on
the respective inlet conditions.
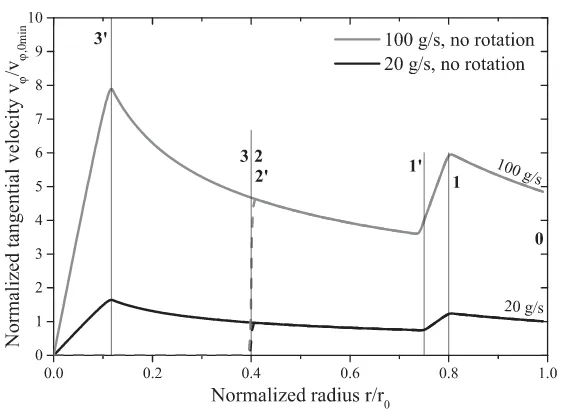
The static pressure contour plots for zero rotational speed obtained by CFD for both a configuration with and without metal foam insert are shown inFig. 6for an air mass flow rate of 20 g/s. With Equations (2) and (3), andTable 2, the radial development of the tangential velocityvϕ is plotted inFig. 7(flow direction from right to left). The tangential velocity is normalised with the tangential inlet velocity at 20 g/s of air mass flow ratevϕ,0min.
https://www.cambridge.org/core
. University of Nottingham
, on
07 Aug 2017 at 12:42:44
, subject to the Cambridge Core terms of use, available at
[image:9.482.67.428.97.468.2]ϕ
[image:10.482.96.386.57.262.2]ϕ,0
Figure 7. Normalised tangential velocityvϕ/vϕ,0minversus the radius r/r0with (dashed lines) and without
the metal foam (solid line) without rotation.
For the following discussion, the flow path is divided into several successive sections as indicated inFig. 5. For the sections between the points 0 and 1, and 1and 2, the effect of the decreasing radius dominates and the tangential velocity increases. Even though the radius decreases also slightly between points 1 and 1, the jet widens, causing the tangential velocity to decrease. If no metal foam is installed, the fluid passes undisturbed through the rotor between points 2 and 3 (along a constant radius). Since the flow is deflected towards a smaller radius between points 3 and 3, it is once again accelerated. When the flow is deflected to an even smaller radius downstream of point 3, kinetic energy is dissipated and the tangential flow velocity eventually drops to zero. This is in accordance to the behavior of a Rankine vortex.
For the configurations with metal foam, the tangential flow velocity of the porous medium is imposed onto the fluid. Therefore, the tangential velocity is zero downstream of the metal foam (rr
0 <0.4 inFig. 7) for the non-rotating case. While the porous medium causes a pressure loss, caused by the axial flow velocity, no further pressure changes occur after the metal foam. This explains why the measured pressure losses for the configurations with metal foam insert are lower than without a foam for zero and low rotational speeds (compare toFig. 4).
Overall,Fig. 6shows that the static pressure decreases mainly in the radial direction and across the metal foam. This implies that only the centrifugal effects (comp. Equation (4)) and the losses caused by the metal foam dominate the pressure losses. Therefore, the total pressure loss across the shaft breather is approximated using the following equation:
p=ρ
r1
r0
(vϕ,I(r))2
r dr+ρ
r2
r1
(vϕ,II(r))2
r dr
(a)
+ρv2z
2 ζf
(b)
+ρ
r3
r3
(vϕ,II(r))2
r dr
(c)
.
… (5)
https://www.cambridge.org/core
. University of Nottingham
, on
07 Aug 2017 at 12:42:44
, subject to the Cambridge Core terms of use, available at
https://www.cambridge.org/core/terms
Δ
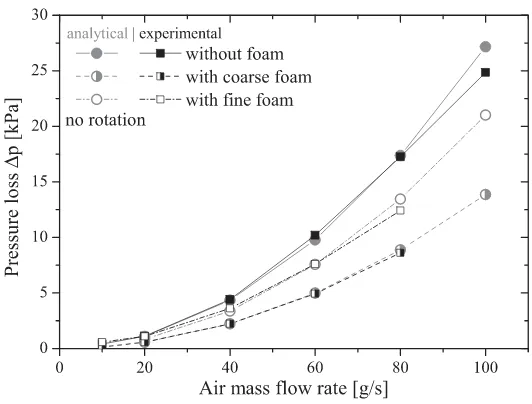
Figure 8. Comparison of the calculated pressure difference (Equation (5)) with the experimental results without rotation. Points connected for visualisation. Deviation between analytical
and experimental results less than 10%
The first two terms (a) in Equation (5) give the pressure loss due to centrifugal effects upstream of the metal foam. These terms are identical for all three configurations as discussed previously. The third term (b) represents the pressure loss due to the metal foam wherevz
corresponds to the axial flow velocity and ζf is a loss coefficient, which results from the
assumption that the pressure loss depends linearly on the dynamic pressure similar to the losses in a pipe. The loss coefficient is zero for the configuration without foam. The fourth term (c) describes the losses due to centrifugal effects downstream of the foam at point 3. They are zero for the configurations with metal foam (with coarse foam and with fine foam) in the non-rotating case. In case without a foam,vϕ,II(r)=vϕ,II(r). Equation (5) applies to
the rotating case as well, as will be discussed in the next section.
Using the results from the previous discussion of term (a), setting term (c) equal to zero and with the experimental results, the loss coefficients yield toζf,f i=372 for the fine metal foam,
andζf,co=131 for the coarse metal foam. The resulting overall pressure losses calculated
from Equation (5) for the case of zero rotational speed are compared to the experimental data inFig. 8. The calculated pressure losses show excellent agreement with deviations less than 10% from the experimental results. This proves that centrifugal effects and pressure loss across the porous medium are indeed the dominating contributing effects.
With the previous analysis, the effects in a non-rotating breather can be summarised: The larger the air mass flow rate, the higher the tangential flow velocities, resulting in much larger pressure drops due to centrifugal effects (see Fig. 7and Equation (5)). Also, the larger the mass flow rate and hence the axial flow velocityvzthrough the porous medium, the higher the
resulting pressure loss across the metal foam (see term (b) in Equation (5)).
3.2 Rotating case
For a rotating rotor and metal foam, similar effects as discussed previously are observed. In addition, work or momentum will be transferred between rotating parts and fluid. If the
https://www.cambridge.org/core
. University of Nottingham
, on
07 Aug 2017 at 12:42:44
, subject to the Cambridge Core terms of use, available at
ϕ
ϕ,
0
4,000 rpm
6,000 rpm
6,000 rpm
4,000 rpm
[image:12.482.104.398.57.261.2]5,000 rpm
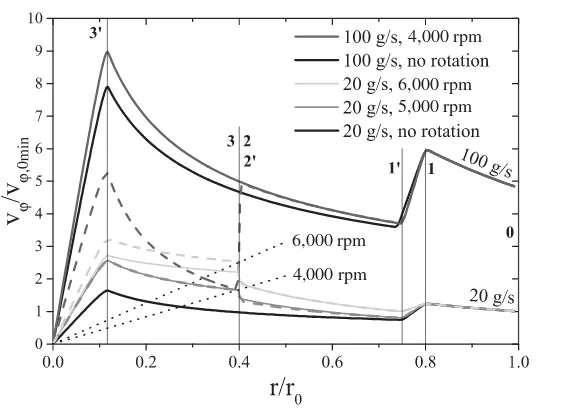
Figure 9. Tangential velocity normalised with the tangential velocity of ˙mair=20 g/s at the inletvϕ/vϕ,0min
versus the radiusr/r0with (dashed line) and without the metal foam (solid line),
and solid body rotation (dotted line).
tangential rotor wall velocity exceeds the tangential flow velocity, the fluid is accelerated and vice versa. The development of the tangential flow velocity along the flow path for different rotational speeds is shown in Fig. 9. The profiles were extracted from the CFD calculations provided by de Carvalho et al(14). The tangential rotor velocities are plotted as a function of the normalised radius for rotational speeds of 4,000 rpm and 6,000 rpm (dotted lines). The profiles of the tangential velocity without rotation are also shown as reference.
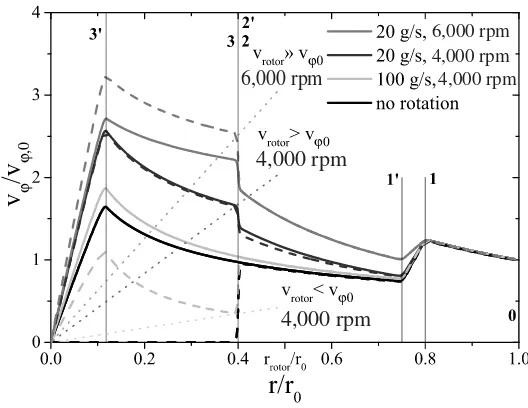
InFig. 10, the tangential velocityvϕ of rotor and fluid is normalised with its respective tangential inlet velocityvϕ0. Without rotation, the normalised curves coincide, as the velocity
profile only depends on the inlet velocity.
Figures 9and10support the explanation of the trends observed for the measured pressure losses inFig. 4. Considering Equation (5), it is clear that the area under the curves inFig. 9
can be interpreted as a measure of the vortex loss. The smaller the radius, the larger is the contribution to the overall pressure loss.
Upstream of point 2 (rr
0 >0.4), the rotor rotation leads to slightly higher tangential flow velocities than without rotation, as drag on the flow is reduced compared to the case of zero rotational speed inFig. 7. It is more pronounced for increasing ratios ofvrotor
vϕ0 (compareFig. 10) since the flow will eventually be accelerated. The resulting static pressure drop upstream of the foam increases with the rotational speed (see term (a) in Equation (5)).
If the rotor speed between points 2 and 3 is higher than the tangential velocity of the fluid at that location, an increase in tangential fluid velocity occurs. This is due to the acceleration in tangential direction caused by momentum exchange between the fluid and the rotor. When the rotor is slower than the fluid, this acceleration does not take place. In either case, if a foam is installed, it imposes its own tangential velocity onto the flow.
After point 3, the flow is once again deflected radially inwards towards point 3. If the rotor rotates and, thus, the flow has a tangential velocity, the tangential velocity will increase and the
https://www.cambridge.org/core
. University of Nottingham
, on
07 Aug 2017 at 12:42:44
, subject to the Cambridge Core terms of use, available at
https://www.cambridge.org/core/terms
ϕ
ϕ
ϕ,
0
ϕ
4,000 rpm
[image:13.482.112.376.60.264.2]4,000 rpm
Figure 10. Tangential velocity normalised with its respective tangential velocity at the inletvϕ/vϕ,0versus
the radiusr/r0with (dashed line) and without the metal foam (solid line),
and solid body rotation (dotted line).
pressure will drop, as described in the previous section. The pressure losses due to centrifugal effects increase with increasing rotational speed as the tangential flow velocities are higher (seeFigs 9and4).
As can be seen for the case with an air mass flow rate of 20 g/s at 4,000 rpm inFig. 9, if the difference between the fluid’s tangential velocity and the foam velocity at point 2 (directly downstream the foam) is small, the curves with and without a foam show little difference. Therefore, the vortex pressure losses for the configurations with and without foam insert are very similar. For the case with the foam, the additional losses due to the flow through the foam have to be taken into account. This observation places the critical rotor speed lower than 4,000 rpm for this mass flow rate, which can be confirmed with the results inFig. 4.
For low rotor speeds, the foam causes a much smaller tangential flow velocity downstream from the foam, resulting in significantly lower vortex pressure losses. This can be seen in
Fig. 4 for an air mass flow rate of 100 g/s at 4,000 rpm. Furthermore, if the rotor speed is increased, the flow is accelerated to this higher velocity, resulting in an increased vortex pressure loss for this case (compare 20 g/s air mass flow at 6,000 rpm).
Generally, it can be concluded fromFig. 10that in the case with a foam installed, if the rotational speed rises, the increase in tangential velocity for rr
0 <0.4 is significantly higher than in the case without a foam (compareFig. 10). Thus, the increase in pressure loss due to rising rotational speeds is higher with a foam installed than without a foam, which explains the different slopes inFig. 4.
The ratio of rotor speed to tangential fluid velocity at the metal foam inlet (point 2) facilitates the explanation of the critical rotational speed beyond which the total pressure losses for a configuration with foam exceeds the total pressure loss without foam. This ratio is therefore an important parameter for describing the phenomena leading to the pressure losses in the breather.
https://www.cambridge.org/core
. University of Nottingham
, on
07 Aug 2017 at 12:42:44
, subject to the Cambridge Core terms of use, available at
4.0 CONCLUSION
This paper presents the experimental results obtained from a rotating aero-engine oil separator. Pressure drop was recorded for air mass flows rates of up to 100 g/s, rotational speeds of up to 6,000 rpm and three different configurations, one without a metal foam and two with foams of different porosity.
An analytical approach for the calculation of the pressure losses without rotation has been derived and found to be within excellent agreement with the experimental results. It was proven that the pressure drop is caused mainly by centrifugal forces, resulting from the swirling flow in the separator. Also, significant losses appear when the flow passes the metal foam.
Rotation of the rotor causes the tangential velocities of the fluid to increase and the metal foam imposes its velocity onto the flow. It was shown that the influence of rotation depends on the ratio of the rotor speed to the tangential velocity of the air.
Considering these results for technical applications the pressure loss due to vortex losses can be reduced by decreasing the tangential speed especially close to the axis of rotation. This can be accomplished by installing a metal foam, a flow rectifier or any other device to deflect the flow like guiding vanes or blades. Especially if a rotating metal foam is used in combination with high rotational speed additional measures have to be taken to decrease the tangential velocity before it is dissipated.
REFERENCES
1. Glahn, A. and Wittig, S. Two-phase air/oil flow in aero engine bearing chambers: Characterization of oil film flows,Journal of Engineering for Gas Turbines and Power, 1996,118, (3), p 578.
2. Glahn, A., Kurreck, M., Willmann, M. and Wittig, S. Feasibility study on oil droplet flow investigations inside aero engine bearing chambers—PDPA techniques in combination with numerical approaches,Journal of Engineering for Gas Turbines and Power, 1996,118, (4), p 749, ISSN 07424795.
3. Krug, M.B., Peduto, D., Kurz, W. and Bauer, H.-J. Experimental investigation into the efficiency of an aero-engine oil jet supply system,Journal of Engineering for Gas Turbines and Power, 2015,
137, (1), p 011505. doi: 10.1115/1.4028255.
4. Kurz, W., Dullenkopf, K. and Bauer, H.-J. Influences on the oil split between the offtakes of an aero-engine bearing chamber, ASME Paper No. GT2012-69412, 2012, p 2251.
5. Kurz, W., Dullenkopf, K. and Bauer, H.-J. Capacitive film thickness measurements in a ventless aero-engine bearing chamber—influence of operating conditions and offtake design,Journal of Engineering for Gas Turbines and Power, 2013,135, (11), p 112504. doi: 10.1115/1.4025067.
6. Wittig, S., Glahn, A. and Himmelsbach, J. Influence of high rotational speeds on heat transfer and oil film thickness in aero engine bearing chambers, ASME Paper No. 93-GT-209, 1993. 7. Gruselle, F., Steimes, J. and Hendrick, P. Study of a two-phase flow pump and separator
system, Journal of Engineering for Gas Turbines and Power, 2011, 133, (6), p 062401. doi:10.1115/1.4002470.
8. Steimes, J., Gruselle, F. and Hendrick, P. Performance study of an air-oil pump and separator solution, ASME Paper No. GT2012-68895, 2012, p 103.
9. Steimes, J., Gruselle, F. and Hendrick, P. Study of an air-oil pump and separator solution for aero engine lubrication systems, ASME Paper No. GT2013-94483, 2013, p V002T01A008. 10. Feng, J., Chang, Y., Peng, X. and Qu, Z. Investigation of the oil–gas separation in a horizontal
separator for oil-injected compressor units,Proceedings of the Institution of Mechanical Engineers, Part A: Journal of Power and Energy, 2008,222, (4), pp 403-412.
11. Sheridan, W.G., Swayze, S.T. and Glahn, J.A. De-oiler system for improved oil containment, ASME Paper No. GT2006-90035, 2006, pp 1283–1290.
https://www.cambridge.org/core
. University of Nottingham
, on
07 Aug 2017 at 12:42:44
, subject to the Cambridge Core terms of use, available at
https://www.cambridge.org/core/terms
modelling of two-phase flow in aero-engine air/oil separators, ASME Paper No. GT2016-56633, 2016.
15. Farrall, M., Hibberd, S., Simmons, K. and Giddings, D. Prediction of air/oil exit flows in a commercial aero-engine bearing chamber,Proceedings of the Institution of Mechanical Engineers, Part G: Journal of Aerospace Engineering, 2006,220, (3), pp 197-202.
16. Cortes, C. and Gil, A. Modeling the gas and particle flow inside cyclone separators,Progress in Energy and Combustion Science, 2007,33, (5), pp 409-452.
https://www.cambridge.org/core
. University of Nottingham
, on
07 Aug 2017 at 12:42:44
, subject to the Cambridge Core terms of use, available at