TECHNICAL NOTE
Validation of the log
e
–
log
σ
normal compression law using
particle strength data
J. DE BONOand G. R. MCDOWELL†
This note is a study of experimental data on particle strength and normal compression, to establish whether the normal compression law proposed by McDowell and de Bono in 2013 is supported and confirmed. A number of different sands are examined and found to support the hypothesis. In addition, some new simulations on sand mixtures are used to explain experimental results for quartz–feldspar mixtures. It would appear that the proposed compression law is also supported by the data for the sand mixtures.
KEYWORDS: compressibility; particle crushing/crushability
INTRODUCTION
Following Pestana & Whittle (1995), McDowell (2005) showed analytically that the normal compression line (NCL) for a sand loaded quasi-statically to high stresses should be linear on loge–logσaxes. This was based on the kinematics of particle fracture and the assumption of fractal crushing. McDowell & de Bono (2013) subsequently inves-tigated this using the discrete-element method (DEM), and proposed the following compression law for granular soil
loge¼logey
1 2blog
σ′
σy′ ð
1Þ
whereeis the current voids ratio,σis the current stress,eyand
σydescribe the yield point andbis the size effect on particle
strength, according to
σav/ db ð2Þ
whereσavis the average particle strength (for particles of size
d). For a given material, the parameter b describes how rapidly the average particle strength increases with decreasing size, and as shown in equation (1),b determines the slope (= 1/2b) of the NCL for the material.
Using the DEM and a simple particle breakage model, which replaced broken particles with smaller fragments, the authors correctly reproduced experimental compression results for silica sand tests (McDowell & de Bono, 2013), using strengths and a hardening law obtained experimentally from single-particle crushing tests. This DEM model also reproduced the correct NCLs according to equation (1) for a range ofb-values.
The compression law thus far has only been compared with a single set of experimental data (silica sand;
McDowell, 2002). This lack of experimental validation is due to the sparsity of available data–comparison with a real sand requires both the size effect on particle strength in addition to normal compression data. Although there is a wealth of normal compression data available, data on particle strengths and the variation of strength with size for any specific sand are much more limited.
When particle strength data are available, they will often either be for a single particle size or indiscriminate to particle size (e.g. Nakataet al., 2001b; Takeiet al., 2001), therefore giving little indication as to the size effect, and only a qualitative indication of the macroscopic yield strength. In other cases, when average particles strengths are reported for a range of particle sizes, enabling an estimation of the size effect (i.e.bin equation (2)), this is not always accompanied by any normal compression results (e.g. Boltonet al., 1991; Lobo-Guerrero & Vallejo, 2006; Brzesowskyet al., 2011).
In this note, the authors have compiled data for all sands for which both the size effect on particle strength and normal compression results are readily available (as far as the authors are aware), in order to investigate whether the slope of the compression line is indeed a function of the size effect on particle strength, and whether it can be correctly predicted by the above compression law (equation (1)).
PARTICLE STRENGTHS AND SIZE EFFECT
The compression law (McDowell, 2005; McDowell & de Bono, 2013) was originally compared to a single set of results for Leighton Buzzard silica sand. The particle strengths for this sand were obtained experimentally (McDowell, 2002) through single particle crushing tests, and were measured as
σ/ dF2 ð3Þ
where F was taken to be the maximum force causing catastrophic splitting of the particle, and dwas taken to be the size at failure. As detailed in McDowell (2002), as well as subsequent studies (McDowell & Amon, 2000; McDowell & de Bono, 2013), it was found that the Leighton Buzzard sand particles obeyed Weibull statistics. That is, the variation in strengths for any given particle size relates to the average increase in strength with decreasing size. If Weibull statistics
University of Nottingham, Nottingham, UK (Orcid:0000-0002-0637-712X).
†University of Nottingham, Nottingham, UK.
Manuscript received 16 February 2017; revised manuscript accepted 7 July 2017.
Discussion on this paper is welcomed by the editor.
apply, then equation (2) can be written
σav/ d3=m ð4Þ
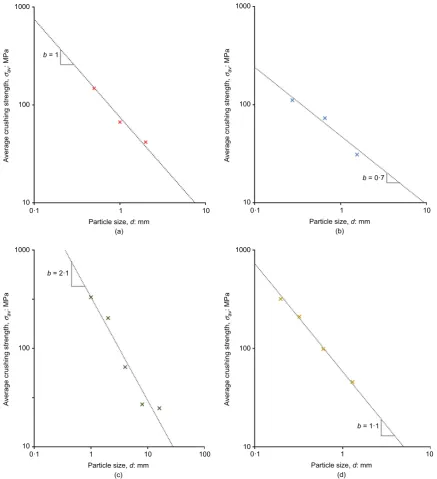
where m is the Weibull modulus, which describes the variability in strength (which increases with decreasing variability). For the Leighton Buzzard sand, m was found to be 3·3, and so the b value was taken as (3/3·3) = 0·9. As discussed in McDowell & de Bono (2013), whether or not Weibull statistics apply makes no difference to the com-pression law; it is only the exponent b that determines the compressibility. The strengths for this sand are plotted in Fig. 1(a), and a trend-line–for which the slope is equal tob–is shown; for simplicity this value for Leighton Buzzard sand is taken here to be 1.
Nakata et al. (2001a) presented extensive single-particle crushing results for a range of sands, along with correspond-ing normal compression data; however, only for a scorrespond-ingle sand did they report the average strengths across a range of sizes.
The strengths for this‘silica sand’are reproduced in Fig. 1(b), with a trend-line superimposed to estimate the value of b. The strengths were measured according to equation (3) (takingdas the initial distance between platens), and each average strength provided corresponded to a size range (e.g. 1·4–1·7 mm). For the purpose of obtainingb, the data points in Fig. 1(b) use the mid-value of the size range (e.g. 1·55 mm). The data in Fig. 1(b) suggest ab-value of around 0·7.
McDowell & Amon (2000) presented comprehensive data on the strengths and associated size effect for the carbonate Quiou sand. Normal compression lines for this sand can be found in both McDowell & Amon (2000) and Pestana & Whittle (1995). The average measured strengths for this sand are plotted in Fig. 1(c), along with a superimposed trend-line with a b-value of approximately 2·1. McDowell & Amon (2000) reported a Weibull modulus of around 1·5, which would suggestb2.
0·1 1
(a)
10 10
100 1000
b = 1
Particle size, d: mm
A
v
erage crushing strength,
σav
: MPa
0·1 1
(b)
10 10
100 1000
b = 0·7
Particle size, d: mm
A
v
erage crushing strength,
σav
: MPa
0·1 1
(c)
10 100
10 100 1000
b = 2·1
Particle size, d: mm
A
v
erage crushing strength,
σav
: MPa
0·1 1
(d)
10 10
100 1000
b = 1·1
Particle size, d: mm
A
v
erage crushing strength,
σav
[image:2.595.86.524.271.751.2]: MPa
Kwaget al. (1999) presented average crushing strengths for a range of sands, of which most also have normal com-pression data available. They used an equation similar to equation (3); however, the strengths they reported were calculated using the‘first breakage force’. As shown in their results, the particles tested would go on to sustain much larger
[image:3.595.60.514.153.764.2]forces before catastrophic failure and splitting, so it would be inappropriate to interpret their strengths as resulting in particle splitting, but instead to the breakage of asperities. One of the sands tested was Quiou sand, and theb-value they found was approximately 0·65, markedly lower than that reported by McDowell & Amon (2000) on the same sand.
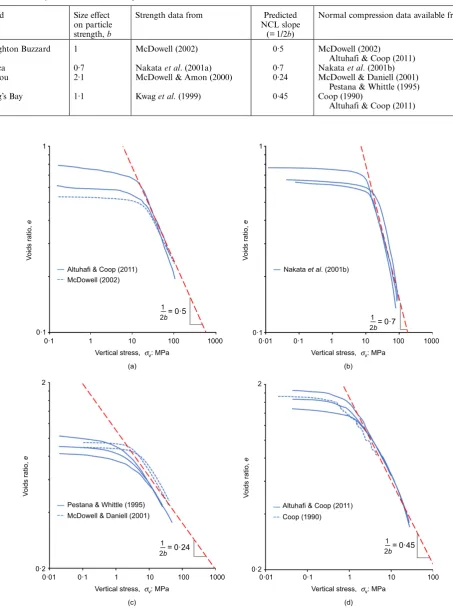
Table 1. Summary of sands used with compression law
Sand Size effect
on particle strength,b
Strength data from Predicted NCL slope
(= 1/2b)
Normal compression data available from
Leighton Buzzard 1 McDowell (2002) 0·5 McDowell (2002)
Altuhafi & Coop (2011) Silica 0·7 Nakataet al. (2001a) 0·7 Nakataet al. (2001b) Quiou 2·1 McDowell & Amon (2000) 0·24 McDowell & Daniell (2001)
Pestana & Whittle (1995) Dog’s Bay 1·1 Kwaget al. (1999) 0·45 Coop (1990)
Altuhafi & Coop (2011)
0·1 1 10 100
(a)
1000 0·1
1
Altuhafi & Coop (2011) McDowell (2002)
Vertical stress, σv: MPa
V
oids ratio,
e
1 2b= 0·5
0·01 0·1 1 10 100
(b)
1000 0·1
1
Nakata et al. (2001b)
Vertical stress, σv: MPa
V
oids ratio,
e
1 2b= 0·7
0·01 0·1 1 10 100
(d) 0·2
2
Altuhafi & Coop (2011)
Coop (1990)
Vertical stress, σv: MPa
V
oids ratio,
e
1 2b= 0·45
0·01 0·1 1 10 100
(c)
1000 0·2
2
Pestana & Whittle (1995) McDowell & Daniell (2001)
Vertical stress, σv: MPa
V
oids ratio,
e
1 2b= 0·24
Fig. 2. Normal compression results for: (a) Leighton Buzzard sand; (b) silica sand; (c) Quiou sand; (d) Dog’s Bay sand
However, Kwag et al. (1999) included particle strength data for Dog’s Bay sand, a carbonate sand. Inspecting the force–displacement plots (and considering the shell-like particle shape) it is plausible in this case that the ‘first breakage force’ used to calculate particle strength did correspond to particle splitting. They took account of the irregular particle shape by using (dmindmax) instead ofd2
when calculating the strengths. The reported strengths for this sand are plotted in Fig. 1(d), and suggest a slope of around 1·1. Normal compression lines for Dog’s Bay sand can be found in the work of Coop – for example, Coop (1990).
Although the researchers mentioned above used subtly different diameters in equation (3), this should not make any difference to any of theb-values estimated from the reported strengths. A summary of the above sands is given in Table 1.
NORMAL COMPRESSION RESULTS
One-dimensional normal compression results for each sand are presented in Fig. 2. In each plot, a trend-line is shown which has the slope according to the compression law and in Table 1; hence a close fit would suggest that the compression law does indeed apply. Of least surprise are the results for Leighton Buzzard silica sand (McDowell, 2002), which had been previously shown to demonstrate agreement; however, in this plot also shown are normal compression data from Altuhafi & Coop (2011), which exhibit approximately the same slope.
The results for the silica sand from Nakataet al. (2001b) display good agreement with the predicted slope of 0·7, as do the Quiou sand results from McDowell & Daniell (2001) and Pestana & Whittle (1995) with a slope of 0·24; also the Dog’s Bay sand with a slope of 0·45 (Coop, 1990; Altuhafi & Coop, 2011). The agreement shown overall by all of the sands here is very encouraging, and suggests that the compression law also applies to these sands.
It is worth noting that the initial gradings of the tests shown in Fig. 2 were diverse. For the Leighton Buzzard sand results, both McDowell (2002) and Altuhafi & Coop (2011) used initially uniform samples, with 1·18 mm,d,2 mm and 1 mm,d,2 mm, respectively. The results shown from Nakata et al. (2001b) on silica sand also used uniform initial samples with 1·4 mm,d,1·7 mm. The Quiou sand samples used by McDowell & Daniell (2001) were slightly more well graded, with initial sizes of 0·15 mm,d,0·5 mm and 0·6 mm,d,1·18 mm (it is unclear what initial grading was used by Pestana & Whittle (1995)). The results for Dog’s Bay sand were from initial samples with 0·25 mm,d,0·5 mm and 0·1 mm, d,1 mm.
DISCUSSION
The comparison with the available experimental data supports the compression law and suggests that it can be applied to any sand; however, a much larger quantity of experimental data is desirable. One potential application of the compression law could be in the prediction of the compressibility of rockfill dams, a material for which particle strength data appear to be available (e.g. Marsal, 1967; Frossard et al., 2012; Ovalle et al., 2014). However, corresponding normal compression results to stresses high enough to obtain the slope of the NCL are not as widely available.
The most obvious limitation of the compression law is that it appears to be applicable only to homogeneous sands–that is, those consisting of a single material. Nakataet al. (1999) reported the particle strengths for a range of sizes of Aio
sand, which was composed of two main constituents: 68·7% quartz and 31·3% feldspar.
Nakata and co-workers presented the average strengths for each material, and measured Weibull moduli of 4·2 and 1·8, respectively, for the quartz and feldspar particles. Using equation (4), they suggested b-values of (3/4·2 =) 0·71 and (3/1·8 =) 1·67, which are shown by the dashed lines in Fig. 3. The average strengths for the feldspar particles do not exhibit a strong agreement with the predicted value, suggesting that Weibull statistics (or bulk fracture) may not apply to these particles. Alternatively, it could be that simply not a wide enough range of sizes were tested; the average strengths span an interval of,1 mm. Compared to the figures above, this is a narrow size range and is not great enough to reliably estimate the size effect on strength, which is plausible observing that the strengths appear similar in magnitude, and do not increase monotonically with decreasing size as would be expected. As was done for the data in Fig. 1, alternative‘best-fit’trend lines have been fitted to the data in Fig. 3, shown by the dotted lines, and it can be seen that this method suggests a significantly different b-value for the feldspar of 0·12.
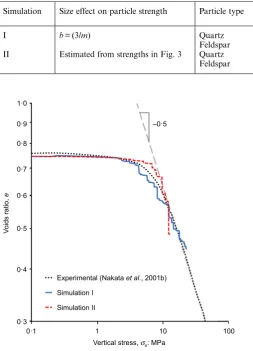
In an attempt to clarify the most likely particle strengths, as well as to relate these to the slope of the NCL, a pair of DEM simulations have been performed on samples of Aio sand, using the two alternative sets ofb-values: (I) derived from the Weibull moduli, and (II) usingb-values estimated from ‘best-fit’ trend-lines. These simulations use the same model as previously used by the authors (e.g. de Bono & McDowell, 2016) to correctly predict the compression behaviour for Leighton Buzzard sand, as well as the compression lines according to equation (1) for various b-values. However, unlike previous simulations, in this case, the numerical soil samples are heterogeneous and consist of two distinct types of particle with separate hardening laws to reflect the Aio sand. The properties of the samples and a summary of the two simulations are given in Table 2. The resulting compression lines from the simulations are com-pared to the experimental results from Nakataet al. (2001b) for Aio sand in Fig. 4.
0·1 1 10
1 100
10 1000
1·67
Quartz particles
Feldspar particles
Based on Weibull modulus
‘Best fit’
0·71
0·45
0·12
Particle size, d: mm
A
v
erage crushing strength,
σav
[image:4.595.317.550.496.751.2]: MPa
For the stresses reached in the simulations, simulation I (size effect estimated from the Weibull moduli) displays a closer match to the experimental results. Simulation II, using the‘best-fit’b-values demonstrates substantial crushing upon yield, and a rapid reduction in volume and a large gradient (.1). This is not surprising considering the low b-values, meaning that average particle strength does not increase greatly as fragments become smaller, allowing continuing breakage with very little increase in applied stress. Both simulation I and the experimental results appear to suggest a NCL slope of around 0·5, suggesting that the size effect implied by the Weibull moduli was fairly accurate.
For a homogeneous sand, a NCL slope of 0·5 would imply a hardening effect of around b1, which is distinctly intermediate between the individual values of0·7 and 1·7 for quartz and feldspar. It therefore appears that, for a two-part sand, the compressibility is limited by that of the two constituent particle types. What determines the actual slope of the NCL of a heterogeneous sand, however, is probably complex, and may depend on a number of factors, such as the relative magnitude of strengths, particle shape, proportion by mass and so on. More detailed further work is warranted, including looking at the resulting particle size distributions that emerge from heterogeneous sands.
CONCLUSIONS
This study has aimed to validate the recently published McDowell & de Bono (2013) compression law by comparing with available experimental results. The compression law
states that the compressibility of sand (at stresses great enough to initiate particle crushing) is based on the rate of increase in average particle strength with decreasing particle size. From the limited data available to compare with, the compression law was shown to correctly predict the slope of the NCL in each case.
The case of a heterogeneous sand, comprising two distinct mineral components, was discussed and briefly compared with some new simulations on sand mixtures. The results suggested that the compressibility of a two-part sand is intermediate to that of the two distinct components, the precise nature of which will be the subject of further work.
This note has therefore produced, for the first time, more extensive corroborative data in support of the log e–log σ NCL with a slope of1/2b, which lends credibility to the McDowell (2005) theoretical and McDowell & de Bono (2013) numerical approaches, supporting the hypothesis that equation (1) really is the correct form of the NCL.
ACKNOWLEDGEMENT
This work was supported by the Engineering and Physical Sciences Research Council (EP/L019779/1).
NOTATION
b size effect on particle strength
d particle diameter
e voids ratio
ey voids ratio at yield F force acting on particle
m Weibull modulus for distribution of strengths σ stress
σav average strength for a given size of particle
σv vertical stress
REFERENCES
Altuhafi, F. N. & Coop, M. R. (2011). Changes to particle characteristics associated with the compression of sands.
Géotechnique 61, No. 6, 459–471, http://dx.doi.org/ 10.1680/geot.9.P.114.
Bolton, M. D., Fragaszy, R. J. & Lee, D. M. (1991). Broadening the specification of granular fills.Transp. Res. Rec.1309, 35–41. Brzesowsky, R. H., Spiers, C. J., Peach, C. J. & Hangx, S. J. T. (2011).
Failure behavior of single sand grains: theory versus experiment.
J. Geophys. Res., Solid Earth116, No. B6, B06205.
Coop, M. R. (1990). The mechanics of uncemented carbonate sands. Géotechnique 40, No. 4, 607–626, http://dx.doi.org/ 10.1680/geot.1990.40.4.607.
de Bono, J. P. & McDowell, G. R. (2016). The fractal micro mechanics of normal compression.Comput. Geotech.78, 11–24, https://doi.org/10.1016/j.compgeo.2016.04.018.
Frossard, E., Dano, C., Hu, W. & Hicher, P. Y. (2012). Rockfill shear strength evaluation: a rational method based on size effects. Géotechnique 62, No. 5, 415–427, http://dx.doi.org/ 10.1680/geot.10.P.079.
Kwag, J. M., Ochiai, H. & Yasufuku, N. (1999). Yielding stress characteristics of carbonate sand in relation to individual particle fragmentation strength. In Engineering for calcareous sediments (ed. K. A. Al-Shafei), pp. 79–87. Rotterdam, the Netherlands: Balkema.
0·1 0·3 0·4 0·5 0·6 0·7 0·8 0·9 1·0
1 10 100
Experimental (Nakata et al., 2001b)
Simulation I
Simulation II
–0·5
Vertical stress, σv: MPa
V
oids ratio,
e
[image:5.595.43.297.69.421.2]Fig. 4. Numerical and experimental compression results for Aio sand Table 2. Key details of simulations
Simulation Size effect on particle strength Particle type Proportion by mass: % Average strength of initial (2 mm) particles: MPa
b
I b= (3/m) Quartz 68·7 29·9 0·71
Feldspar 31·3 8·2 1·67
II Estimated from strengths in Fig. 3 Quartz 68·7 35 0·45
Feldspar 31·3 19·8 0·12
Lobo-Guerrero, S. & Vallejo, L. E. (2006). Application of Weibull statistics to the tensile strength of rock aggregates.J. Geotech. Geoenviron. Engng132, No. 6, 786–790.
Marsal, R. J. (1967). Large scale testing of rockfill materials.J. Soil Mech. Found. Div. ASCE43, No. 2, 27–44.
McDowell, G. R. (2002). On the yielding and plastic compression of sand.Soils Found.42, No. 1, 139–145.
McDowell, G. R. (2005). A physical justification for loge–log σ based on fractal crushing and particle kinematics.
Géotechnique 55, No. 9, 697–698, http://dx.doi.org/10.1680/ geot.2005.55.9.697.
McDowell, G. R. & Amon, A. (2000). The application of Weibull statistics to the fracture of soil particles.Soils Found.40, No. 5, 133–141.
McDowell, G. R. & Daniell, C. M. (2001). Fractal compression of soil. Géotechnique 51, No. 2, 173–176, http://dx.doi.org/ 10.1680/geot.2001.51.2.173.
McDowell, G. R. & de Bono, J. P. (2013). On the micro mechanics of one-dimensional normal compression.
Géotechnique 63, No. 11, 895–908, http://dx.doi.org/10.1680/ geot.12.P.041
Nakata, Y., Hyde, A. F. L., Hyodo, M. & Murata, H. (1999). A probabilistic approach to sand particle crushing in the triaxial test. Géotechnique 49, No. 5, 567–583, http://dx.doi.org/ 10.1680/geot.1999.49.5.567.
Nakata, Y., Hyodo, M., Hyde, A. F., Kato, Y. & Murata, H. (2001a). Microscopic particle crushing of sand subjected to high pressure one-dimensional compression.Soils Found.41, No. 1, 69–82. Nakata, Y., Kato, Y., Hyodo, M., Hyde, A. F. & Murata, H. (2001b).
One-dimensional compression behaviour of uniformly graded sand related to single particle crushing strength.Soils Found.41, No. 2, 39–51.
Ovalle, C., Frossard, E., Dano, C., Hu, W., Maiolino, S. & Hicher, P. Y. (2014). The effect of size on the strength of coarse rock aggregates and large rockfill samples through experimental data.
Acta Mech.225, No. 8, 2199–2216.
Pestana, J. M. & Whittle, A. J. (1995). Compression model for cohesionless soils. Géotechnique 45, No. 4, 611–631, http://dx.doi.org/10.1680/geot.1995.45.4.611.