Members in Relation to Nutritional Status, Diet
Composition and Flesh Texture in Gilthead Sea Bream
(
Sparus aurata
)
Cristina Salmero´n1, Daniel Garcı´a de la serrana2, Vanesa Jime´nez-Amilburu1, Ramo´n Fontanillas3, Isabel Navarro1, Ian A. Johnston2, Joaquim Gutie´rrez1, Encarnacio´n Capilla1*
1Department of Physiology and Immunology, Faculty of Biology, University of Barcelona, Barcelona, Spain,2Scottish Oceans Institute, School of Biology, University of St Andrews, St Andrews Fife, Scotland, United Kingdom,3Skretting Aquaculture Research Centre, Stavanger, Norway
Abstract
Calpains are non-lysosomal calcium-activated neutral proteases involved in a wide range of cellular processes including muscle proteolysis linked topost-mortemflesh softening. The aims of this study were (a) to characterise several members of the calpain system in gilthead sea bream and (b) to examine their expression in relation to nutritional status and muscle tenderisation. We identified the complete open reading frame of gilthead sea bream calpains1-3, sacapn1, sacapn2, sacapn3, and two paralogs of the calpain small subunit1,sacapns1aand sacapns1b. Proteins showed 63–90% sequence identity compared with sequences from mammals and other teleost fishes, and the characteristic domain structure of vertebrate calpains. Transcripts ofsacapn1,sacapn2, sacapns1aand sacapns1bhad a wide tissue distribution, whereas sacapn3was almost exclusively detected in skeletal muscle. Next, we assessed transcript expression in skeletal muscle following alteration of nutritional status by (a) fasting and re-feeding or (b) feeding four experimental diets with different carbohydrate-to-protein ratios. Fasting significantly reduced plasma glucose and increased free fatty acids and triglycerides, together with a significant increase insacapns1bexpression. Following 7 days of re-feeding, plasma parameters returned to fed values andsacapn1,sacapn2,sacapns1aandsacapns1bexpression was significantly reduced. Furthermore, an increase in dietary carbohydrate content (11 to 39%) diminished growth but increased muscle texture, which showed a significant correlation with decreasedsacapn1andsacapns1aexpression, whilst the other calpains remained unaffected. This study has demonstrated that calpain expression is modulated by nutritional status and diet composition in gilthead sea bream, and that the expression of several calpain members is correlated with muscle texture, indicating their potential use as molecular markers for flesh quality in aquaculture production.
Citation:Salmero´n C, Garcı´a de la serrana D, Jime´nez-Amilburu V, Fontanillas R, Navarro I, et al. (2013) Characterisation and Expression of Calpain Family Members in Relation to Nutritional Status, Diet Composition and Flesh Texture in Gilthead Sea Bream (Sparus aurata). PLoS ONE 8(9): e75349. doi:10.1371/ journal.pone.0075349
Editor:Subhabrata Sanyal, Emory University, United States of America
ReceivedMay 27, 2013;AcceptedAugust 12, 2013;PublishedSeptember 25, 2013
Copyright:ß2013 Salmero´n et al. This is an open-access article distributed under the terms of the Creative Commons Attribution License, which permits unrestricted use, distribution, and reproduction in any medium, provided the original author and source are credited.
Funding:EC is a Ramo´n y Cajal researcher fellow from the ‘‘Ministerio de Ciencia e Innovaci’’ (MICINN). This work was supported by funds from the MICINN (AGL2009-12427 and AGL2010-17324), the Catalonian Government (2009SGR-00402) and the ‘‘Xarxa de Refere`ncia d’R+D+I en Aqu¨icultura’’ and the European Union through the project LIFECYCLE (FP7-222719). The funders had no role in study design, data collection and analysis, decision to publish, or preparation of the manuscript.
Competing Interests:Ramon Fontanillas is employed as a senior researcher at Skretting Aquaculture Research Center but this does not alter the authors’ adherence to all the PLOS ONE policies on sharing data and materials.
* E-mail: [email protected]
Introduction
Gilthead sea bream (Sparus aurata) is an important marine species reared in the Mediterranean area. In 2011, 94,4% of its production came from farms (151.346Tn), whereas only 5,6% (8.330Tn) came from extractive fishing [1]. The axial musculature or fillet is the main product of aquaculture and in gilthead sea bream represents approximately 65% of body mass.
While in terrestrial farmed animals meat tenderisation is a desirable process, in farmed fish freshness and firm texture are considered among the most important quality attributes of the flesh. Texture is influenced by various physical, chemical, biochemical and microbiological changes that may occur post-mortem, finally resulting in a loss of quality. An important
determinant of flesh texture is muscle cellularity i.e. the number and size distribution of the fibres [2], [3]. These parameters can be affected by a number of factors such as diet [4], [5], [6], photoperiod [7], temperature [8], [9], [10] and exercise training [11–14].
duringpost-mortemstorage of meat are caused by muscle proteases, especially members of these two families [15].
Calpains are Ca2+-dependent intracellular proteases that belong to the papain superfamily of cysteine proteases and are found in almost all eukaryotes and a few bacteria, but not in archaebacteria [16]. The human genome contains 15 genes that encode calpains. Nine of them encode the classical calpains, Calpain1 to Calpain3, Calpain8, Calpain9, and Calpain11 to Calpain14. All of them contain a C2-like (CL2) and a penta EF-hand (PEF) domain plus the calpain-like protease (CysPc) domain. The remaining non-classical calpains (Calpain5 to Calpain7, Calpain10, Calpain15 and Calpain16) lack both, the CL2 and PEF domains [16]. Depending on their expression across tissues, classical calpains are classified in humans as ubiquitous (calpain1,calpain2,calpain13and
calpain14) or tissue-specific (calpain3in skeletal muscle,calpain8and
calpain9in gastrointestinal tract,calpain11in testis andcalpain12in hair follicle).
Defects in ubiquitous calpains may be lethal, as seen in
calpain2–/– mice (Mus musculus) [17], whereas defects in tissue-specific calpains may cause tissue-tissue-specific phenotypes such as the muscular dystrophy caused by mutations incalpain3[18]. Calpain1 and Calpain2 have been widely studied in vertebrates; both are 80 kDa catalytic subunits that independently bind a common 30 kDa regulatory subunit (Calpain4 or calpain small subunit) to respectively form a heterodimer, which is namedm-calpain or m-calpain for its activation by micro or millimolar concentrations of Ca2+, respectively. A large number of proteins including cytoskel-etal proteins, kinases, phosphatases, membrane-associated pro-teins, such as receptors or ion channels, and some transcription factors have been reported to be cleaved by calpains in in vitro
assays [19]. Nevertheless, experimental evidence has clearly suggested that m-calpain, but not m-calpain, has the most significant role in post-mortem proteolysis and meat tenderisation [20].
Previous studies in rainbow trout (Oncorhynchus mykiss) [21], Atlantic halibut (Hippoglossus hippoglossus) [22], zebrafish (Danio rerio) [23] and more recently in channel catfish (Ictalurus punctatus) [24] have shown that fish calpains have high amino acid identity and the characteristic domains of their orthologs in mammals. Retained paralogs of several calpain family members have been identified from the Whole Genome Duplication that occurred early in the adaptive radiation of the bony fishes [22], [25]. Teleosts also contain a ubiquitously expressedm/m calpain which has one-to-one orthology with the testis-restricted calpain11 in placental mammals [25]. It has also been reported that teleost calpains may be differentially regulated according to nutritional status. For example, in Atlantic halibut with 60 days of feed restriction, it was shown that calpain1 transcript levels were significantly decreased after 7 days of re-feeding; at the same time that calpain3 and calpain11 expression significantly increased, whereas calpain2-like showed little response [22]. In channel catfish, 35 days of fasting increased the expression of calpain2, while decreasing that ofcalpain1andcalpain3[24]. In another study in rainbow trout, fasting also for 35 days stimulated the expression of calpain1, calpain2 and calpastatin (the endogenous specific inhibitor of ubiquitous calpains), suggesting a potential role for calpains in protein mobilization as a source of energy under catabolic conditions [21]. The same authors also observed that rainbow trout strains with reduced growth rate and softest fillet had significantly lower levels of calpastatin expression, but this softness effect related to the strain disappeared when fish were fed a high energy diet, indicating that diet also modulates calpain expression and texture [26]. Another study in sea bass (Dicentrarchus labrax) fed diets with three different levels of fat reported that a
high lipid content in muscle could be responsible for faster post-mortemproteolysis, and suggested a possible activation of calpains related to lipid accumulation [27]. Further research is needed to elucidate the potential importance of diet, calpain expression and/ or activity on texture in key aquaculture species.
The first objective of the present study was to identify and characterise different members of the calpain proteolytic system in gilthead sea bream. Secondly, in order to better understand the physiological situations that may regulate calpains expression in this species, transcript abundance was studied in fast-twitch skeletal muscle in response to: fasting/re-feeding conditions and various experimental diets with different ratios of protein and carbohydrate. Finally, the relationship between calpains expres-sion and fillet firmness was also examined to determine their potential use as molecular markers of flesh quality.
Materials and Methods
Ethics statement
All animal handling procedures were approved by the Ethics and Animal Care Committee of the University of Barcelona (CEEA 239/09) and the Departament de Medi Ambient i Habitatge (DMAH permit number 5420, Generalitat de Catalu-nya, Spain) following the European Union, Spanish and Catalan Government-established norms and procedures.
Animals and experimental trials
For the tissue screening experiment 10 juvenile gilthead sea bream (67.1469.89 g, 15.8660.88 cm fork length) from Tiname-nor S.L (Pesue´s, Spain) were maintained at the facilities of the University of Barcelona (Barcelona, Spain), fedad libitumtwice a day with commercial pellets (Excel, Skretting, Burgos, Spain) and held at 2161uC, pH of 7.5–8 in a recirculating seawater tank (400 L) with 12 h light:12 h dark photoperiod.
For the fasting/re-feeding experiment 120 juvenile gilthead sea bream (49.5265.91 g) from the Institut de Recerca i Tecnologia Agroalimenta`ries (IRTA, Sant Carles de la Ra`pita, Spain) were maintained at the facilities of the University of Barcelona (Barcelona, Spain) homogenously distributed in 8 recirculating seawater tanks (200 L) and held at 2161uC, pH 7.5–8 with 12L:12D photoperiod. Fish were acclimated for a month and fed at 3% body weight twice a day (the ration was given 70% in the morning and 30% in the afternoon) with commercial pellets (Excel, Skretting, Burgos, Spain). First, 1 fish from each tank was sampled for time 0 (D0C). Then, fish were divided into two conditions: Control fed group (C) and Fasted group (F). The F group was fasted during 30 days while the C group was fed at 3% body weight for the duration of the whole experiment. Samples of 8 fish from each condition were collected at days 15 and 30 (D15C/F and D30C/F). Then, for the re-feeding experiment, fasted animals for 30 days (D0F) were re-fed at 2% body weight (lower than the control normal ration to facilitate correct adaptation of the digestive system) during 7 and 14 days and sampled (8 fish per condition at each time, D7R and D14R).
respectively) and 17% lipid (Table 1). At the end of the experiment, 9 fish of each group (3 fish per tank) were sampled for plasma constituents, biometrics, colour, texture and expression analysis. Together with the sampled fish, the remaining fish were also weighted to obtain the specific growth rate (SGR) and the feed conversion rate (FCR) values of all fish.
Before sampling, all animals were fasted 24 h to avoid regurgitation of food and to obtain basal values of plasma metabolites and also to closely mimic the market situation, since this is a common practice before sacrificing commercial products for aquaculture. The fish were then anesthetised with tricaine methane sulphonate (MS-222 0.1 g/L, Sigma, Tres Cantos, Spain) and sacrificed with a blow on the head and medullar section. Blood from all fish of the dietary and fasting/re-feeding experiments was taken (1 mL/fish) from the caudal vein using 23G syringes with EDTA-Na and quickly centrifuged at 5000 rpm for 10 min to separate the plasma. Biometrics including body weight, total length, hepatosomatic index (HSI), mesenteric fat index (MFI) and condition factor (CF) were measured. Flesh colour was analysed and samples of fast skeletal muscle were either taken for texture measurement and kept on ice, or immediately snap-frozen in liquid nitrogen and stored at –80uC for gene expression analyses. The same procedure was used for 15 distinct tissue-types (fast muscle, slow muscle, fat, bone, head kidney, spleen, eye, brain, stomach, proximal intestine, distal intestine, pyloric caeca, skin, liver and heart) from 10 fish.
Plasma parameters
Plasma glucose concentration was determined by a glucose oxidase colorimetric method (Spinreact, Sant Esteve d’en Bas, Spain). Plasma free fatty acids (FFAs) concentration was measured
using a commercially available kit (NEFA-HR2, Wako Chemicals GmbH, Neuss, Germany). Plasma triglycerides (TGs) were hydrolysed by a lipase, and the released glycerol was measured by a peroxidase-coupled colorimetric assay (Spinreact, Sant Esteve d’en Bas, Spain).
Flesh colour and texture
Muscle colour was measured at the time of sampling using a portable CR400 Chroma Meter (Konica Minolta, Madrid, Spain). The colorimeter was calibrated using the white standard provided. The colour system L*, a* and b* was used for analysis. L* represents lightness (L* = 0 for black, L* = 100 for white), a* indicates red/green (+a* intensity in red and –a* intensity in green) and b* represents yellow/blue (+b* intensity in yellow and –b* intensity in blue) [28]. Values of Chroma (colour intensity) and Hue angle (composed colour) were also obtained in the measurement. It is difficult to present standard colour values for a healthy/desirable muscle due to the great variability observed between studies; nevertheless, muscle colour in gilthead sea bream seems to be strongly related to its fat content [29], [30].
For texture analysis, a slab of ,2 cm2 of skinless flesh, containing fast- and slow-twitch skeletal muscle, was dissected from the anterior-dorsal side of the fish to the dorsal spines and immediately kept on ice until analysis, 24 h later. Thickness of the muscle fillet was taken into consideration for normalisation of the texture data. Texture analysis was done using a TA.XT2i texturometer and a Mini Kramer/Ottawa cell blade in the Escola Superior d’Agricultura de Barcelona (ESAB) facilities, (Castellde-fels, Spain). Total work, maximal strength and elasticity of flesh fragments from 4–8 fish per diet were analysed.
RNA extraction and cDNA synthesis
Total RNA was extracted from ,100 mg of fast muscle and between 40 to 500 mg of the other tissues from the tissue screening experiment, following the guanidinium thiocyanate-phenol-chlo-roform method [31] using TRIreagent (Applied Biosystems, Alcobendas, Spain). Total RNA was quantified using a Nano-Drop2000 spectrophotometer (Thermo Scientific, Alcobendas, Spain), quality was verified as 260/280 and 260/230 ratios were over 1.8 in both cases and RNA integrity was analysed by 1% (m/ v) agarose gel electrophoresis. To eliminate any residual genomic DNA, total RNA was treated with DNase I (Invitrogen, Alcobendas, Spain) following the manufacturer’s recommenda-tions before cDNA synthesis. Onemg of total RNA per sample was used to synthesise first-strand cDNA using the Transcriptor First Strand cDNA Synthesis Kit (Roche, Sant Cugat del Valles, Spain) following the manufacturer’s recommendations. cDNA samples were diluted 1:5 in milliQ H2O for conventional polymerase chain reaction (RT-PCR) and diluted 1:100 in milliQ H2O for real-time quantitative PCR (qPCR).
Calpains cloning and sequencing
[image:3.612.61.299.432.704.2]To obtain the complete sequences of Sparus aurata calpain1 (sacapn1), calpain2 (sacapn2), calpain3 (sacapn3), calpain small subunit1a (sacapns1a), primers for 5’ rapid amplification of cDNA ends (RACE)-PCR and specific primers were designed from gilthead sea bream ESTs (Expressed Sequence Tag) NCBI database (sacapn1: AM951595.1; sacapn2: FM155301.1, FG591123.1, FM152855.1 and FG265085.1; sacapn3: FG262721.1;sacapns1a: AM962179.1 and FM145762) and from 5’RACE-PCR amplicon products forsacapn1 andsacapn2(Table S1). Also, sacapn3 and calpain small subunit1b (sacapns1b) sequences were retrieved from the gilthead sea bream muscle transcriptome performed using 454 pyrosequencing (accession
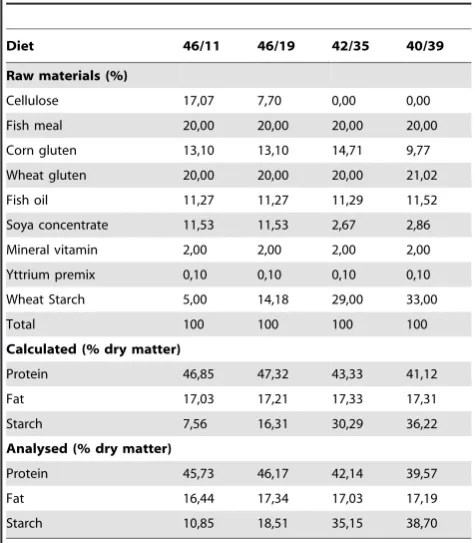
Table 1.Ingredients and chemical composition of the experimental diets.
Diet 46/11 46/19 42/35 40/39
Raw materials (%)
Cellulose 17,07 7,70 0,00 0,00
Fish meal 20,00 20,00 20,00 20,00
Corn gluten 13,10 13,10 14,71 9,77
Wheat gluten 20,00 20,00 20,00 21,02
Fish oil 11,27 11,27 11,29 11,52
Soya concentrate 11,53 11,53 2,67 2,86
Mineral vitamin 2,00 2,00 2,00 2,00
Yttrium premix 0,10 0,10 0,10 0,10
Wheat Starch 5,00 14,18 29,00 33,00
Total 100 100 100 100
Calculated (% dry matter)
Protein 46,85 47,32 43,33 41,12
Fat 17,03 17,21 17,33 17,31
Starch 7,56 16,31 30,29 36,22
Analysed (% dry matter)
Protein 45,73 46,17 42,14 39,57
Fat 16,44 17,34 17,03 17,19
Starch 10,85 18,51 35,15 38,70
number: ERP000874) previously described by Garcia de la serranaetal., [32].
PCR products were separated by gel electrophoresis and purified using a PureLink Quick Gel Extraction Kit, ligated into T/A pCR4-TOPO vector and transformed into chemically competent TOP10Escherichia colicells by thermal shock (all from Invitrogen, Alcobendas, Spain). At least 1–3 clones of each PCR product were sequenced in both T3/T7 orientations using BigDye Terminator v3.1 Cycle Sequencing Kit (Applied Biosystems, Alcobendas, Spain) and analysed at the Serveis Cientificote`cnics of the University of Barcelona (Barcelona, Spain). Sequenced products were joinedin silico using DNAMAN (Lynnon Corpo-ration, Quebec, Canada) to produce contigs with a single open reading frame (ORF). 59RACE-PCR reactions were performed using a 5’RACE System for Rapid Amplification of cDNA Ends (Invitrogen, Alcobendas, Spain) following the manufacturer’s recommendations.
Tissue screening
[image:4.612.61.540.268.685.2]Qualitative RT-PCR was used to analyse calpains transcripts expression in different tissues. Elongation factor 1-alpha (ef1a) was used as a control gene. Reactions were performed in a final volume of 50mL, containing 1mL of first-strand cDNA (equivalent to 4 ng of reverse transcribed total RNA), 1.5U of Taq polymerase (Sigma, Tres Cantos, Spain) and 200 nM (final concentration) of sense and antisense primers (Table S2). Reactions proceeded in a C1000 Thermal Cycler (Bio-Rad, El Prat de Llobregat, Spain) with the following protocol: 1 cycle at 95uC for 5 min, 35 cycles at 95uC for 30 s, 53–61uC (primer dependent, see Table S2) for 30 s, 72uC for 0.5–1.5 min and 1 cycle at 72uC for 7 min. Each reaction product was separated by agarose gel electrophoresis and visualised using SYBR Safe DNA gel stain (Life Technologies, Alcobendas, Spain) in a LAS-3000 (Fujifilm, Madrid, Spain) to confirm that a single product was amplified, and then sequenced to confirm the specificity of each assay.
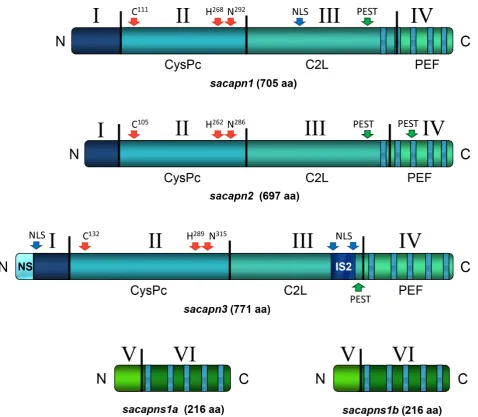
Figure 1. Schematic representation of the gilthead sea bream Calpain peptides’ structural architecture.Domains are identified with roman numbers. CysPc: proteolytic domain, C2L: C2-like domain, and PEF: penta-EF-hand domain. The conserved catalytic residues, nuclear localization signals (NLS) and PEST proteolytic signals are indicated with arrows.
Quantitative real-time PCR
The mRNA transcript levels of gilthead sea bream calpain genes (sacapn1, sacapn2, sacapn3, sacapns1aand sacapns1b), the b protea-some subunit N3 (N3) plus three reference genes (ef1a, beta-actin (b-actin) and ribosomal protein L27a (rpl27a)) were assessed using qPCR across the fasting/re-feeding and diet experiments. Each qPCR reaction contained 5mL of first-strand cDNA (equivalent to 2.5 ng of reverse transcribed total RNA), 10mL of iQ SYBR Green Supermix (Bio-Rad, El Prat de Llobregat, Spain) and 250 nM (final concentration) of sense and antisense primers (Table S3) in a final volume of 20mL. Reactions were performed in triplicate using a MyiQ thermocycler (Bio-Rad, El Prat de Llobregat, Spain) with 1 cycle of 3 min at 95uC and 40 cycles of 10 s at 95uC and 30 s at 56–68uC (primer dependent, see Table S3), followed by an amplicon dissociation analysis from 55 to 95uC at 0.5uC increase each 30 s, where a single peak was observed confirming the specifity of the reaction and the absence of primer-dimers formation. Also, prior to the analyses, a dilution curve with a pool of samples was run to confirm primer efficiency and to determine the appropriate cDNA dilution. SYBR Green fluores-cence was recorded during the annealing-extending phase of cycling. Negative controls (NTC: No Template Control; RTC: no Reverse Transcriptase Control and PCR: water) were included and ran in duplicate. Raw data were normalized tob-actin, the most stable of the three reference genes analysed, by the delta-delta method [33].
Statistical analyses
[image:5.612.58.298.62.691.2]Statistical analyses of all parameters were performed in PASW Statistics 17.0 (IBM, Chicago, USA). Normality was analysed according to the Shapiro-Wilk test and homogeneity in variance according to Levene’s test. Therefore, statistical differences were assessed by one-way ANOVA, followed by Tukey’s test, or t-test.
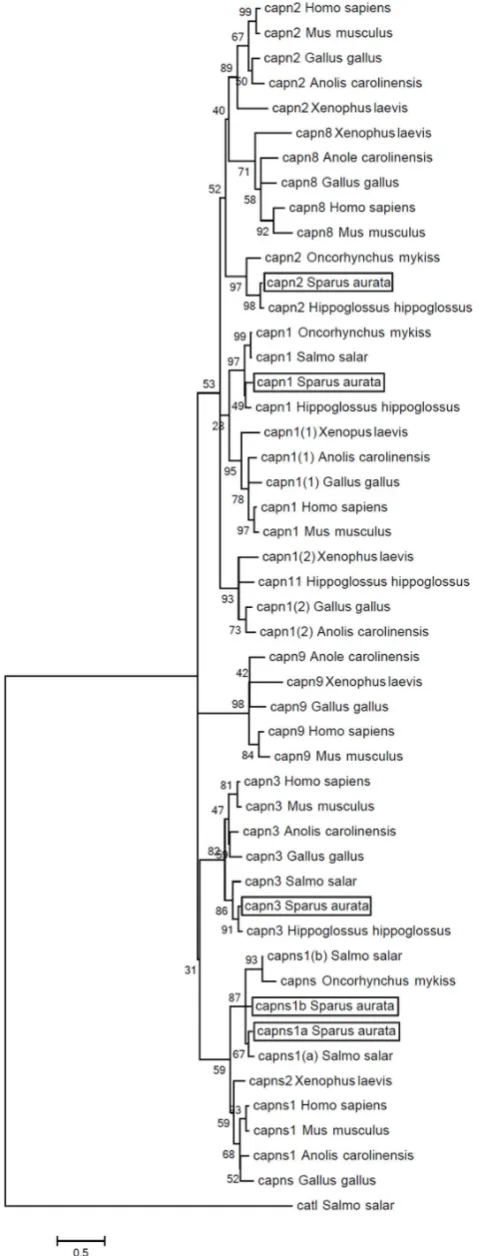
Figure 2. Molecular phylogenetic analysis of the gilthead sea bream Calpain amino acid sequences.A rooted phylogenetic tree of gilthead sea bream (Sparus aurata), Anole lizard (Anolis carolinensis),
chicken (Gallus gallus), Atlantic halibut (Hippoglossus hippoglossus), human (Homo sapiens), mouse (Mus musculus), rainbow trout ( Onco-rhynchus mykiss), Atlantic salmon (Salmo salar) and African clawed frog (Xenopus laevis) Calpain1 (capn1), Calpain2 (capn2), Calpain3 (capn3), Calpain8 (capn8), Calpain9 (capn9), Calpain11 (capn11), and Calpain small subunits 1a and 1b (capns1a and capns1b) orthologs was performed. The Atlantic salmon Cathepsin L, a lysosomal cysteine protease, was used to root the phylogenetic tree. The tree was created by UPGMA method using ClustalW multiple alignment and boot-strapped 1000 times. The scale of the given branch length indicates 0,5 amino acid substitutions per site. Accession numbers were retrieved from public databases: Anolis carolinensis capn1(1) XM_003229570; capn1(2) XM_003215899; capn2 XM_003216038; capn3 XM_003214560; capn8 ENSACAT00000003160; capn9 ENSACAT00000002035 and capns1 XM_003228375;Gallus galluscapn1(1) NM_001044672; capn1(2) NM_205303; capn2 FJ232590; capn3 FJ232591; capn8 EN-SGALT00000015288; capn9 ENSGALT00000018152 and capns AB007824; Hippoglossus hippoglossus capn1 GQ327965; capn2 GQ327966; capn3 GQ327967 and capn11 GQ327964;Homo sapiens
capn1 BC075862; capn2 NM_001748; capn3 BC146649; capn8 N M _ 0 0 1 1 4 3 9 6 2 ; c a p n 9 E N S T 0 0 0 0 0 2 7 1 9 7 1 a n d c a p n s 1 ENST00000246533;Mus musculuscapn1 AF021847; capn2 AF015038; AF127766; capn8 ENSMUST00000048941; capn9 ENSMUST00000093033 and capns1 ENSMUST00000001845; Oncorhynchus mykiss capn1 AY573919; capn2 NM_001124491 and capns NM_001124331; Salmo salar capn1 BT059271; capn3 NM_001165408; capns1(a) BT043754; capns1(b) BT047225 and cathepsin L1 (catl1) NM_001146546;Sparus aurata capn1 (KF444899); capn2 (KF444900); capn3 (ERP000874); capns1a (KF444901) and capns1b (ERP000874); Xenopus laevis
c a p n 1 ( 1 ) N M _ 0 0 1 0 8 7 0 1 6 ; c a p n 1 ( 2 ) N M _ 0 0 1 0 1 3 6 1 3 ; c a p n 2 NM_001090244; capn8 NM_001088543; capn9 NM_001092528 and capns2 BC078469.
Non-parametric tests, Kruskal-Wallis and U de Mann-Whitney, were used when after data transformation normality was not found. A significance of p,0.05 was applied to all statistical tests performed. Data are presented as mean6standard error of the mean (SEM). Correlation analyses were carried out on the dietary experiment data in order to determine whether flesh texture was related to calpains expression, or whether any of the other variables also had an effect. Non-homoscedasticity was found; therefore the Spearman’s rank correlation coefficient (r) was performed. Correlation was considered significant at the bilateral levels of 0.05(*) or 0.01(**).
Bioinformatic resources
Sequences used in the study other than those from gilthead sea bream were obtained from either NCBI (http://www.ncbi.nlm. nih.gov/) or ENSEMBL (http://www.ensembl.org) databases. Human tissue expression patterns of calpains were obtained from the GeneNote database ([34], http://genecards.weizmann.ac.il/ genenote/). BLAST searches were performed against the NCBI non-redundant protein database (http://www.ncbi.nlm.nih.gov/ blast). PSORTII [35] was used to predict nuclear localisation
signals (NLSs) and Reinhardt’s method for Cytoplasmic/Nuclear discrimination ([36], http://psort.hgc.jp/form2.html). Compute pI/Mw tool (ExPASy, Switzerland, http://www.expasy.org/ tools/pi_tool.html) was used to estimate the molecular weight (Mw) of the predicted proteins. In addition, polypeptide sequences rich in Proline (P), Glutamic acid (E), Serine (S) and Threonine (T) (PEST) that mark proteins as targets for rapid destruction were identified using the PEST finding program (http://mobyle. pasteur.fr/cgi-bin/portal.py#forms::epestfind).
[image:6.612.62.407.64.238.2]A phylogenetic tree of 48 complete amino acid sequences of calpain large subunits (Calpains 1, 2, 3, 8, 9 and 11) and small subunits (Calpains 1a and 1b), from different vertebrates was performed. Calpain8, Calpain9 and Calpain11 were included, since these family members form a sister group to Calpain2, Calpain3 and Calpain1, respectively [23], [25], [37]. Calpain sequences were initially aligned using the Mafft v.6 (http://mafft. cbrc.jp/alignment/server/index.html) and G-INS-i (recom-mended for ,200 sequences with global homology) strategy. Evolutionary analyses were conducted in MEGA5 [38]. The evolutionary history was inferred by using the Maximum Likelihood method based on the JTT matrix-based model [39].
Figure 3. Tissue distribution of gilthead sea bream calpains. Qualitative transcript expression profiles of sacapn1, sacapn2, sacapn3,
sacapns1a,sacapns1bandef1a. RTC: No Reverse Transcriptase Control, NTC: No Template Control, BR: Brain, HK: Head kidney, DI: Distal intestine, HE: Heart, PI: Proximal intestine, SK: Skin, BO: Bone, SP: Spleen, GILL, PC: Pyloric caeca, LI: Liver, SM: Slow skeletal muscle, FM: Fast skeletal muscle, ST: Stomach, FAT: adipose tissue. A representative experiment from n = 3 independent fish analysed is shown.
doi:10.1371/journal.pone.0075349.g003
Table 2.Biometrics of gilthead sea bream from the fasting and re-feeding experiment.
Condition4
Body weight (g) Total length (cm) HSI1
MFI2
CF3
D0C 50,7962,13a
15,4060,22 1,1960,08a
0,3560,05a
1,3960,05a
D15C 57,2864,26ab
16,0060,39 1,2560,09a
0,4360,06ab
1,3860,02a
D15F 46,3261,70a
15,2160,18 0,6360,03b
0,3260,04a
1,3160,01a
D30C 61,7762,18b
15,8460,17 1,2460,08a
0,6060,10b
1,5560,04b
D30F 46,9161,98a
15,2060,18 0,5860,06b
0,2960,03a
1,3460,03a
D0F 46,9161,98 15,2060,18 0,5860,06a
0,2960,03 1,3460,03
D7R 47,0762,43 15,1860,32 0,9460,10b
0,3060,04 1,3460,03
D14R 47,0961,52 15,4460,25 0,8960,06b
0,2560,06 1,2960,05
Body weight, total length,1hepatosomatic index [HSI = (Liver weight/Body weight)*100],2mesenteric fat index [MFI = (Adipose weight/Body weight)*100], and
3
condition factor [CF = (Body weight/Total length3
)*100]. Results are shown as mean6SEM (n = 7–8). Different letters (a,b
) indicate significant differences at p,0,05 with fasting and re-feeding periods analysed separately.4
[image:6.612.64.555.562.694.2]The bootstrap consensus tree inferred from 1000 replicates was taken to represent the evolutionary history of the taxa analysed [40], and a discrete Gamma distribution was used to model evolutionary rate differences among invariant sites (G+I). The tree was drawn to scale, with branch lengths measured in the number of substitutions per site. The Atlantic salmon,Salmo salarcathepsin L (NM_001146546), a lysosomal cysteine protease, was used to root the phylogenetic tree.
Results
Calpains characterisation
The cDNA sequences of five distinct gilthead sea bream calpains were obtained using PCR, 5’RACE-PCR and 454 pyrosequencing and deposited in GenBank. BLAST searches were used to examine the identity of these new sequences.
The first complete coding region of 2118 base-pairs (bp) corresponding to a single ORF of 705 amino acids (aa) and a theoretical Mw of 79.9 kDa, returned highest BLAST scores to calpain1 sequences, showing 68% and 86% identity with human (Homo sapiens) and Atlantic salmon capn1, respectively; therefore, it was namedsacapn1(accession number: KF444899) (Figure S1). A 2094 bp contig, coding a 697 aa protein with a Mw 78.2 kDa, showed 63% and 90% identity with mouse and Atlantic halibut capn2, respectively, and it was namedsacapn2(accession number: KF444900) (Figure S2). Next, a 2316 bp contig, with a single ORF of 771 aa and 89.1 kDa Mw, showed 66% identity with mouse and 86% identity with halibut capn3 and was named sacapn3
(accession number: ERP000874) (Figure S3).
Regarding the regulatory calpains, two 651 bp contigs, with single ORFs of 216 aa and theoretical Mw of 24.6 and 24.7 kDa, respectively, returned highest BLAST scores to calpain small subunit1 sequences. The first one showed 82% and 88% identity with zebrafish (NM_001017899.2) and Atlantic salmon (BT043754.1) capns1a and capns1, respectively and it was named
sacapns1a(accession number: KF444901) (Figure S4). The second sequence showed 72% and 75% identity with Atlantic salmon (BT047225.1) and zebrafish (BC162479.1) capns1 and capns1b, respectively, indicating it was a sacapns1 paralog in gilthead sea bream; and thus it was named sacapns1b (accession number: ERP000874) (Figure S5).
The calpain domain architecture was identified in all five gilthead sea bream calpain peptides (Figure 1). Sacapn1 and Sacapn2 contained four domains (D): DI or the N-terminal anchor helix region, DII or the CysPc protease domain, DIII or the C2-like domain (C2L), and DIV or the penta-EF-hand domain (PEF) (Figures S1 and S2). Also, two additional regions were present in Sacapn3: the teleost N-terminal sequence (NS) and an insertion sequence (IS2) (Figure S3). The characteristic triad of catalytic residues, the potential PEST proteolytic signals that target proteins for rapid destruction and the nuclear localization signal (NLS) were also identified. Both paralogs of the regulatory calpain, Sacapns1a and Sacapns1b, contained two domains: DV and DVI or PEF domain (Figures S4 and S5). Finally, analysis of the calpain amino acid sequences using the PSORTII program predicted that all were cytoplasmic proteins.
Phylogenetic analysis
A phylogenetic tree including 48 calpain sequences from different vertebrates, and an Atlantic salmon Cathepsin L sequence, was performed (Figure 2). The calpain cluster was divided into two main groups, one including the calpain large subunits (Capn1, Capn2, Capn8 and Capn11) and the second containing Capn3 and the calpain small regulatory subunits
(Capns1a and Capns1b), whereas Capn9 formed a separated clade. Each putative gilthead sea bream calpain sequence was related to the corresponding calpain teleost ortholog, with both Capns paralogs forming two different sister clades.
Tissue expression
Conventional RT-PCR was used to determine the mRNA expression of each gilthead sea bream calpain identified in 15 different tissues (Figure 3). Transcripts ofsacapn1,sacapn2,sacapns1a
andsacapns1b, were detected to a greater or lesser extent in each one of the 15 tissues examined. On the other hand, transcripts for
sacapn3were detected preferentially in tissues containing striated muscle fibres, including fast and slow skeletal muscle and heart (Figure 3).
Fasting/re-feeding experiment
Calpain gene expression was analysed in fast skeletal muscle of gilthead sea bream subjected to a fasting/re-feeding experiment. Fasting for 15 days caused a minor reduction in body mass and MFI, but decreased significantly HSI. During the same period, a significant increase was observed in body weight and MFI in the control group (Table 2). Again after 7 days of re-feeding the increase in body mass and MFI was not significant, although it was for HSI (Table 2).
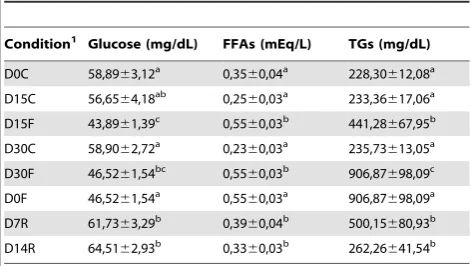
As expected, plasmatic glucose was significantly reduced, while FFAs and TGs were significantly increased after 15 and 30 days of fasting (Table 3). In re-fed fish significantly elevated plasma glucose and reduced FFAs and TGs were observed (Table 3). In relation to muscle colour, no clear changes were observed during fasting for any of the parameters analysed; however, re-feeding significantly increased lightness (L*) and decreased a* and b* components towards green and blue intensities, respectively (Table S4).
Interestingly, fish fasted for 15 and 30 days presented a significant increase in sacapns1b expression, whereas the other calpains remained unchanged (Figure 4). Moreover, re-fed fish after 14 days had significantly decreased expression of sacapn1,
[image:7.612.319.555.562.695.2]sacapn2,sacapns1aandsacapns1b; and also a significant decrease was observed already at 7 days after re-feeding in the expression of the proteolysis marker of the proteasome,N3(Figure 5).
Table 3. Plasma parameters of gilthead sea bream from the fasting and re-feeding experiment.
Condition1
Glucose (mg/dL) FFAs (mEq/L) TGs (mg/dL)
D0C 58,8963,12a
0,3560,04a
228,30612,08a
D15C 56,6564,18ab
0,2560,03a
233,36617,06a
D15F 43,8961,39c
0,5560,03b
441,28667,95b
D30C 58,9062,72a
0,2360,03a
235,73613,05a
D30F 46,5261,54bc
0,5560,03b
906,87698,09c
D0F 46,5261,54a
0,5560,03a
906,87698,09a
D7R 61,7363,29b
0,3960,04b
500,15680,93b
D14R 64,5162,93b
0,3360,03b
262,26641,54b
Results are shown as mean6SEM (n = 7–8). Different letters (a,b,c
) indicate significant differences at p,0,05 with fasting and re-feeding periods analysed separately.1
Diet experiment
Then, we analysed whether the gilthead sea bream calpain genes identified were transcriptionally regulated according to the different percentages of dietary protein and CH (Table 1) on fast-twitch skeletal muscle. Finally, we evaluated if the expression of any of the calpains correlated with muscle texture. At the end of the experiment, no significant differences were found in SGR between the 46% protein groups (46/11 and 46/19). Nevertheless, differences were found respect fish fed the diets with 46% protein and those fed the other diets (Table 4). Also, significant differences were observed between fish fed the 42/35 and 40/39 diets, with
[image:8.612.59.453.56.558.2]the fish fed the 40/39 diet showing the smallest SGR. In addition, no significant differences in FCR between diets 46/11 and 42/35 were found; however, besides all groups had equal feed intake, differences were found between those two and the other groups (Table 4). Interestingly, the fish fed the diet 46/19 had the best FCR values, and the fish fed the 40/39 diet, the worst. Moreover, the fish fed with the diet 46/11 (with the lowest amount of CH), showed the highest final body weight and total length, which was significantly different with respect to fish fed with 42/35 and 40/ 39 diets, and showed significantly the lowest HSI value in comparison to the diets with higher amounts of CH (Table 5). The
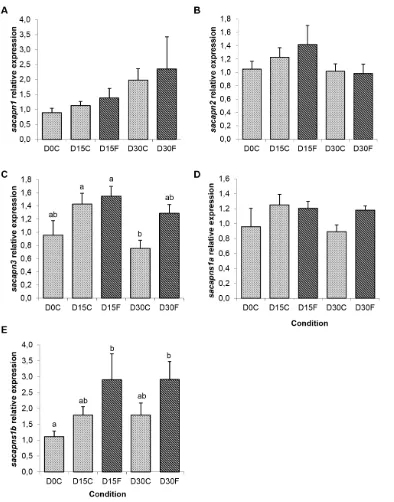
Figure 4. Calpains relative expression in gilthead sea bream from the fasting experiment.Quantitative expression relative tob-actinof (A)sacapn1, (B)sacapn2, (C) sacapn3, (D)sacapns1a and (E)sacapns1b. Results are shown as mean6SEM (n = 5–8). Different letters indicate significant differences at p,0,05. C: control fed fish, F: fasted fish.
fish fed with the diet 40/39, showed the lowest MFI followed by those fed the diets 46/19 and 42/35, and showed the lowest CF, significantly different with respect to the fish fed the diet 46/19.
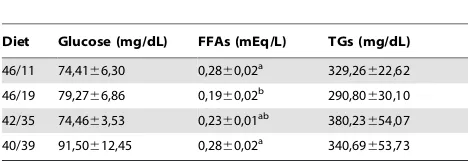
Plasma parameters, glucose and TGs were not significantly affected by diet composition. On the other hand, FFAs were significantly lower in the fish fed the 46/19 diet compared to the 46/11 and 40/39 groups (Table 6). Also, colour measurement of the dorsal muscle did not show any significant differences between groups (Table S5).
The fish fed the 46/11 diet, showed significantly lower values in maximal strength and elasticity, while the diet 40/39 was associated with maximal values of both parameters and a firmer
flesh. Total work showed a trend to increase with reduced dietary protein content, but the differences were not statistically significant (Figure 6). Fish fed the 46/11 diet had the highest relative expression ofsacapn1andsacapns1a, while the diets 40/39 and 42/ 35 showed significantly lower values (Figure 7). The same decreasing trend was observed for sacapn2 expression concomi-tantly with the increase of dietary CH, although no significant differences were found.
[image:9.612.63.411.53.543.2]To better understand the possible relationship between calpains gene expression and flesh texture, correlations between these different parameters were performed. Significant Spearman r values of negative correlation were found between maximal
Figure 5. Calpains relative expression in gilthead sea bream from the re-feeding experiment.Quantitative expression relative tob-actin of (A)sacapn1, (B)sacapn2, (C)sacapn3, (D)sacapns1a, (E)sacapns1band (F)N3. Results are shown as mean6SEM (n = 5–8). Different letters indicate significant differences at p,0,05. F: fasted fish, R: re-fed fish.
strength andsacapn1as well assacapns1aexpression (r= –0.409* and r= –0.449*, respectively). Regarding calpain expression, significant positive correlations were observed between: sacapn1
and sacapn2 (r= 0.414*), sacapn1 and sacapns1a (r= 0.814**),
sacapn2 and sacapns1b (r= 0.592**), sacapn3 and sacapns1a
(r= 0.455*) andsacapns1aandsacapns1b(r= 0.489*).
Discussion
Calpains characterisation
In the present study, several members of the calpain system have been characterised for the first time in gilthead sea bream (Sparus aurata) fast-twitch skeletal muscle. The typical calpain domain architecture was identified in all five gilthead sea bream calpains, in which the triad of catalytic residues common to all calpains was in each case highly conserved in comparison to vertebrates [19]. In agreement with Atlantic halibut [22], Sacapn3 lacks the IS1 domain present in tetrapods at the C-terminal region of DII [41], which altogether with NS and IS2 has to be autocatalytically removed for Calpain3 to become proteolitically active [42]. Regarding the regulatory subunits, in the N-terminal region of DV there is missing the Gly-rich and hydrophobic region characteristic of mammalian calpain small subunits that plays a role in membrane targeting, which was previously described absent in rainbow trout calpain small subunit [43] and in zebrafish calpain small 2-like [23], suggesting divergent function and activation mechanisms of the fish calpain system compared to mammals.
Phylogenetic analysis
To further characterise the gilthead sea bream calpains, a phylogenetic tree was constructed. Importantly, each putative gilthead sea bream calpain sequence was related to the corresponding teleost ortholog as expected, as well as with its tetrapod ortholog with the exception of Calpain2. The teleost Calpain2 group formed a monophyletic clade external to the tetrapod Calpain2/8 sister group; thus, supporting the hypothesis that they are a close related group (i.e. Calpain2-like) and the common ancestor of vertebrate Calpains2/8 [23], [25]. These phylogenetic data together with conserved protein structure support a similar role for these proteinases in muscle tenderisation.
Tissue expression
Next, qualitative RT-PCR was used to identify the distinct tissue expression of each gilthead sea bream calpain. Transcripts of
sacapn1, sacapn2, sacapns1a and sacapns1b, were ubiquitously expressed as observed in rainbow trout [21], [43], Atlantic halibut
[22], rabbits [44] or humans ([16], for instance. Furthermore as in mammals, wherecalpain3is principally expressed in skeletal muscle [41], regulating protein turnover and maintaining the sarcomere integrity [45], thesacapn3transcripts were mostly detected in fast-and slow-twitch skeletal muscle, but also in the heart. Moreover,
sacapn3was also expressed to a lesser extent in other tissue types as previously reported in Atlantic halibut [25]; thus, suggesting a possible broader physiological role for Calpain3 in teleosts in comparison to mammals.
Effects of nutritional status
In the wild, many fish species including gilthead sea bream are adapted to long-term food deprivation. In response to fasting, fish mobilize energy materials stored in their tissues, and after long periods, when more readily available energy sources have been exhausted, skeletal muscle proteins can be also mobilized resulting in muscle atrophy [46]. On the other hand, in anabolic situations, food intake stimulates the synthesis of new proteins, and to a lesser extent, also its degradation to induce protein turnover and growth. Morphological and plasma parameters in fasted fish confirmed the catabolic state. Sacapns1b expression significantly increased after 15 days of fasting, while sacapn1, sacapn2, sacapn3 and
[image:10.612.315.556.89.178.2]sacapns1aexpression remained unaffected. In a previous study in rainbow trout, fasting for 35 days significantly stimulated the expression ofcalpain1andcalpain2, but not that of the calpain small subunit [21]. In Atlantic halibut,calpain1but notcalpain2was up-regulated after 60 days of fasting [22], and the contrary occurred in channel catfish, where 35 days of fasting increased calpain2, while decreasedcalpain1expression [24]. After re-feeding, signif-icant increases were observed in HSI and plasma parameters returned to normal values. Changes in muscle colour indicated an
Table 4.Standard growth rate (SGR), feed intake and feed conversion rate (FCR) of gilthead sea bream fed the four experimental diets.
Diet SGR1
Feed intake (g) FCR2
46/11 1,1460,01a
109616593 1,6160,07a
46/19 1,1360,03a
90996553 1,3860,14b
42/35 1,0560,02b
101576356 1,7360,06a
40/39 0,9560,01c
106976273 2,1560,02c
1
Standard growth rate [SGR = (ln final weight (lnWf)-ln initial weight (lnWi))*100/
time], [feed intake = feed offered-feed refused] and2feed conversion rate [FCR = dry feed intake/wet weight gain]. Results are shown as mean6SEM (n = 51). Different letters (a,b,c
[image:10.612.64.297.101.181.2]) indicate significant differences at p,0,05. doi:10.1371/journal.pone.0075349.t004
Table 5.Biometrics of gilthead sea bream fed the four experimental diets.
Diet
Body weight (g)
Total length
(cm) HSI1
MFI2
CF3
46/11 419,44612,65a
24,0160,23a
1,2460,03a
1,0660,12ab
3,0360,07ab
46/19 396,78615,69ab
23,1660,19b
1,7360,12b
1,3260,20a
3,1960,11a
42/35 363,1068,64b
23,0660,12b
2,1260,12b
1,2760,12a
2,9660,07ab
40/39 271,7067,11c
21,1460,21c
1,9360,18b
0,7060,09b
2,8360,04b
Body weight, total length,1
hepatosomatic index [HSI = (Liver weight/Body weight)*100],2
mesenteric fat index [MFI = (Adipose weight/Body weight)*100], and3
condition factor [CF = (Body weight/Total length3
)*100]. Results are shown as mean6SEM (n = 8–9). Different letters (a,b,c
) indicate significant differences at p,0,05.
doi:10.1371/journal.pone.0075349.t005
Table 6.Plasma parameters of gilthead sea bream fed the four experimental diets.
Diet Glucose (mg/dL) FFAs (mEq/L) TGs (mg/dL)
46/11 74,4166,30 0,2860,02a
329,26622,62
46/19 79,2766,86 0,1960,02b
290,80630,10
42/35 74,4663,53 0,2360,01ab
380,23654,07
40/39 91,50612,45 0,2860,02a
340,69653,73
Results are shown as mean6SEM (n = 8–9). Different letters (a,b
) indicate significant differences at p,0,05.
[image:10.612.320.555.621.702.2]increase in lightness during re-feeding, which may be attributed to an increase in lipid content as previously reported [29]. Furthermore, sacapn3 was again unchanged but the relative expression of sacapn1, sacapn2, sacapns1a and sacapns1b was significantly reduced, suggesting a decrease in muscle proteolysis under these conditions, a result supported by the significant decrease observed during re-feeding of the subunit b of the proteasomeN3, previously used in other studies as a proteolysis marker [47], [48]. These results were in agreement with the study
in Atlantic halibut, where it was also observed that after 7 days of re-feeding, fish that were fasted for 60 days hadcalpain1transcript levels significantly decreased, but no differences were observed in
calpain2expression, whereas a significant increase incalpain3was found [22]. In addition, in a recent study in gilthead sea bream fasted for 4 days,calpain3expression also increased 5–6 fold 24 h after re-feeding and was maintained until 6 days later [49].
Overall, these data suggests that the regulation of calpain expression with fasting and re-feeding is species-specific. In our study,sacapns1bexpression was sensitive to fasting and re-feeding increasing and decreasing respectively, suggesting this calpain could be a potential marker to identify nutritional status in gilthead sea bream.
Effects of diet composition
In their natural diet, gilthead sea bream feed mainly on molluscs and crustaceans, but the presence of algae is common in its intestinal contents. This indicates that gilthead sea bream can use vegetables, rich in CH and fibre, as an energy source. Previous studies on gilthead sea bream have shown that it is not advisable to exceed 20% of CH in their diet, due to a persistent postprandial hyperglycemia, that can finally decrease growth [50]. In the present study, isolipidic diets with different percentages of protein and CH were used to determine if it is possible to increase CH over the limit of 20% without affecting growth, but more interestingly, to see if calpain relative expression could be related to muscle texture, a parameter that can be modulated according to dietary treatment. Interestingly, although no differences were observed in feed intake or plasma glucose between groups, gilthead sea bream showed decreased growth parallel to the amount of protein in the diet. Fish fed diets 42/35 and 40/39 obtained significantly lower SGR and final body weight values compared to the fish fed the other diets (46/11 and 46/19). These results are in agreement with a previous study [50] and support the limited value of 20% CH dietary inclusion to achieve good growth rates in this species.
Texture analysis showed that in diets with 46% of protein, increasing CH levels up to 19% improved significantly flesh maximal strength; and an increase up to 35%, with a reduction of protein from 46 to 40%, elevated also significantly flesh elasticity. In previous studies in Dentex dentex it was also observed that a decrease in dietary protein content from 43 to 38% improved textural parameters as firmness and water holding; however, it was observed that within each dietary protein level, diets with high CH and low lipid content resulted in lower values of muscle firmness than diets with low CH [51]. Therefore, this is the first study in
Sparidswhere an increase in dietary CH seems to improve textural parameters.
Sacapn1andsacapns1awere transcriptionally affected by the diet, whilesacapn2, sacapns1band sacapn3 remained unaffected. Both,
sacapn1 and sacapns1a relative expression decreased with dietary CH increase and protein decrease, suggesting a reduction in muscle proteolysis and an increase in muscle texture in these fish. In agreement with this observation,calpain1 mRNA levels were significantly lower in pigs fed a protein-free diet in comparison to control pigs [52]. In rainbow trout, it was observed that the level of
[image:11.612.58.295.56.555.2]cathepsin Dexpression in fast muscle increased by substitution of dietary fishmeal by a mix of plant protein sources, butcalpain2was not modified [6]. Using different rainbow trout strains with distinct growth rates and fillet firmness and fed with two different energy diets, Salemetal., [26] reported that strain or diet did not affect the level of mRNAs expression for any of the calpain members analysed; however, significantly lower calpastatin expression was observed in the strain with softest fillet. These results suggest that
Figure 6. Fast skeletal muscle texture analysis.(A) total work, (B) maximal strength and (C) elasticity of gilthead sea bream fed the four experimental diets. Results are shown as mean 6 SEM (n = 5–8). Different letters indicate significant differences at p,0,05.
the effects of diet on calpain expression show significant variation between fish species.
To further investigate the importance of the different gilthead sea bream calpains in flesh firmness, correlation analysis between texture parameters and calpains expression was performed. Interestingly,sacapn1andsacapns1arelative expression levels were significantly negatively correlated with maximal strength in our study. In mice,calpain1knockout animals had significantly reduced proteolysis in comparison to control mice [53]. Also, other studies in mammals have supported that calpain1, but not calpain2, is primarily responsible for meat tenderisation in beef and lamb [54],
[55]; and in cattle, single nucleotide polymorphisms (SNPs) for the
calpain1gene have been clearly associated with tenderness [56]. This has currently led to the use of markers within thecalpain1as well as thecalpastatingene to identify the genetic potential of beef cattle to produce tender meat [57], a tool that is commercially available as a genetic test (GeneSTAR, Pfizer Genetics). The present results have revealed the potential use of calpains,sacapn1
andsacapns1a, as candidate genes to monitor muscle growth and fillet firmness in gilthead sea bream.
[image:12.612.63.468.54.556.2]In addition, sacapn1 and sacapn2 relative expression was significantly positively correlated, as both genes followed the same
Figure 7. Calpains relative expression in gilthead sea bream fed the four experimental diets.Quantitative expression relative tob-actin
of (A)sacapn1, (B)sacapn2, (C)sacapn3, (D)sacapns1aand (E)sacapns1b. Results are shown as mean6SEM (n = 6–8). Different letters indicate significant differences at p,0,05.
trend and decreased expression with an increased CH:protein ratio in the diet. A significant positive correlation between both
sacapns paralogs was also found. Furthermore, the expression of small subunit paralogs,sacapns1aandsacapns1b, revealed also that each paralog was significantly correlated with each one of the catalytic calpains (sacapns1a with sacapn1 and sacapns1b with
sacapn2). Contrary to what it is observed in mammals, where the different catalytic calpains bind a common regulatory subunit to be fully active [19], the present data suggests that the genome duplication that occurred in the teleost lineage resulted in each fish catalytic calpain binding to a specific calpain regulatory subunit paralog. In order to confirm this hypothesis, further studies at the protein level will be required.
Finally, a significant positive correlation was found between the expression of paralogsacapns1bandsacapn3, suggesting a different regulation for calpain3 activity in fish, because in mammals, the recombinant PEF domain of Calpain3 is known to form a stable homodimer, but it is believed not to form a heterodimer with the calpain small subunit [58]. Moreover, the muscle-specificcalpain3
did not show differences in response to dietary treatment and did not correlate with muscle texture. In mammals, a strong correlation has been shown between calpain3 mRNA levels and tenderness in cattle and sheep, whereas no correlation was reported in pigs [59], [60]. Also, it has been shown that Calpain3 can cleave calpastatin and the ubiquitous calpains, suggesting a role for calpain3 as an endogenous regulator of calpain expression and proteolytic activity [61]; thus indicating calpain3 deserves further attention in future studies in fish.
In summary, the present data has shown that several gilthead sea bream calpains are expressed in tissues with a distribution similar to that of calpains already described in other fish species as well as in mammals. We have also shown for the first time in teleosts the presence of two paralogs of the calpain small subunit (sacapns1aandsacapns1b) and the data has suggested that they are differently activated; sacapns1b with fasting and sacapns1a with changes in diet composition. Furthermore, the present results suggested that the expression of each paralog may be related to the expression of a corresponding catalytic subunit (sacapns1a with
sacapn1andsacapns1bwithsacapn2). Finally, we can conclude that the expression of some gilthead sea bream calpain genes, such as
sacapn1and sacapns1a, may serve as potential genetic markers of flesh quality in this species.
Supporting Information
Figure S1 Complete ORF and deduced amino acid sequence of gilthead sea bream calpain1 (sacapn1). The initiation and stop codons are shown in bold. The conserved catalytic residues are boxed and underlined. q Indicates the boundaries of domains. The nuclear localization signal (NLS) is boxed in black. PEST proteolytic signal is boxed in grey. The penta-EF-hand (PEF) sequences are underlined.
(DOCX)
Figure S2 Complete ORF and deduced amino acid sequence of gilthead sea bream calpain2 (sacapn2). The initiation and stop codons are shown in bold. The conserved catalytic residues are boxed and underlined. q Indicates the boundaries of domains. PEST proteolytic signals are boxed in grey. The penta-EF-hand (PEF) sequences are underlined. (DOCX)
Figure S3 Complete ORF and deduced amino acid sequence of gilthead sea bream calpain3 (sacapn3). The initiation and stop codons are shown in bold. The teleost
N-terminal sequence (NS) is shown in italics and underlined. Inserted sequence IS2 is shown in italics and boxed in pale grey. The conserved catalytic residues are boxed and underlined. q
Indicates the boundaries of domains. The nuclear localization signals (NLS) are boxed in black. PEST proteolytic signal is boxed in dark grey. The penta-EF-hand (PEF) sequences are underlined. (DOCX)
Figure S4 Complete ORF and deduced amino acid sequence of gilthead sea bream calpain small subunit1a (sacapns1a).The initiation and stop codons are shown in bold.
qIndicates the boundaries of domains. The penta-EF-hand (PEF) sequences are underlined.
(DOCX)
Figure S5 Complete ORF and deduced amino acid sequence of gilthead sea bream calpain small subunit1b (sacapns1b).The initiation and stop codons are shown in bold.
qIndicates the boundaries of domains. The penta-EF-hand (PEF) sequences are underlined.
(DOCX)
Table S1 Calpains primer sequences used for cloning by RT-PCR and 5’ RACE-PCR.
(DOCX)
Table S2 Calpains primer sequences used for tissue screening by RT-PCR.
(DOCX)
Table S3 Calpains primer sequences used for qPCR. (DOCX)
Table S4 Colour of gilthead sea bream muscle from the fasting and re-feeding experiment. Colour measurements were performed on fast skeletal muscle from the antero-dorsal region. Colour is expressed using the L* (lightness), a* (red/green) and b* (yellow/blue) system. Results are shown as mean6SEM (n = 7–8). Different letters indicate significant differences at p,0,05 with fasting and re-feeding periods analysed separately. C: control fed fish, F: fasted fish, R: re-fed fish.
(DOCX)
Table S5 Colour of gilthead sea bream muscle fed the four experimental diets. Colour measurements were per-formed on fast skeletal muscle from the antero-dorsal region. Colour is expressed using the L* (lightness), a* (red/green) and b* (yellow/blue) system. Results are shown as mean6SEM (n = 7– 9). No significant differences were observed at p,0,05.
(DOCX)
Acknowledgments
The authors would like to thank Dr. Tom Ashton and Dr. Neil Bower for their assistance in the cloning and Dr. Isabel Achaerandio for her help with the texture and colour analyses. We thank Carlos Mazorra from Tinamenor S.L. (Pesue´s, Spain) for the gilthead sea bream used in the fasting/re-feeding and tissue screening studies and the personnel from the animal facilities in the Faculty of Biology for its maintenance. We also thank M. Monllao´, S. Molas, and E. Herna´ndez from the Institut de Recerca i Tecnologia Agroalimenta`ries de Sant Carles de la Ra`pita (Spain) for the maintenance of the gilthead sea bream from the diet experiment as well as their assistance during samplings.
Author Contributions
References
1. APROMAR (2012) La Acuicultura Marina de Peces en Espan˜a 2012. Ministerio de Medio Ambiente y Medio Rural y Marino. Madrid.
2. Fauconneau B, Chmaitilly J, Andre S, Cardinal M, Cornet J, et al. (1993) Characteristics of rainbow trout flesh: I. Chemical composition and cellularity of muscle and adipose tissues. Sci Aliment 13: 173–187.
3. Hurling R, Rodell JB, Hunt HD (1996) Fibre diameter and fish texture. J Texture Stud 27: 679–685.
4. Kiessling A, Storebakken T, A˚ sga˚rd T, Kiessling K-H (1991) Changes in the structure and function of the epaxial muscle of rainbow trout (Oncorhynchus mykiss) in relation to ration and age: I. Growth dynamics. Aquaculture 93: 335–356. 5. Johnston IA, Manthri S, Alderson R, Campbell P, Mitchell D, et al. (2002)
Effects of dietary protein level on muscle cellularity and flesh quality in Atlantic salmon with particular reference to gaping. Aquaculture 210: 259–283. 6. Alami-Durante H, Me´dale F, Cluzeaud M, Kaushik SJ (2010) Skeletal muscle
growth dynamics and expression of related genes in white and red muscles of rainbow trout fed diets with graded levels of a mixture of plant protein sources as substitutes for fishmeal. Aquaculture 303: 50–58.
7. Johnston IA, Manthri S, Bickerdike R, Dingwall A, Luijkx R, et al. (2004) Growth performance, muscle structure and flesh quality in out-of-season Atlantic salmon (Salmo salar) smolts reared under two different photoperiod regimes. Aquaculture 237: 281–300.
8. Nathanailides C, Lopez-Albors O, Abellan E, Vazquer JM, Tyler DD, et al. (1996) Muscle cellularity in relation to somatic growth in the European sea bass Dicentrarchus labrax(L.). Aquacult Res 27: 885–889.
9. Johnston IA, Cole NJ, Abercromby M, Vieira VLA (1998) Embryonic temperature modulates muscle growth characteristics in larval and juvenile herring (Clupea harengus). J Exp Biol 201: 623–646.
10. Lo´pez-Albors O, Abdel I, Periago MJ, Ayala MD, Alca´zar AG, et al. (2008) Temperature influence on the white muscle growth dynamics of the sea bass Dicentrarchus labraxL. Flesh quality implications at commercial size. Aquaculture 277: 39–51.
11. Johnston IA, Moon TW (1980) Endurance exercise training in the fast and slow muscles of a teleost fish (Pollachius virens). J Comp Physiol 135: 147–156. 12. Totland GK, Kryvi H, Jødestol KA, Christiansen EN, Tangera˚s A, et al. (1987)
Growth and composition of the swimming muscle of adult Atlantic salmon (Salmo salarL.) during long-term sustained swimming. Aquaculture 66: 299–313. 13. Martin CI, Johnston IA (2005) The role of myostatin and the calcineurin
signalling pathway in regulating muscle mass in response to exercise training in the rainbow troutOncorhynchus mykissWalbaum. J Exp Biol 208: 2083–2090. 14. Ibarz T, Felip O, Ferna´ndez-Borra`s J, Martı´n-Pe´rez M, Blasco J, et al. (2011)
Sustained swimming improves muscle growth and cellularity in gilthead sea bream. J Comp Physiol 81: 209–217.
15. Nagaraj NS, Santhanam K (2006) Effects of muscle proteases, endogenous protease inhibitors and myofibrils fragmentation on postmortem aging of goat meat. J Food Biochem 30: 269–291.
16. Ono Y, Sorimachi H (2012) Calpains- an elaborate proteolytic system. Biochim Biophys Acta 1824: 224–236.
17. Dutt P, Croall DE, Arthur JSC, DeVeyra T, Williams K, et al. (2006) m-Calpain is required for preimplantation embryonic development in mice. BMC Dev Biol 6: 3.
18. Richard I, Broux O, Allamand V, Fougerousse F, Chiannilkulchai N, et al. (1995) Mutations in the proteolytic enzyme calpain 3 cause limb-girdle muscular dystrophy type 2A. Cell 81: 27–40.
19. Goll DE, Thompson VF, Li H, Wei W, Cong J (2003) The calpain system. Physiol Rev 83: 731–801.
20. Kemp CM, Sensky PL, Bardsley RG, Buttery PJ, Parr T (2010) Tenderness – An enzymatic view. Meat Sci 84: 248–256.
21. Salem M, Nath J, Rexroad CE, Killefer J, Yao J (2005) Identification and molecular characterization of the rainbow trout calpains (Capn1 and Capn2): their expression in muscle wasting during starvation. Comp Biochem Physiol B Biochem Mol Biol 140: 63–71.
22. Macqueen DJ, Meischke L, Manthri S, Anwar A, Solberg C, et al. (2010) Characterisation of capn1, capn2-like, capn3 and capn11 genes in Atlantic halibut (Hippoglossus hippoglossusL.): transcriptional regulation across tissues and in skeletal muscle at distinc nutritional states. Gene 453: 45–58.
23. Lepage SE, Bruce AE (2008) Characterization and comparative expression of zebrafish calpain system genes during early development. Dev Dyn 237: 819– 829.
24. Preziosa E, Liu S, Terova G, Gao X, Liu H, et al. (2013) Effect of nutrient restriction and re-feeding on calpain family genes in skeletal muscle of channel catfish (Ictalurus punctatus). PLoS ONE 8: e59404.
25. Macqueen DJ, Delbridge ML, Manthri S, Johnston IA (2010) A newly classified vertebrate calpain protease, directly ancestral to CAPN1 and 2, episodically evolved a restricted physiological function in placental mammals. Mol Biol Evol 27: 1886–1902.
26. Salem M, Yao J, Rexroad CE, Kenney PB, Semmens K, et al. (2005) Characterization of calpastatin gene in fish: its potential role in muscle growth and fillet quality. Comp Biochem Physiol B Biochem Mol Biol 141: 488–497. 27. Bonnal C, Raynaud F, Astier F, Lebart MC, Marcilhac A, et al. (2001)
Postmortem degradation of white fish skeletal muscle sea bass, (Dicentrarchus
labrax): fat diet effects on in situ dystrophin proteolysis during the prerigor stage. Mar Biotech 3: 172–180.
28. Hunter R, Harold RW (1987) The measurement of appearance (2nd edition). New York: Wiley-Inter-science. 411 p.
29. Grigorakis K, Taylor KDA, Alexis MN (2003) Organoleptic and volatile aroma compounds comparison of wild and cultured gilthead sea bream: sensory differences and possible chemical basis. Aquaculture 225: 109–119.
30. Valente LMP, Cornet J, Donnay-Moreno C, Gouygou JP, Berge´ JP, et al. (2011) Quality differences of gilthead sea bream from distinct production systems in Southern Europe: Intensive, integrated, semi-intensive or extensive systems. Food Control 22: 708–717.
31. Chomczynski P, Sacchi N (2006) The single-step method of RNA isolation by acid guanidinium thiucyanate-phenol-chloroform extraction: twenty-something years on. Nat Protoc 1: 581–585.
32. Garcı´a de la Serrana D, Estevez A, Andree K, Johnston IA (2012) Fast skeletal muscle transcriptome of the gilthead sea bream (Sparus aurata) determined by next generation sequencing. BMC Genomics 13: 181.
33. Livak KJ, Schmittgen TD (2001) Analysis of relative gene expression data using realtime quantitative PCR and the 2(-delta delta C(T)) method. Methods 25: 402–408.
34. Shmueli O, Horn-Saban S, Chalifa-Caspi V, Shmoish M, Ophir R, et al. (2003) GeneNote: whole genome expression profiles in normal human tissues. C R Biol 326: 1067–1072.
35. Nakai K, Horton P (1999) PSORT: A program for detecting sorting signals in proteins and predicting their subcellular localization. Trends Biochem Sci 24: 34–35.
36. Reinhardt A, Hubbard T (1998) Using neural networks for prediction of the subcellular location of proteins. Nucl Acids Res 26: 2230–2236.
37. Je´kely G, Friedrich P (1999) The evolution of the calpain family as reflected in paralogous chromosome regions. J Mol Evol 49: 272–281.
38. Tamura K, Peterson D, Peterson N, Stecher G, Nei M, et al. (2011) MEGA5: molecular evolutionary genetics analysis using maximum likelihood, evolution-ary distance, and maximum parsimony methods. Mol Biol Evol 28: 2731–2739. 39. Jones DT, Taylor WR, Thornton JM (1992) The rapid generation of mutation
data matrices from protein sequences. Comput Appl Biosci 8: 275–282. 40. Felsenstein J (1985) Confidence limits on phylogenies: An approach using the
bootstrap. Evolution 39: 783–791.
41. Sorimachi H, Imajoh-Ohmi S, Emori Y, Kawasaki H, Ohno S, et al. (1989) Molecular cloning of a novel mammalian calcium dependent protease distinc from m- andm-types. Specific expression of the mRNA in skeletal muscle. J Biol Chem 264: 20106–20111.
42. de Morree A, Lutje Hulsik D, Impagliazzo A, van Haagen HHHBM, de Galan P, et al. (2010) Calpain 3 is a rapid-action, unidirectional proteolytic switch central to muscle remodeling. PLoS ONE 5: e11940.
43. Salem M, Nath J, Killefer J (2004) Cloning of the calpain regulatory subunit cDNA from fish reveals divergent domain-v. Anim Biotechnol 15: 145–157. 44. Emori Y, Kawasaki H, Imajoh S, Kawashima S, Suzuki K (1986) Isolation and
sequence analysis of cDNA clones for the small subunit of rabbit calcium-dependent protease. J Biol Chem 261: 9472–9476.
45. Beckmann JS, Spencer M (2008) Calpain 3, the ‘‘gatekeeper’’ of proper sarcomere assembly, turnover and maintenance. Neuromuscul Disord 18: 913– 921.
46. Navarro I, Gutierrez J (1995) Fasting and starvation. In: Hochachka PW, Mommsen TP editors. Biochemistry and Molecular Biology of Fishes, vol. 4. Elsevier Science BV. pp. 393–434.
47. Martin SAM, Blaney S, Bowman AS, Houlihan DF (2002) Ubiquitin-proteasome-dependent proteolysis in rainbow trout (Oncorhynchus mykiss): effect of food deprivation. Eur. J. Physiol. 445:257–266.
48. Cleveland BM, Kenney PB, Manor ML, Weber GM (2012) Effects of feeding level and sexual maturation on carcass and fillet characteristics and indices of protein degradation in rainbow trout (Oncorhynchus mykiss). Aquaculture 338–341: 228–236.
49. Garcı´a de la serrana D, Vieira VLA, Andree KB, Darias M, Este´vez A, et al. (2012) Development temperature has persistent effects on muscle growth responses in gilthead sea bream. PLoS ONE 7: e51884.
50. Enes P, Panserat S, Kaushik S, Oliva-Teles A (2011) Dietary carbohydrate utilization by European sea bass (Dicentrarchus labraxL.) and gilthead sea bream (Sparus aurataL.) juveniles. Rev Fish Sci 19: 201–215.
51. Sua´rez MD, Martı´nez TF, Abella´n E, Arizcun M, Pe´rez-Jime´nez A, et al. (2009) The effects of the diet on flesh quality of farmed dentex, Dentex dentex. Aquaculture 288: 106–113.
52. van den Hemel-Grooten HNA, te Pas MFW, van den Bosch TJ, Garssen GJ, Schreurs VVAM, et al. (1997) mRNA levels of the calpain system in longissimus muscle of young pigs during prolonged feeding of a protein-free diet. J Anim Sci 75: 968–974.
53. Geesink GH, Kuchay S, Chishti AH, Koohmaraie M (2006) Micro-calpain is essential for postmortem proteolysis of muscle proteins. J Anim Sci 84: 2834– 2840.
55. Ilian MA, Morton JD, Bekhit AE-D, Roberts N, Palmer B, et al. (2001) Effect of preslaughter feed withdrawal period on longissimus tenderness and the expression of calpains in the ovine. J Agric Food Chem 49: 1990–1998. 56. Page BT, Casas E, Heaton MP, Cullen NG, Hyndman DL, et al. (2002)
Evaluation of single-nucleotide polymorphisms in CAPN1 for association with meat tenderness in cattle. J Anim Sci 80: 3077–3085.
57. Casas E, White SN, Wheeler TL, Shackelford SD, Koohmaraie M, et al. (2006) Effects of calpastatin and micro-calpain markers in beef cattle on tenderness traits. J Anim Sci 84: 520–525.
58. Ravulapalli R, Diaz BG, Campbell RL, Davies PL (2005) Homodimerization of calpain 3 penta-EF-hand domain. Biochem J 388: 585–591.
59. Parr T, Sensky PL, Scothern GP, Bardsley RG, Buttery PJ, et al. (1999) Relationship between skeletal muscle-specific calpain and tenderness of conditioned porcine longissimus muscle. J Anim Sci 77: 661–668.
60. Ilian M, Morton JD, Kent MP, Le Couteur CE, Hickford J, et al. (2001) Intermuscular variations in tenderness: Association with the ubiquitous and muscle-specific calpains. J Anim Sci 79: 122–132.