Microstructure Measurement and Microgeometric Packing
Characterization of Rigid Polyurethane Foam Defects
Jie Xu
1*, Tao Wu
1*, Jianwei Zhang
2, Hao Chen
3, Wei Sun
4, Chuang Peng
1*1Department of Chemical and Environmental Engineering, Faculty of Science and Engineering, University of Nottingham Ningbo Campus, Ningbo, China 315100.
2Weilan Furniture Ltd, Baotong road, Konggang industrial park, Yubei district, Chongqing, China 410021.
3Department of Mechanical Engineering, Faculty of Science and Engineering, University of Nottingham Ningbo Campus, Ningbo, China 315100.
4Department of Mechanical Engineering, Faculty of Engineering, University of Nottingham, Nottingham, UK NG7 2RD.
HIGHLIGHTS
Defect foams show great morphological variability but little difference in cell growth
Overpacking affects more on cell size distribution than anisotropy degree.
The regular polyhedron approximation based on volume constant calculation shows great
difference of packing structure for defect foam cells.
ABSTRACT
Streak and blister cell defects pose extensive surface problems for rigid polyurethane foams. In
this study, these morphological anomalies were visually inspected using 2D optical techniques,
and the cell microstructural coefficients including degree of anisotropy, cell circumdiameter, and
the volumetric isoperimetric quotient were calculated from the observations. A geometric regular
polyhedron approximation method was developed based on relative density equations, in order to
characterize the packing structures of both normal and anomalous cells. The reversely calculated
cell volume constant, 𝐶𝑐, from polyhedron geometric voxels was compared with the empirical
polyhedron cell volume value, 𝐶ℎ. The geometric relationship between actual cells and
approximated polyhedrons was characterized by the defined volumetric isoperimetric quotient.
Binary packing structures were derived from deviation comparisons between the two cell volume
constants, and the assumed partial relative density ratios of the two individual packing
polyhedrons. The modelling results show that normal cells have a similar packing to the
Weaire-Phelan model, while anomalous cells have a dodecahedron/icosidodecahedron binary packing.
KEYWORDS
Microstructure, Microgeometry, Relative density, Polyhedrons, Anisotropy, Cell volume constant,
1.
INTRODUCTION
Polyurethane foams are commonly used in a wide range of applications, from vibration
management to thermal insulation. In this regard, laminated insulation panels made of rigid foams are high-performance materials, economically comparable to other candidate materials1. Nonetheless, the out-of-equilibrium processing and formulation variability of the foams may
result in various foam surface defects, which could affect the foams’ properties. The anomalous surface tessellation of streak and blister cells, which have unexpected geometric irregularities
and anomalies, has been commonly observed in the production of panels. The possible causes for these defects can be immiscible hydrocarbon contamination, insufficient polydispersion, and foam overrunning and undulation. Though rarely studied, extensive microgeometric packing
characterization is a facile tool that can help reveal the underlying causes for the aforementioned defects.
According to the theory of homogenization2, the macroscopic properties of heterogeneous materials, such as polyurethane, can be characterized by measurements of their microscopic values, obtained within the representative elementary volume (REV) of idealized
unit-cell tessellations. Despite the cells heterogeneity and disorderness causing measurement inaccuracy, the quantitative assessment of the morphological characteristics of a material is still
an effective tool to understand the material’s micro and macro properties.
Regular or irregular polyhedrons are usually employed to approximate the packing structure of a cell’s microgeometry, regardless of whether extensive irregularities exist. In 1873,
body-centred-cubic (bcc) structured tetrakaidecahedron unit cell, with six square and eight hexagonal faces, and slightly curved edges3. Subsequently, Weaire and Phelan4,5 developed a
counter-example of polyhedral packing, by proposing a foam cell structure consisting of six 14-sided truncated hexagonal trapezohedras, and two 12-sided pentagonal dodecahedras. This foaming
structure is the structure with the most tessellation and the lowest surface energy, having about 0.3% less surface area per unit volume than the structure proposed by Kevin6. However, this model is only recognized as a conjecture of geometric packing structure, and has not been
experimentally proven to be the most efficient model7. Some numerical models have also been developed recently, based on microstructural reproduction techniques using tomographic
computation8,9. These models were developed, based on measured microstructural variables in order to predict the representativeness of the cells’ macromechanics10, which are practically straightforward based on the unit cells under the homogenization restriction. However, geometric
heterogeneousness becomes a challenging factor to all these inherently deterministic methods. Specific to polyurethane foam that is produced based on formulation chemistry, the cells grow at
random gaseous nuclei sites, abiding to Gibbs isotherm theory, through nucleation, coarsening, propagation, and coalescence. This growth process attributes to the vast cell geometric variability and significantly divergent inhomogeneity, which can compromise the applicability of the
Weaire and Phelan model. Meanwhile, non-equilibrium foaming can further aggravate the cells heterogeneousness and impair equipartition. In addition, the equilibrium fraction of packing
polyhedrons, with a known hexagonal trapezohedron and pentagonal dodecahedron ratio, can become indeterminable. All this variability may lead to failure of the Wearie-Phelan packing structure, even when plenty dodecahedron images are observed. The packing idealization of
Foam morphological characterization is usually broken down into microstructural measurements and microgeometric modelling. The measurements are conducted on cell
structural factors such as nodes/connectivity, struts/skeletons, and walls/windows, in correspondence with the polyhedral voxels of vertices, edges, and faces. Some microstructural
coefficients have been developed to further characterize cells and to construct numerical simulations. The degree of anisotropy, which is defined as the ratio of large to small cell diameters, is a widely adopted parameter used to characterize cell orientation by foaming, and
cell elongation by mechanical deformation11,12. Moreover, the degree of anisotropy has also been employed to define the compressive micromechanics of carbon nanotube polyurethane
composites13. The axisymmetric cell measurement method greatly contributes to two admitted models: the parallelepiped14 and tetrakaidecahedron cell15 models. The isoperimetric quotient ratio, which mathematically defines the maximum volume found within a minimum surface, is
also used to characterize the cell volume. However, in this study, a more sophisticated volumetric isoperimetric quotient is proposed, as the merit aspect ratio, to maximize the volume
of the enclosed polyhedral within the assumed corresponding circumscribed sphere, and to effectively feature the spherical degree of the cells.
The morphologic characterization of foams is most often conducted through visual
inspections using optical microscopy techniques16,17, but this characterization method is susceptible to relevant variability. Classical stereological techniques provide a great quantitative
3D interpretation of 2D measurements by random and systematic sampling, and have been adopted to study the microstructure of polyurethane18. These studies are based on the assumption that structural homogeneity exists, and can be an effective method to quantify the overall cell
imaging techniques, such as optical microscopy and scanning electron microscopy (SEM), are always regarded as easily accessible techniques in spite of variability and disturbances by the 3D
cell complexity19,20. Thus, a digital crosscheck of the extracted legible images can significantly improve the data reliability.
The purpose of this study is to characterize defects in the cell morphology using structural measurements and geometric modelling, in order to gain more insight about cell anomalies in out-of-equilibrium processing, and to develop a practical mathematical idealization
approach for cell tessellation characterization based on relative density equations. The cell microstructural factors were measured using optical instruments, and the characteristic
coefficients were calculated and analysed with statistical software. The cell packing structure was characterized into two idealized regular polyhedrons. The volumetric isoperimetric quotient, instead of the isoperimetric quotient, was used to evaluate the cell spherical degree. The
geometric characteristics of regular polyhedrons were also assessed for their similarity to actual cells.
2.
MATERIALS AND METHODS
2.1 Materials
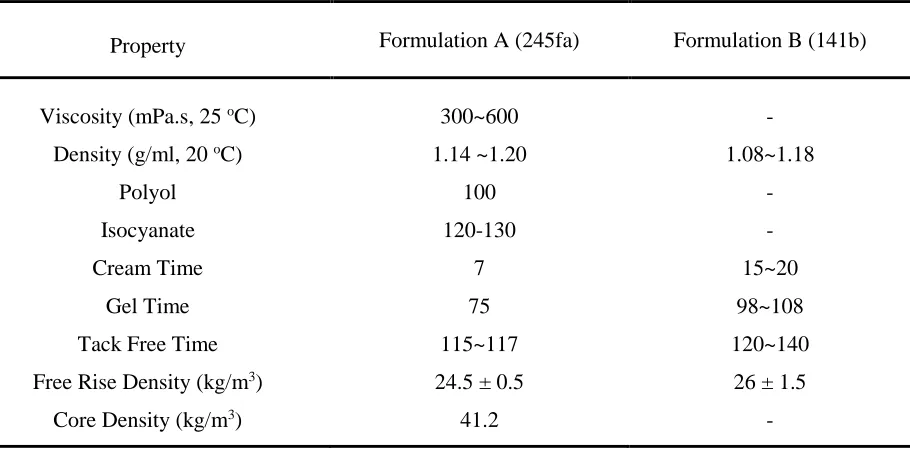
Rigid polyurethane panels were produced by a discontinuous multilayer press process. The pre-blended polyols were supplied by Wanhua China. Formulation A (245fa) and formulation B
The sample panels from each trial were taken to the Honeywell labs for instrument-aided analysis. The foam specimens, with a defined size, were carefully taken from different positions
[image:9.612.84.539.215.442.2]on normal and defected foam surfaces. The same measurements were conducted on specimens with different overpacking percentages (15% and 20%).
Table 1 - Materials technical data
Property Formulation A (245fa) Formulation B (141b)
Viscosity (mPa.s, 25 oC) 300~600 -
Density (g/ml, 20 oC) 1.14 ~1.20 1.08~1.18
Polyol 100 -
Isocyanate 120-130 -
Cream Time 7 15~20
Gel Time 75 98~108
Tack Free Time 115~117 120~140
Free Rise Density (kg/m3) 24.5 ± 0.5 26 ± 1.5
Core Density (kg/m3) 41.2 -
2.2 Cell microstructure
The microstructure measurements of the foams were conducted using a scanning electron microscope (SEM, Hitachi SU 8200), and an optical microscope (ZEISS Axioskop 2 MAT, both
x100 and x200 focuses). The axisymmetric dimension, strut length/thickness, and wall thickness of each cell, within the observation scope, were measured. All images were documented for
crosschecking and further measurements. The edges and vertexes at the connectivity of each cell were also carefully examined. The sophistication of specimen lamination, and optical focal
calculated by dividing its maximum height (along the y-axis) by its orthogonal maximum length (along the x-axis). The mean value of both measurements was approximated as the cell’s
diameter. The cell size was calculated using the formula for the area of a circle, 𝐴𝑖 = 𝜋 (𝑑2𝑖) 2
,
based on the obtained mean diameter value. The statistical cell size calculations and anisotropy
distribution normality analysis were conducted using the MINITAB 16 software.
2.3 Cell microgeometry
The recorded cell shapes were carefully compared with the features of identical
geometric polyhedrons. The standard orthogonal projections of each assumed polyhedron were employed for further conformation examinations, and the cell growth and tessellation theories
were recalled for rationalization. Through the integration of geometric identification and theoretical reasoning, it was possible to determine the microgeometry of the cell. For the relative density ratio calculations, the foam densities were measured using a densimeter (ULTRAPYC
1200C). Each measurement was repeated three times for data reproducibility.
2.4 Relative density equation
To characterize the cell packing structure, the measured microstructural factors were substituted into the following relative density equation21:
𝜌∗ 𝜌𝑠
=
𝑛̅𝑓 2𝑍𝑓𝑙𝑡𝑒2+
𝑓 2𝑙2𝑡𝑓
𝐶𝑙3
=
𝑓 𝐶
[
𝑛̅ 2𝑍𝑓
(
𝑡𝑒 𝑙
)
2+
1 2(
𝑡𝑓𝑙
)]
(1)where 𝐶 is the volume constant, a key characteristic factor for cell geometry approximations,
which is calculated from the relative density ratio of porous and solid polymers ( 𝜌 ∗
𝜌𝑠
the ratio of the face thickness and edge length; 𝑡𝑒⁄𝑙 is the ratio of the edge thickness and length
based on experimental measurements; and 𝑛̅ is the average number of edges per face, which is
defined by the following equation:
𝑛̅ =
𝑍𝑒𝑍𝑓𝑍𝑒−2
(1 −
2𝑓
)
(2)where 𝑍𝑒 denotes the number of edges at one vertex, 𝑍𝑓 denotes the number of faces at one edge,
and 𝑓 is defined as the total number of faces on the packing polyhedron.
3.
MORPHOLOGICAL CHATACTERIZATION
3.1 Cell size
The cell axisymmetrical measurements of the maximum length (x-axis) and the maximum height (y-axis) (Figure 1) were divergent for all cells. The normal cell cluster has a slightly lower
concentration, and smaller cell dimensions, than the streak cell cluster in the close domain. The blister cell cluster presents a wide range of cell dimensions, ranging from ~100 to ~1,400 μm, with less unity. The Anderson-Darling normality analysis of the isoperimetric circumdiameter
(Table 2) suggests that the streak cells have a relatively larger size than the other two groups. The mean size value of the blister cells resembles that of the normal cells, but with exponentially
more discreteness and variance. The negative skewness of the streak cells at smaller size ranges indicates the possibility of streak cells suffering from negative growth inhibition.
Meanwhile, the visual inspection show the foam cells present more homogeneousness at
point, which suggests that the injecting head pressure had a positive impact on the cell growth. The blowing agents vaporize as they flow over the nucleating sites. Geometrically speaking,
there is no other site inside the circumsphere of any simplex of one particular site. The law of closest pair points states that the shape of Voronoi cells is define by the points whose distance to
the nuclei point is less than or equal to their distance to any other point. The nucleating sites density is higher at the point close to injection point, which is also where the normal cells grow further. As material fluids flow, the blowing agents vaporization from continuous injection
pressure reducing and reaction temperature rising aggravates the incompatibility of the dispersion, leading to extensive cell inflation and the growth of blisters. This dispersion problem
[image:12.612.141.474.414.622.2]also affects the effectiveness of the surfactant, which results in severe blister cell size variability. The streak pattern occurs because the flow undulation gets wrapped with possible immiscible contaminants, which becomes severe when the pressure continuously goes down.
Figure 1 – Latitudinal and longitudinal cell size (Normal/Streak/Blister)
Normal Streak Blister
Mean 423.61 636.72 433.54
Std. Dev. 105.13 123.89 320.64
Variance 11051.79 15348.17 102808.48
Skewness 0.389579 -0.925713 0.946351
3.2 Degree of Anisotropy (DA)
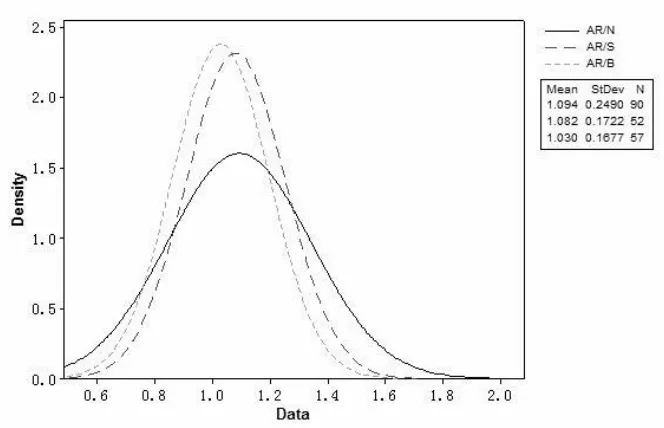
The higher isotropic characteristics of blister cells, compared to normal and streak cells, were confirmed by running Anderson-Darling normality tests with the MINITAB 16 software (Figure 2). This result provokes the argument that more non-equilibrium may lead to a better
homogeneity, and more accessible spherical shapes with a high volumetric isoperimetric quotient. The statistical analysis of the anisotropic degree further suggests that normal cells exhibit a
higher standard deviation, variance, and skewness, in comparison with defect cells (streak and blister). These latter ones, i.e. the defect cells, showed quite similar normality with near sphere features (Table 3). These results reflect that normal cells have more variability in their
anisotropic degree measurements, and defect cells seem less susceptible to disorderness.
The degree of anisotropy is related to the foaming pressure, flow viscosity, and space
confinement, and is a more common problem for continuous panel production processes, than for discontinuous processes. It can be interpreted by the elliptic differential equation of Laplace’s
law, which states that two radii of curvature (Rx, Ry) with surface tension (γ) can determine the
curvature. When the anisotropic degree is close to 1, or in other words when the two radii are
approximately equal (Rx = Ry), and the shape of the cell is close to a sphere, with streak and
blister cells present in this case, the wall tension of the polymer window face and the imbalance
of the cohesive forces are minimized. This means that the partial vapour pressure of the blowing agents in streak and blister cells is higher than in normal cells, in order to outperform the
[image:14.612.142.474.302.516.2]viscosity forces in the bulk polymer liquid, until a final net-force of zero is reached. Otherwise, a dispersion problem will arise due to a compromised flow force underperforming at the foaming pressure, which will lead to the production of more spherical cells.
Figure 2 - Degree of anisotropy normality (Normal – AR/N, Streak – AR/S, Blister – AR/B)
Table 3 - Key normality coefficients of the anisotropy degree
Normal Streak Blister
Mean 1.0942 1.0825 1.0301
Std. Dev. 0.2490 0.1722 0.1677
[image:14.612.66.543.584.712.2]Skewness 1.33355 0.609770 0.89977
3.3 Microstructural voxels
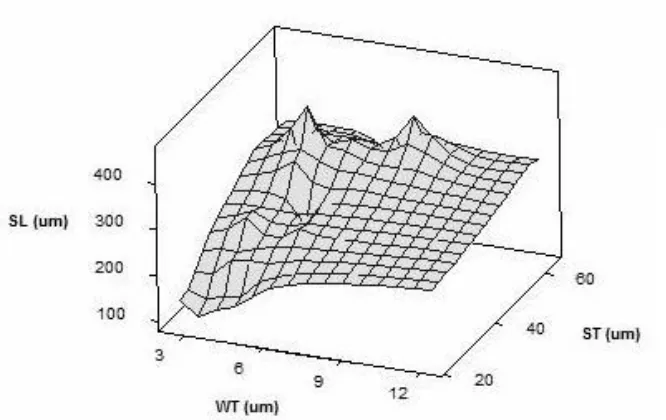
The 3D illustration of the measured microstructural voxels, for both normal and defect cells (Figure 3), presents an obtrusive ascent, with almost similar slopes, at the SL-WT (strut
length/strut thickness) and SL-ST (strut length/wall thickness) planes. This characterized steady rise is found to grow proportionally to the cell size, as analysed by the circumdiameter of the cell.
The cell skeleton growth is a good manifestation of Gibbs-Marangoni effects. The mass transfer over the surface tension gradient takes place along the interface between the polymer fluids and the blowing agent vapour. The surface tension imbalance at this interface forces the polymer
liquid to pull any surrounding liquid. The created gradient causes the liquid to flow away from regions of low surface tension, and towards the edge of the cell. Voronoi cells form in terms of
dual graph and Delaunay triangulation. The polymer liquid starts accumulating at convex hulls during the cell nucleation, leading to the production of a Plateau border. A much deeper slope was observed in low cell domains with shorter struts and thinner walls (Figure 3), which suggests
that cell strut stretches are dominant during early coarsening, right after nucleation. During the Plateau border formation, the cell skeletons and windows (strut and wall) are additionally
strengthened by further liquid polymer drainage, and solidification in propagation and coalescence. Both normal and defect cells present no differences in their growth mechanism
Figure 3 - 3D graph of strut length (SL), strut thickness (ST), and wall thickness (WT) (Normal/Streak/Blister)
3.4 Foaming effects
Usually, low-boiling-point blowing agents, i.e. HFC-245fa, can produce more homogenized equiaxed spherical cells, in comparison with other blowing agents with higher
boiling points, i.e. HCFC-141b. Nonetheless, non-equilibrium foaming can alter and transform quasi-homogenous cell configuration, and make it more variable. Disorderness can be
aggravated by out-of-equilibrium processing, such as inadequate overpacking or insufficient pressurization. In Figure 4a, better and smaller sized normal cells (~423.6 um) are observed, in comparison to streak cells (~636.7 um), for two tests conducted with the same overpacking
parameter. This result suggests that normal cells have a finer small cellular size than streak cells, although both show the same distribution; and it indicates that foams with more streak problems
higher partial vapour pressures. The dispersion problem of the surfactants, which results from surface tension differences, can be the key to this issue. The interfacial rheological surfactant
effects, including elasticity and viscosity, attribute to the differences in the concentration distribution that govern the geometric growth and stabilization of the cell. Further tests
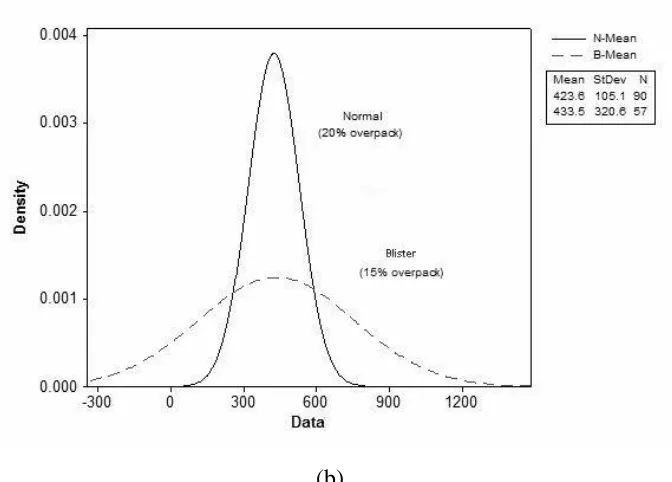
conducted with severe less overpacking from 20% to 15%, (Figure 4b) indicate that the same mean cell size values, albeit with a different distribution, can be produced by overpacking variances. These differences can cause defect blister cells. This means that extensive lack of
overpacking can aggravate the cell size distribution more than the cell size value, which suggests that the best way to control the cell size is by changing the processing method. However, the
overpacking adjustment may lead to more surface problems of disorderness and heterogeneity.
(b)
Figure 4 - Cell circumdiameter distribution (a) same overpacking (b) different overpacking
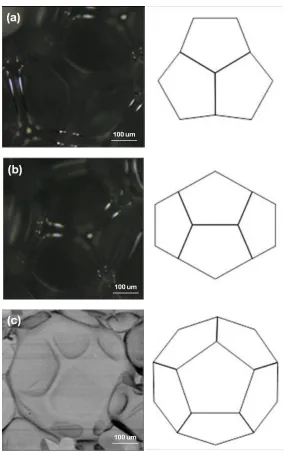
3.5 Microgeometry
In most cases, the most accepted idealized cell geometries are the two-packing
polyhedrons of the Weaire-Phelan model – the irregular dodecahedron and tetrakaidecahedron – which are projected orthogonally into the patterns of a pentagon and a hexagon. In this study, a well-preserved dodecahedron geometric shape, with a distinctive skeleton structure, was clearly
identified on the normal cells. Most observed polygonal structures were compared with featured polyhedral orthogonal projections, and it was confirmed that the regular/irregular dodecahedron
Figure 5 –Dodecahedron projection pattern of normal cells
Similar but more irregular pentagonal, as well as hexagonal, geometries with a larger size variation were found on anomalous cells, which suggests that the Weaire-Phelan model could
defect growth mechanism is similar to the “void effect” that is attributed more to differences in surface tensions. When the mixed gases of the blowing agents accumulate at nuclei sites in
inhomogeneous randomness, the cell inflation rate is influenced by the gaseous concentration, i.e. the site with higher gas concentration and less surface tension grows faster than the site with
lower gas concentration and higher surface tension, which results in cell geometric variability. The cell grows more spherical as more work is exerted from the gaseous force. The flow of the liquid polymer along the tension gradient attributes to the cell wall thickness and Plateau border
formation. The loosing surfactant effects can result in a thicker cell membrane and staunch nodes (Figure 6a). Meanwhile, an increase in the number of neighbouring cells was observed in less
overpacking tests (Figure 6b), with the presence of a fair amount of small sized cells, of 133.50 μm, in the 1st quartile of the wide size range. This abnormal feature is a consequence of smaller
cells aggregating at the connectivity points, creating root gradation under certain larger cell sites.
The root gradation results from the high concentration of blowing agents accumulating at the point site of the triangulation centre, with extra coordinates and dimensions, where exclusive
(a)
[image:21.612.194.422.74.279.2](b)
Figure 6 – SEM images of foam cell defects (blister): (a) high spherical degree cells (b) root neighbouring cells
4.
PACKING STRUCTURE
4.1 Regular polyhedron approximation method
A geometric regular polyhedron approximation method was developed to characterize the cell
packing structure, which has been proven to be a practical idealization method that can be further improved with ancillary instrumental analysis and statistical manipulations.
In order to calculate the cell volume constant 𝐶𝑐, and to compare it with the empirical
polyhedron volume constant 𝐶ℎ of each assumed regular polyhedron, all measured cell
microstructural factors (𝑡𝑒, 𝑡𝑓, 𝑙) and empirical regular polyhedron voxel factors (𝑍𝑒, 𝑍𝑓 , 𝑓) were
inputted into the relative density equation Eq (1). Both the polyhedron volume constant 𝐶ℎ and
reference tables. The value of 𝑛̅ was calculated from Eq (2). For the cell relative density ratio
(𝜌 ∗
𝜌𝑠
⁄ ), 𝜌∗ can be experimentally measured, and 𝜌𝑠 can be calculated by:
𝜌
𝑠= 𝜑𝜌
𝑝+ (1 − 𝜑)𝜌
𝑖 (3)where 𝜌𝑝 denotes the density of polyol, 𝜌𝑖 denotes the density of isocyanate, 𝜑 is defined as 1+𝜎1
(where 𝜎 is the iso/polyol index from the formulation). The packing structure can be derived
from further evaluations of the approximation deviation of the two volume constants (𝐶𝑐 and 𝐶ℎ).
A smaller deviation means more similarity, i.e. the cells have similar shape and size. Supposing the translation unit of the packing structure is constructed in binary, two individual packing
polyhedrons are conclusive as having the least deviation, either negative or positive, to the actual cells.
The packing fractions can also be derived from evaluations of the relative density ratio.
In this study, (𝜌𝐴
∗
𝜌𝐴) and (
𝜌𝐵∗
𝜌𝐵) are assumed as the relative density ratios for the two obtained
packing polyhedrons, 𝐴 and 𝐵. The relative density ratios were calculated from Eq (1), using the
cell microstructural factors and the polyhedron geometric voxels, together with the volume
constant 𝐶ℎ. The fractional relationship of the relative density ratios between the cell (𝜌
∗
𝜌𝑠) and
the two individual polyhedrons, (𝜌𝐴
∗
𝜌𝐴) and (
𝜌𝐵∗
𝜌𝐵) , can be expressed as follows:
𝜌∗ 𝜌𝑠
= 𝛿
𝜌𝐴∗
𝜌𝐴
+ (1 − 𝛿)
𝜌𝐵∗
𝜌𝐵 (4)
𝛿 =
𝜌∗ 𝜌𝑠−𝜌𝐴
∗ 𝜌𝐴 𝜌𝐴∗
𝜌𝐴−𝜌𝐵
∗ 𝜌𝐵
(5)
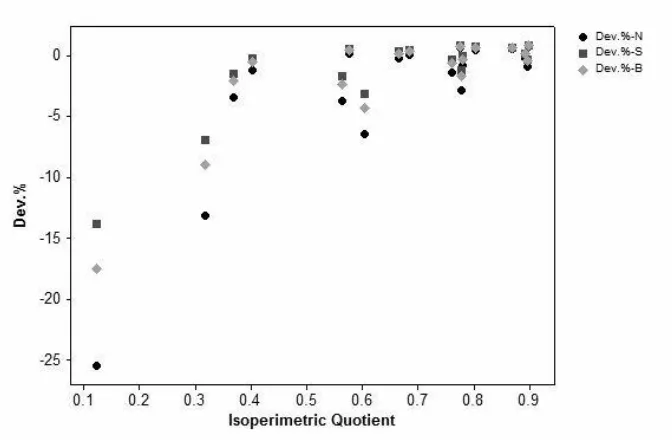
4.2 Volumetric isoperimetric quotient
The approximation deviation between the two volume constants, 𝐶𝑐 and 𝐶ℎ, implicates
the conformation similarity between the cell microgeometry and the idealized polyhedrons. With respect to the calculated volumetric isoperimetric quotient, which represents the analogousness of the polyhedral to the sphere, the volume constant deviation is able to provide a prediction on
the geometric conformity of the idealized individual polyhedrons to the actual cells. It is widely admitted that cells grow into a spherical shape under any circumstance, eventually
approximating to an ideal perfect condition, which is characterized by a volumetric isoperimetric quotient of 1 that indicates the polyhedron is isometric to a sphere. The asymptotic trend shown for the approximation deviation of individual polyhedrons over volumetric isoperimetric
quotients (Figure 7), indicates that a higher spherical similarity corresponds to a higher conformation. The polyhedron with high voxel factors values (more face, edge, and vertex), and
a high corresponding quotient, has more geometric conformity with the actual cells. Both normal and anomalous cells are observed to follow the same trend; that is to say, they have smaller sphericity deviations. Anomalous cells (streak and blister) have more resemblance to the
idealized polyhedrons than the normal cells, in terms of less deviation derived from the calculations (Figure 7). Nonetheless, although approximation deviations and comparisons of the volumetric isoperimetric quotient are not a straightforward way to identify the representative
Figure 7 – Deviation of the calculated cell volume constant against the volumetric isoperimetric quotient
4.3 Calculation results
The key parameters used in the calculations of the binary packing structures are detailed
in Table 4. The derivations show that a dodecahedron is the primary packing polyhedron for all three types of cells. However, the dodecahedron can combine with other polyhedrons, such as a truncated octahedron or an icosidodecahedron, to form binary packing structures with different
packing fractions. Each packing combination of the three types of cells implicates a different cell growth process:
Table 4 - Relative density model calculation
Polyhedrons 𝜌
∗
𝜌𝑠 𝑡𝑒⁄𝑙
𝑡𝑓
𝑙
⁄ 𝜌𝐴/𝐵
∗
[image:24.612.73.543.639.690.2]Normal
Dodecahedron 0.044115 0.197168 0.029908 0.0516 29%
Truncated octahedron 0.044115 0.197168 0.029908 0.040995 71%
Streak
Dodecahedron 0.052027 0.153641 0.021742 0.034137 3%
Icosidodecahedron 0.052027 0.153641 0.021742 0.052564 97%
Blister
Dodecahedron 0.047211 0.174667 0.021072 0.038616 59%
Icosidodecahedron 0.047211 0.174667 0.021072 0.059807 41%
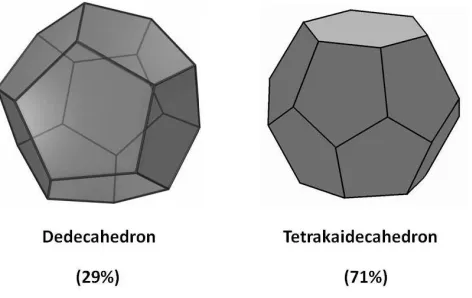
4.3.1 Normal cells
Irregular dodecahedrons (pyritohedrons) and tetrakaidecahedrons (hexagonal truncated trapezohedrons) are the two conclusive packing polyhedrons obtained from our approximations (Figure 8), and they are similar to the geometrical shapes proposed by the Wearie-Phelan model.
In spite of cell structural concavity and microscopic imaging faintness, a great amount of regular pentagonal symmetries were clearly identified in our observations. These observed pentagonal
symmetries provide concrete evidence of the modelling results. Nonetheless, it is not always easy to distinguish between irregular and regular shapes due to cell orientation and deformation. The isometric truncated octahedron and tetrakaidecahedron symmetries are also substituted to
packing fractions derived from the approximation, 29% dodecahedrons and 71% truncated octahedrons, do not conform to the Wearie-Phelan model’s typical packing of 75%
[image:26.612.191.427.208.357.2]pyritohedrons, and 25% hexagonal truncated trapezohedrons. This difference is attributed to increasing randomness at the nuclei sites by a less homogenized foaming susceptibility.
Figure 8 – Approximated packing polyhedrons for normal cells
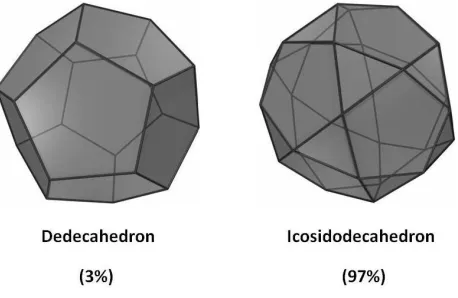
4.3.2 Streak cells
The packing model for streak cells is idealized as a combination of dodecahedrons and icosidodecahedrons (Figure 9). The fraction for dodecahedron packing is extremely low, only 3%
(Table 4), which is contradictory to most pentagon geometries observed by SEM. The presence of icosidodecahedron geometries cannot be confirmed even with the increasing numbers of pentagonal faces found in the observations. The icosidodecahedron geometry contains 12
pentagonal faces constituting a dodecahedron, and 20 triangular faces constituting an icosahedron, which is the result of dodecahedron rectification, or the full-edge truncation of the
has a greater geometric proximity to spheres of larger volumes than most polyhedrons. This volumetric feature partly confirms the conclusion from the cell size measurements (Table 3), in
that streak cells present relatively larger sizes attributable to a stronger coarsening variability after nucleation. Cell coarsening is more than leverage between dimensional expansion and
geometric transformation towards a more spherical approximation. In terms of polyhedral geometric transformation, truncation and rectification occur simultaneously and alternatively during cell growth, and the vertex numbers increase in non-linear proportions to the face
transformation. Streak cells are conjectured to undertake extensive inflation under a less localized surface tension effect by the surfactants, and there is possibly more coalescence in
[image:27.612.195.424.428.577.2]subsequent propagations, creating more disorderness in the dispersion, and more heterogeneousness in the structure. Albeit of less evidence in observation, the presence of icosidodecahedron geometries is still a valid finding supported by the cell growth theory.
Figure 9 – Approximated packing polyhedrons for streak cells
The same packing combination found for streak cells was found for the blister cells, i.e. dodecahedron and icosidodecahedron, but with different packing fractions (Figure 10). Very
similar deviation results from the approximation calculations for each assumed polyhedron brings about more indeterminateness to idealization, and also indicates the possibility of
multi-packing rather than binary-multi-packing structures for blister cells. The SEM investigation confirms the presence of two major types of cells with different sizes on the blister surface – more spherical large-sized cells, and more concentrated small-sized cells. Similarly to the growth of
streak cells but more aggressively, blister cells are assumed to nucleate in considerable randomness during initiation, followed by extensive coarsening. This blister cell growth
behaviour leads to the production of well-grown polyhedral cells in large volumes. The growth competition causes more variability in the cell configuration. The resulted inhibition effects acting beyond exclusive distance coalescence theory lead to the accruement and accumulation of
smaller cells, with more geometric transformation than dimensional expansion, at different connectivities. These two groups of cells, different in size and shape, contribute greatly to
Figure 10 – Approximated packing polyhedrons for blister cells
5.
CONCLUSIONS
This study is a practical case of using a geometric regular polyhedron approximation method, alongside optical instrumental measurements, to characterize the microstructure of foam cells
and the geometric packing structure of rigid foam defects. As the morphological measurements showed, streak and blister cells have a larger size and are more spherical than normal sized cells. In this regard, normal sized cell presented a more anisotropic and divergent behaviour. Extensive
overpacking can have a bigger effect on the cell size distribution than on the degree of anisotropy. Orthogonal projection analysis provided collateral validations on the primary packing
polyhedron conclusion of dodecahedron shapes. Numerous small neighbouring cells were observed aggregating at random connectivity nodes for anomalous foams.
As a modelling calculation, a polyhedron with a higher volumetric isoperimetric quotient
packing combination of dodecahedron and truncated octahedron as the Wearie-Phelan model, but with different packing fractions. Anomalous cells, both streak and blister, are approximated to
have similar packing structures of dodecahedron and icosidodecahedron symmetries, but with different packing fractions. Our conclusion of packing idealization is well interpreted by Voronoi
tessellations and the cell growth theory. The high approximation deviation observed for some calculations indicates the great possibility that a multi-packing structure, rather than a
binary-packing one, exists for anomalous cells.
ACKNOWLEDGEMENTS
This work was supported by the NSFC (Grant No. 21403119). The authors would like to thank
the kind assistance offered by the Honeywell Shanghai Lab for analytical works, TICA China for providing trial opportunities and panel specimens, and Wanhua China for supplying the
REFERENCES
[1] Carlsson L. A., Kardomateas G. A., Structural and Failure Mechanics of Sandwich
Composites, NY, USA (2011).
[2] Doutres O., Ouisse M., Atalla N., Ichchou M., J Acoust Soc Am, 136, (2014), 1666-1681.
[3] Plateau JAF. Statique experimentale et theorique des liquides soumis aux seules forces
moleculaires, Paris: Gauthier–Villiard (1873).
[4] Weaire D. A. Phil Mag Lett, 69, (1994), 107-110.
[5] Bock J, Jacobi A. M., Mater Character, 75 (2013) 35-43.
[6] Buffel B., Desplentere F., Bracke K., Verpoest I., Int J Solids Struct, 51 (2014), 3461-3470.
[7] Gabbrielli R., Meagher A. J., Weaire D. et al., Phil Mag Lett, 92 (2012), 1-6.
[8] Montminy M. D., Tannenbaum A. R., Macosko C. W., J. Colloid Interface Sci, 280 (2004), 202–211.
[9] Youssef S., Maire E., Gaertner R., Acta Mater, 53 (2005), 719–730.
[10] Beckmann C., Hohe J., Mech Mater, 96 (2005), 96-105.
[11] Ridha M., Shim V. P.W., Exp Mech, 48 (2008), 763-776.
[12] Hamilton A. R., Thomsen O. T., Madaleno L. O. M., Jensen L. R. , Rauhe J. C. M., Pyrz R.
Compos Sci Technol, 87 (2013), 210-217.
[14] Huber A. T., Gibson L. J. J Mater Sci, 23 (1988), 3031–3040.
[15] Sullivan R .M. , Ghosn, L. J., Lerch B. A., Int J Solids Struct, 45 (2008), 1754-1765.
[16] Rhodes M., J Elas Plast, 12 (1980), 201-218.
[17] Hamza R. Polymeric Foams: Science and Technology, Washington, DC, USA (1997).
[18] Ryszkowska J. Mater Character, 60 (2009), 1127 – 1132.
[19] Rodriguez-Perez M., Cell Polym, 21 (2002), 165-194.
[20] Pardo-Alonso E. A., J Europ Polym, 49 (2013), 999-1006.