1
A novel
Brassica-rhizotron system to unravel the dynamic changes
in root system architecture of oilseed rape
under phosphorus
deficiency
Pan Yuan1,2, Guang-Da Ding1,2, Hong-Mei Cai2, Ke-Mo Jin1,2, Martin R. Broadley3, Fang-Sen Xu1,2 and Lei Shi1,2*
1
National Key Lab of Crop Genetic Improvement, Huazhong Agricultural University, Wuhan 430070, PR China, 2Key Lab of Cultivated Land Conservation, Ministry of Agriculture/ Microelement Research Centre, Huazhong Agricultural University, Wuhan 430070, PR China,
3Plant and Crop Sciences Division, School of Biosciences, University of Nottingham, Sutton
Bonington Campus, Loughborough LE12 5RD, United Kingdom
*
For correspondence. E-mail leish@mail.hzau.edu.cn
Short running title: Root system architecture of oilseed rape under two
phosphate availabilities
Received: 1 February 2016 Accepted: 16 March 2016
<<TYPESETTER: THIS MS HAS EQUATIONS PLEASE INSERT
A novel Brassica-rhizotron system to unravel the dynamic changes
in root system architecture of oilseed rape under phosphorus
deficiency
• Background and Aims An important adaptation of plants to phosphorus (P)
deficiency is to alter root system architecture (RSA) to increase P acquisition from
the soil, but soil-based observations of RSA are technically challenging, especially in
mature plants. The aim of this study was to investigate the root development and
RSA of oilseed rape (Brassica napus L.) under low and high soil P conditions during
an entire growth cycle.
• Methods A new large Brassica-rhizotron system (~118 L volume) was developed
to study the RSA dynamics of B. napus cv. Zhongshuang11 in soils, using top-soils
supplemented with of low P (LP) or high P (HP) for a full plant growth period. Total
root length (TRL), root tip numbers (RTN), root length density (RLD), biomass and
seed yield traits were measured.
• Key Results TRL and RTN increased more rapidly in HP than LP plants from
seedling to flowering stages. Both traits declined from flowering to silique stages,
and then increased slightly in HP plants; in contrast, root senescence was observed in
LP plants. RSA parameters measured from the polycarbonate plates were empirically
consistent with analyses of excavated roots. Seed yield and shoot dry weights were
3
and LP.
• Conclusions The Brassica-rhizotron system is an effective method for soil-based
root phenotyping across an entire growth cycle. Given that root senescence is likely
to occur earlier under low P conditions, crop P deficiency is likely to affect late water
and nitrogen uptake which is critical for efficient resource use and optimal crop
yields.
Key words: oilseed rape (Brassica napus L.), phosphorus deficiency, root system
architecture, dynamic changes, Brassica-rhizotron
INTRODUCTION
In plants, phosphorus (P) is a structural element of nucleic acids, enzymes,
phosphoproteins and phospholipids, and is involved in energy transfer, enzyme
reactions, photosynthesis and carbon partitioning (Marschner, 2012). Plant uptake of
P is mainly as inorganic phosphate (Pi), which is typically present at concentrations
<10 µM in the soil solution and limited by slow rates of diffusion and mass flow
(Bieleski, 1973). In soils, Pi availability to plant roots is limited by strong binding
with iron-aluminum oxides in acid environments and by carbonates in calcareous
soils (Raghothama, 1999). Strategies for cultivating plants under low soil Pi
availability include those aimed at improving P utilisation, and enhancing the
acquisition or uptake of P (Vance, 2001), for example, by increasing root growth or
altering root system architecture (RSA) for efficient root foraging (White et al.,
Under P-limited conditions, Arabidopsis thaliana shows inhibition of primary
root length (Ticconi et al., 2004; Sanchez-Calderon et al., 2005; Svistoonoff et al.,
2007; Fang et al., 2009; Giehl et al., 2014), stimulation of lateral roots and increased
root hair production (Williamson et al., 2001; Linkohr et al., 2002; Malamy, 2005;
Peret et al., 2011). The RSA of common bean and soybean is shallow at low P
(Bonser et al., 1996; Lynch and Brown, 2001, 2008; Rubio et al., 2003). In maize
(Mollier and Pellerin, 1999; Peng et al., 2012) and rice (Fang et al., 2009; Zhu et al.,
2011; Rose et al., 2012; Wu et al., 2013), more adventitious roots are produced
under P deficient conditions. These alternations of RSA traits enhance plant
acquisition of P.
Oilseed rape (Brassica napus L.) is one of the most important oil crops globally,
grown on 36.5 Mha (FAO, http://faostat.fao.org/, 2013). In China, which is the
world’s leading producer of oilseed rape, 50-70% of oilseed rape cultivated land
(~7.52 Mha) in Hubei, Sichuan, Hunan, Anhui, Jiangsu, and Henan Provinces, is
severely P-deficient (Yan et al., 2006).Under such conditions, oilseed rape growth is
inhibited, with purpling of cotyledons and with older leaves becoming dark green at
the seedling stage. At maturity, plants have fewer branches and seed setting is low
(Ding et al., 2012; Shi TX et al., 2013a, 2013b). Application of P fertilizers increases
the number of plant branches, pod number per plant, seeds per pod, and 1000-seed
weight (Cheema et al., 2001). In B. napus roots, primordia and lateral roots are
stimulated and primary root growth is reduced under P-stress at the seedling stage
5
is maintained relative to shoot growth, resulting in increasing root:shoot biomass
ratios during early flowering and ripening (Ukrainetz et al., 1975; Hermans et al.,
2006). Brassica napus cultivars with high physiological P use efficiency (PPUE)
have been shown to have longer lateral root lengths than those cultivars with low
PPUE under P-stress (Akhtar et al., 2008). In addition, the plant P concentration and
the diffusion coefficient of Pi increased at LP by release of large amount of
P-mobilizing root exudates, such as citrate, malate or oxalate (Hoffland et al., 1989;
Zhang et al., 1997; Pearse et al., 2006; Wang et al., 2013).
The effect of P deficiency on root development and its correlation with plant shoot
growth during whole growth of oilseed rape has not yet been reported in detail,
potentially for two reasons. First, it is difficult to observe roots in the field
nondestructively. Second, the growth period (e.g. ~250 d in Wuhan) makes repeated
observations extremely challenging. The aim of this study was to investigate the root
development and RSA of oilseed rape (Brassica napus) under low and high soil P
conditions during an entire growth cycle. This study sought to employ conditions
similar to real field environment, and to determine the effects of P applied in the top
soil (0-20 cm) on the root growth of oilseed rape at different soil depth. Given the
difficulties of studying plant root development and RSA in field soils during an
entire growth cycle (Nagel et al., 2012, Fender et al., 2013), a large rhizotron system
was designed and deployed.
Plant material
The oilseed rape (Brassica napus L.) cultivar used in this study was
“Zhongshuang11”, a double low (low gluconsinolate, low erucic acid), semi-winter,
commercial cultivar with high potential seed yields, which is grown widely in the
middle- and lower-reaches of the Yangzi river in China.
Soil type
The soil used in this study was a grey purple sandy soil, derived from sandy shale,
and collected from XinZhou district (Wuhan, China, 28.42°N 112.33°E). The
basic agrochemical properties on a dry soil basis were: pH (1:1 H2O w/v) 7.7,
organic carbon (dichromate oxidation method) 1.33 g kg-1, total nitrogen (kjeldahl
acid-digestion method) 0.25 g kg-1, available nitrogen (alkali-hydrolyzable nitrogen)
12.7 mg kg-1, total P 0.072 g kg-1, available P (Olsen-P) 4.0 mg kg-1 and hot water
soluble boron (HWSB) 0.10 mg kg-1. The methods are described by Shi et al. (2013b)
and Wang et al. (2014).
Experimental design
A total of 36 rhizotrons were used in this study. Each rhizotron comprised a
container made of polyvinyl chloride (PVC) sheets, whose rear side was a
transparent polycarbonate plate. The container was 670 mm width, 180 mm deep and
1000 mm height, giving a volume of ~118 L. A hollow steel tube (¢50 mm × 7
mm) was used to support the rhizotron, with the tubes fixed to grooves on two
parallel walls made of concrete and brick. The rear side of the rhizotron was leant
7
grow along the polycarbonate plate. A black blow molding board was attached to the
outside of the polycarbonate plate to create a dark environment for root growth.
Initially, each rhizotron was filled with 120 kg of the same dry soil without
fertilization. Soil was sieved to 4 mm. Then, a further 30 kg of the treated soils was
added to each rhizotron so that 18 units received 5 mg P2O5 kg-1 soil (low
phosphorus, LP) or 150 mg P2O5 kg-1 soil (high phosphorus, HP). The depth of
topsoil with the contrasting P-treatments was ~200 mm. Ground fertilizers consisted
of 200 mg kg-1 N ((NH4)2SO4), 150 mg kg-1 K2O (KH2PO4), and 250 mg kg-1
MgSO4·7H2O, respectively were mixed evenly with topsoil. Next, 30 mL of
micronutrient solution with 2.84 g L-1 H3BO3, 1.80 g L-1 MnCl2 4H2O, 0.22 g L-1
ZnSO4·7H2O, 0.08 gL-1 CuSO4·5H2O and 0.024 g L-1 Na2MoO4·2H2O, and 30 mL
0.05 mmolL-1 Fe-EDTA was applied uniformly to the topsoil. Finally, each rhizotron
was irrigated pre-sowing with 6 L distilled H2O. The bulk density of soil was 1.4 g
cm-3 and the gravimetric moisture content was 120 g kg-1. A groove in the topsoil 60
cm long, 1 cm wide, 2 cm deep and 2 cm from the glass plate was made in each
rhizotron, and 30 seeds were sown evenly in the groove and covered lightly with soil.
Each rhizotron was covered with a thin plastic film until the seeds germinated (~2 d).
The seeds were sown on Oct. 23th 2013. Two weeks after germination, seedlings
were thinned to nine plants per rhizotron, and after a further three weeks, thinned to
three plants per rhizotron.
The rhizotrons were arranged in a fully randomized design with three replications.
flowering, silique and ripening stages of each treatment were sampled respectively.
Because P deficiency delayed the reproductive growth period of oilseed rape,
sampling times at LP were delayed by 22 d at budding stage, 6 d at bolting stage and
1 d at flowering stage.
Root system architecture (RSA) analysis and data collection
(1)Polycarbonate plate root system architecture
Before sampling, the black blow molding boards attached to the polycarbonate plate
were removed and polyester paper (670 mm wide × 1000 mm long) was attached to
the glass plate. The root morphology was then traced with a marker with 0.2 mm
width (Creative Wealth Stationery Co., ltd, Shaoguan, Guangdong, China). The
whole root and two edges of the wider roots were all traced. Each sheet of polyester
paper was then scanned with A0 size scanner (SmartLF GX+42C, Colortrac,
Cambridge, UK) and a gray scale image was taken at a resolution of 400 dpi. Images
were saved in JPG format and then converted to BMP format by image binarization
with ArcMap V9 software (ArcGIS, Environmental Systems Research Institute, Inc.,
Redlands, CA, USA). Total root length (TRL, m) and the number of root tips (RTN)
were determined with WinRHIZO program (Regent Instruments Inc., Quebec,
Canada). Root length from the top to the bottom of each image was calculated in 5
cm sections and polycarbonate plate root length density (RLD, mm/mm2) = root
length (mm) / analyzed area (mm2).
9 (2) Excavated root system architecture
After shoots were sampled, the polycarbonate plate was removed. The entire root
system was taken out of the soil carefully and cleaned with tap water once and
distilled H2O twice immediately. Root diameter distributions were measured using
Vernier calipers (Everpower-557115, Lishui, Guangdong, China). First, lateral roots
were cut from the main root. For each lateral root, the diameter was measured at the
point of intersection with the main root in three rotational positions. Then, the root
was put in a clear perspex tray with a film of distilled H2O and scanned with a
modified flatbed scanner (Epson V700, Nagano-ken, Japan) at 400 dpi. Larger root
systems were divided into several sections and scanned one-by-one. The images of
roots were analyzed with WinRHIZO software (Regent Instruments Inc., Quebec,
Canada).
Agronomic traits
(1) Biomass measurement
From seedling to flowering stages, the plants were divided into shoot, (mature)
hypocotyl and root, respectively, and the samples were cleaned with distilled H2O.
Because almost all the leaves had senesced at silique stage, typical of oilseed rape,
the shoot was divided into pod and straw at silique stage; and straw, pericarp and
seed at harvest stage, respectively. Samples were oven-dried at 105°C for 30 min,
then at 65°Cfor 48 h, to constant mass. Dried samples were weighed and ground to a
Jinghai, Tianjin, China).
(2) Seed-yield and yield-related traits
Plant height (PH) and branch number (BN) per plant were measured before harvest.
Stems were then cut, pod number (PN) per plant and pod number of main
inflorescence (PNM) were counted. 25 siliques from each plant were sampled
randomly and seed numbers counted. After a subsequent ripening period (typically
two weeks), all siliques from each plant were threshed and total seed yield and
1000-seed weight determined.
(3) Determination of tissue P concentration
A micro-Kjeldahl method was used to determine P concentration in plant tissues.
First, 0.1 g ground sample and 5 mL 98% H2SO4 were added into a 50 mLdigestion
tube and shaken for 10 h. Then, the digestion tube was put in the heating block and
digested at 250°C for 2 h with 5-10 drops of H2O2 added. Finally, 4 mL digested
solution from each tube was taken out and diluted with 6 mL distilled water to
determine P concentration using a Continuous-Flow injection analyzer (AA3, Seal
Analytical GmbH, Bran, Germany).
Calculations and analysis
The following equation was used to calculate the physiological P use efficiency
11
<<TYPESETTER:PLEASE INSERT EQUATION 1 HERE>>
Statistical analyses
We used Genstat®V16 (VSN International, Oxford, UK) to analyze the data. Analysis
of variance (ANOVA) was used to identify significant differences (P= 0.05) in the
investigated traits among treatments and growth periods. The least significant
difference (LSD) had also been conducted to test the significant difference in the
root length density in the same soil depth between LP and HP. Figures were made
using Sigma Plot 11 (Systat Software Inc., Chicago, Illinois).
RESULTS
Large rhizotron system enables efficient phenotyping root system architecture
Polycarbonate plate root system architecture (plate RSA) including total root length
(TRL) and the number of root tips (RTN) (Fig. 2B, D) showed similar trends to
excavated-RSA traits (Fig. 2A, C) during the entire growth cycle. Both plate RSA
and excavated RSA traits indicated that P deficiency inhibited root development
during the entire growth cycle except for TRL and RTN based on plate RSA at
silique stage (Fig. 2).
At LP, the maximum values of TRL and RTN of excavated-RSA and plate RSA
traits occurred at the silique stage (Fig. 2). However, at HP, the maximum values of
excavated-RSA traits were observed at flowering stage and plate RSA traits at the
bolting stage (Fig. 2). Although, there was no significant difference observed in RTN
excavated-RSA traits was observed during this period.
Root system architecture (RSA) of cv. Zhongshuang 11 during growth under
contrasting phosphate availabilities
The TRL and RTN increased rapidly at HP from the seedling stage and reached a
maximum at flowering stage (Fig. 2A, C). These root traits then declined from
flowering to silique stages and finally increased slightly from silique to harvest
stages. In contrast, TRL and RTN at LP increased much more slowly from seedling
to silique stages, and then decreased significantly from silique to harvest stages (Fig.
2A, C). Both TRL and RTN at HP were higher than at LP throughout growth,
notably at flowering and ripening stages.
Total root number and root number within each diameter range of 2-5 mm and 5-
10 mm decreased from flowering to silique stages, and then increased from silique to
harvest stages at HP (Fig. 3A), however, no significant differences were observed in
all above-mentioned root traits at LP. Moreover, root numbers within each diameter
range, e.g. 2-5 mm, 5-10 mm, >10 mm at LP were lower than that at HP for each
growth period (Fig. 3A). Roots in the diameter range 2-5 mm accounted for around
50% of the total root number at both LP and HP. In addition, RDW of each root
diameter range of <2 mm, 2-5 mm, 5-10 mm and >10 mm were greater at HP than at
LP in flowering, silique and ripening stages (Fig. 3B). RDW within root diameter
range >10 mm accounted for approximately 60% of the total DW at HP and 50% of
13
Dynamic changes in root length density (RLD) in different soil depths occurred
throughout growth in both P treatments (Fig. 4). At the seedling stage, peak RLD
occurred in soil depth of 10 cm in both P treatments. RLD then declined sharply
from soil depth of 10 cm to 40 cm in both P treatments. The RLD at HP was much
greater than at LP from soil depths 0 to 25 cm, but slightly less than at LP from soil
depths 30 to 45 cm (Fig. 4A). From budding to harvest stages,there were two peaks
of RLD, one in soil depth of ~20 cm and another ranged in soil depths 60 to 80 cm,
under both P conditions (Fig. 4B-F). The RLD at HP was greater than that at LP in
almost all the soil layers from budding to flowering stages. At the silique stage, RLD
at LP was slightly greater than at HP from soil depth 0 to 30 cm. However, there
were no significant differences in RLD between LP and HP treatments from soil
depths 30 to 75 cm at the silique stage (Fig. 4E). At the ripening stage, there was no
significant difference in RLD between LP and HP from soil depths 0 to 15 cm, RLD
at HP was slightly higher than that at LP from soil depths 20 cm to 80 cm (Fig. 4F).
The average RLD of ZS11 at HP increased markedly from 0.015 mm mm-2 at
seedling stage to 0.098 mm mm-2 at the bolting stage. It then declined to 0.058 mm
mm-2 at the silique stage and finally increased to 0.070 at the ripening stage. The
average RLD at LP increased constantly from 0.012 mm mm-2 at the seedling stage
to 0.064 mm mm-2 at the silique stage, and then it decreased to be 0.053 mm mm-2 at
ripening stage (Table 1). On the basis of this contrasting P availability in the top soil
together with dynamic variation of RLD in different soil depths, the spatial
HP. These results show that our rhizotron system can be used to identify valuable
root traits related to P accessibility.
Root and shoot biomass of cv. Zhongshuang 11 during growth under contrasting
phosphate availabilities
Root dry weight (RDW) at HP was significantly greater than at LP throughout the
entire growth period (Fig. 5A). RDW at HP increased rapidly from seedling to
bolting stages and then increased slowly from bolting to silique stages, and finally
declined slightly from silique to ripening stages. However, at LP, RDW increased
slowly from seedling to flowering stages, then decreased rapidly from flowering to
silique stages, and finally increased from silique to ripening stages (Fig. 5A).
Shoot dry weight (SDW) at HP increased rapidly from seedling to bolting stages
and then increased more slowly from bolting to silique stages, and finally decreased
slightly from silique to ripening stages (Fig. 5B). At LP, SDW increased slowly from
seedling to silique stages, then decreased slightly from silique to ripening stages,
which in contrast to the increased trend of RDW at silique stage (from flowering to
ripening stages) at LP (Fig. 5B). At HP, the DW of pod and straw at silique stage and
DW of pericarp, seed, and straw at ripening stage were greater than that at LP (Fig.
5C).
The root:shoot biomass ratio (R/S ratio) increased considerably from seedling to
flowering stages at HP, while at LP, the R/S ratio firstly declined slightly from
15
LP and HP, R/S ratio declined from flowering to silique stages and finally increased
slightly from silique to ripening stages (Fig. 5D). The R/S ratios at LP were
significantly greater than those at HP from seedling to bolting stages, and were much
less than at HP from silique to ripening stages (Fig. 5D).
Seed yield of ZS11 at HP was about three times greater than at LP (Table 2).
Almost all the yield components at LP were far less than that at HP, such as number
of primary branches per plant (BN), pod number per plant (PN), 1000-seed weight,
seed number per pod (SN), yet, the height to the first primary branch (FBH) at LP
(56.3±1.6 cm) was slight higher than that at HP (48.4±2.5 cm). There was no
significant difference in pod number of main inflorescence (PNM) between LP and
HP.
Physiological phosphorus use efficiency of cv. Zhongshuang 11 during growth under
contrasting phosphate availabilities
Root and (mature) hypocotyl P concentration decreased continually from seedling to
ripening stages at both LP and HP (except at budding stage at HP). Additionally, root
and (mature) hypocotyl P concentrations at LP were less than those at HP, notably
from seedling to late flowering stages (Fig. 6A, B). Root P content increased
considerably from seedling to bolting stages, and then declined to silique stage at HP
(Table 3). Root P content increased from seedling to budding stages at LP, then
progressed slightly from budding to silique stages, and finally declined a little from
hypocotyl P content at LP were much lower than those at HP (Table 3).
Shoot P concentration at HP decreased from seedling to bolting stages, and then
increased slightly from bolting to flowering stages (Fig. 6C). In contrast, shoot P
concentration at LP decreased sharply from seedling to budding stages, and then
continued to decline from budding to flowering stages. Shoot P concentration at HP
was greater than at LP from seedling to flowering stages, and shoot P contents at HP
were far higher than at LP during the whole growth period except for at early
seedling stage. Pod and seed accounted for high proportion in P concentrations and
contents at silique and ripening stages (Fig. 6D).
Physiological P use efficiency (PPUE) of roots increased more rapidly at HP than
at LP from budding to ripening stages (Fig. 7A). The PPUE of (mature) hypocotyl
were much greater at HP than at LP from flowering to ripening stages (Fig. 7B).
Shoot PPUE increased from seedling to bolting stages at HP, and then declined
slightly from bolting to flowering stages (Fig. 7C). At LP, PPUE of shoot increased
much slowly than at HP from seedling to flowering stages. The PPUE of pod and
straw at silique stage, straw and seed at ripening stage, were much higher at HP than
at LP (Fig. 7D).
DISCUSSION
Brassica-rhizotron system
Several approaches for phenotyping root system architecture (RSA) from lab to field
17
2010), paper culture (Hammond et al., 2009; Yang et al., 2010; Adu et al. 2014;
Thomas et al., 2016) or clear gel media (Bengough et al., 2004; Iyer-Pascuzzi et al.,
2010; Shi et al., 2013c) can be used to remove the influence of complex soil
environments on root growth. Plants cultivated in sand-filled pots or PVC tubes
could be used to predict root development of plants in more complex substrates (Zhu
et al., 2011). In the field, transparent tubes (minirhizotrons) can be used to
investigate the roots which touch the tube and so can be well-suited for studying fine
roots (Iyer-Pascuzzi et al., 2001). Additionally, wall techniques or root windows can
be used to create an observing plane to detect root growth along soil profiles
(Polomski and Kuhn, 2002). Other promising technologies, such as X-ray computed
tomography (CT) or Magnetic resonance imaging (MRI) are promising tools for
visualizing plant root systems within their natural soil environment noninvasively
(Tracy et al., 2010; Mairhofer et al., 2012). The overarching characteristic of RSA
studies in the field is that it is logistical challenging to adequately assess RSA
throughout growth. Utilizing and combining different imaging systems, integrating
measurements and image analysis where possible, and amalgamating data will allow
researchers to gain a better understanding of root:soil interactions (Downie, et al.,
2015).
The Brassica-rhizotron system used in this study was specifically designed to
satisfy routine evaluation of roots growth of oilseed rape in soil environment
throughout an entire growth period (Fig. 1). Whilst most of the roots of oilseed rape
lateral roots of each plant did not touch the transparent plate. Furthermore, during
plant development, the ratio of the roots observed at the transparent plate decreased.
However, at both P levels, dynamic changes of TRL and RTN observed on the
polycarbonate plate-RSA exhibited the same trend with the parameters of
excavated-RSA during the whole growth stage (Fig. 2). These indicated that our
rhizotron system could be used to conduct non-destructive root system phenotyping
using polycarbonate plate RSA root parameters as a proxy.
Root system growth
Allen and Morgan (1975) identified two phases of root growth in oilseed rape, one
up to anthesis and another 2 weeks post-anthesis. Other studies demonstrated that
root biomass of oilseed rape progressed to the maximum at late-flowering (Gan et al.,
2009) or silique stages (Wang et al., 2014) and then decreased. Our study indicated
that the maximum value of RDW occurred at the silique stage at HP, but occurred
earlier at LP, at the flowering stage (Fig. 5A). However, the DW of lateral roots with
diameter <2 mm, 2-5 mm, 5-10 mm and 10-15 mm was much higher at flowering
than at silique stage at both P levels (Fig. 3B). These indicated that lateral root,
rather than primary root, plays a vital role in the construction of root morphology
and root biomass. Root length density of oilseed rape typically decreases
exponentially with soil depth (Yu et al., 2007; Whalley et al., 2008; Liu et al., 2011).
In our study, the decrease in RLD was not smooth from bolting to silique stages (Fig.
19
distribution in the soil affected by irrigation (White and Kirkegaard 2010; Jin et al.,
2015).
Effect of low phosphorus on the root and shoot growth of oilseed rape
Root and shoot biomass was less under P deficiency throughout the entire growth
period. Moreover, the difference between the two P treatments increased during
growth (Fig. 5). Lower biomass accumulation could be the result of reduced net
photosynthesis (source limitation), but may also be due to direct negative effects of
low P availability on growth (sink limitation). Reductions in root growth of rice
under P deficiency were not caused by source limitations, but were due to a more
direct effect of low P availability on growth. Even at sub-optimal tissue P
concentrations <0.7 mg P g-1 DW, plants are able to produce enough assimilates to
sustain growth that is limited directly by low P availability (Wissuwa et al. 2005). In
this study, the P concentrations of (mature) hypocotyl, root and shoot were far more
than 0.7 mg P g-1 DW from seedling to flowering stages (Fig. 6A-C). During the
silique and ripening stages, although the straw concentration were less than 0.7 mg P
g-1 DW, there were no significant differences in the straw concentration between at
LP and at HP (Fig. 6D).
The R/S ratio reached a maximum value at the flowering stage at both LP and HP.
Moreover, the R/S ratios at LP were much higher than that at HP from seedling to
bolting stages (Fig. 5D). The increase in R/S ratio under P starvation is due to the
Hermans et al., 2006; Hammond and White, 2008, 2011). Observations showed that
both root and shoot growth are directly affected by Pi availability and that the
increase in R/S ratio frequently observed under P deficiency is causally due to P
rather than carbohydrate partitioning to roots (Wissuwa et al., 2005). However, in this study, the R/S ratios at LP were much lower than at HP from flowering to
ripening stages (Fig. 5D). The reason could be attributed to reduction of RDW and
relatively higher increase of SDW at LP as compared with that at HP (Fig. 5 A and
B). This pattern suggested that root growth is tightly associated with shoot
development during the early vegetative period and then the relationship weakens
during the reproductive growth stage, which is consistent with previous studies
(Snapp and Shennan, 1992; Wells and Eissenstat, 2003; Peng et al., 2010). Total root
length (TRL), root tip number (RTN) and root length density (RLD) of oilseed rape
were reduced under P deficiency across almost all growth stages (Figs. 2 and 5;
Table 1), and decreased P uptake (Fig. 6) and root growth (Fig. 5), leading to
reduced shoot growth (Fig. 5), PPUE of tissues (Fig. 7) and seed yield (Table 2).
Large amounts of photosynthate are likely to be transferred preferentially to
developing pods on the main inflorescence, rather than to maintain root growth
under low P stress at pod-filling stage (Fig. 5; Table 2).
Conclusions
Our new large rhizotron system (~118 L) provides an effective and efficient
21
therefore helps to bridge the gap between lab and field study of roots. Total root
length, root tip number, root and shoot DW of oilseed rape under P deficient
condition were reduced throughout growth. Interestingly, P deficiency also showed
that root senescence is likely to occur earlier under low P conditions, which is crucial
for water and mineral nutrients uptake and the production of seed yield (Blum, 2005;
Foulkes et al., 2009; White et al., 2015).
ACKNOWLEDGMENTS
The authors acknowledge the financial support from National Nature Science
Foundation of China (grant number 31471933), New Century Excellent Talents in
University of Ministry of Education of China (grant number NCET-13-0809),
Natural and Fundamental Research Funds for the Central Universities of China
(grant numbers 2012PY006 and 2014PY020).
LITERATURE CITED
Adu MO, Chatot A, Wiesel L, Bennett MJ, Broadley MR, White PJ, Dupuy LX.2014. A scanner system for high-resolution quantification of variation in root growth dynamics of Brassicarapa genotypes. Journal of Experimental Botany65: 2039-2048.
Akhtar MS, Oki Y, Adachi T. 2008. Genetic variability in phosphorus acquisition and utilization efficiency from sparingly soluble P-sources by Brassica cultivars under P-stress environment. Journal of Agronomy and Crop Science194: 380-392.
Allen EJ, Morgan DG.1975. A quantitative comparison of the growth, development and yield of different varieties of oilseed rape. The Journal of Agricultural Science85: 159-174.
Bengough AG, Gordon DC, Al-Menaie H, Ellis RP, Allan D, Keith R, Thomas WTB, Forster BP. 2004. Gel observation chamber for rapid screening of root traits in cereal seedlings. Plant and Soil262: 63-70.
Review of Plant Physiology24: 225-252.
Blum A. 2005. Drought resistance, water-use efficiency, and yield potential—are they compatible, dissonant, or mutually exclusive? Australian Journal of Agricultural Research
56: 1159-1168.
Bonser AM, Lynch J, Snapp S.1996. Effect of phosphorus deficiency on growth angle of basal roots of Phaseolus vulgaris. New Phytologist132: 281-288.
Cheema MA, Malik MA, Hussain A, Shah SH, Basra SMA.2001. Effects of time and rate of nitrogen and phosphorus application on the growth and the seed and oil yields of canola (Braaica napus L.). Journal of Agronomy and Crop Science186: 103-110.
Ding GD, Zhao ZK, Liao Y, Hu YF, Shi L, Long Y, Xu FS.2012. Quantitative trait loci for seed yield and yield-related traits, and their responses to reduced phosphorus supply in Brassica napus. Annals of Botany109: 747-759.
Downie HF, Adu MO, Schmidt S, et al.2015. Challenges and opportunities for quantifying roots and rhizosphere interactions through imaging and image analysis. Plant, Cell & Environment 38: 1213-1232.
Fang Z, Shao C, Meng Y, Wu P, Chen M.2009. Phosphate signaling in Arabidopsis and Oryza sativa. Plant Science176: 170-180.
Fender AC, Gasert D, Jungkunst HF, et al. 2013. Root-induced tree species effects on the source/sink strength for greenhouse gasses (CH4, N2O and CO2) of a temperate deciduos
forest soil. Soil Biology and Biochemistry57: 587-597.
Foulkes MJ, Hawkesford MJ, Barraclough PB, Holdsworth MJ, Kerr S, Kightley S, Shewry PR. 2009. Identifying traits to improve the nitrogen economy of wheat: recent advances and future prospects. Field Crops Research114: 329-342.
Fredeen AL, Rao IM, Terry N.1989. Influence of phosphorus nutrition on growth and carbon partitioning in Glycine max. Plant Physiology89: 225-230.
Gan YT, Campbell CA, Janzen HH, Lemke R, Liu LP, Basnyat P, McDonald CL. 2009.
Root mass for oilseed and pulse crops: growth and distribution in the soil profile. Canadian Journal of Soil Science80: 179-192.
Gericke WF.1937. Hydroponics-crop production in liquid culture media. Science85: 177-178.
Giehl RFH, Gruber BD, von Wiren N. 2014. It’s time to make changes: modulation of root system architecture by nutrient signals. Journal of Experimental Botany65: 769-778.
Hammond JP, Broadley MR, White PJ, et al. 2009. Shoot yield drives phosphorus use efficiency in Brassica oleracea and correlates with root architecture traits. Journal of Experimental Botany60: 1953-1968.
23 availability. Plant Physiology 156: 1033-1040.
Hermans C, Hammond JP, White PJ, Verbruggen N.2006. How do plants respond to nutrient shortage by biomass allocation? Trends in Plant Science11: 610-617.
Hoffland E, Findenegg GR, Nelemans JA.1989. Solubilization of rock phosphate by rape. Ⅱ. Local root exudation of organic acids as a response to P starvation. Plant and Soil 113: 161-165.
Iyer-Pascuzzi AS, Symonova O, Mileyko Y, et al. 2001. Advancing fine root research with minirhizotrons. Environmental and Experimental Botany45: 263-289.
Iyer-Pascuzzi AS, Symonova O, Mileyko Y, et al.2010. Imaging and analysis platform for automatic phenotyping and trait ranking of plant root systems. Plant Physiology 152: 1148-1157.
Jin KM, Shen JB, Ashton RW, et al. 2015. Wheat root growth responses to horizontal stratification of fertiliser in a water-limited environment. Plant and Soil386: 77-88.
Liu LP, Gan YT, Bueckert R, Rees KV.2011. Rooting systems of oilseed and pulse crops. II: vertical distribution patterns across the soil profile. Field Crops Research122: 248-255.
Lynch JP, Brown KM. 2001. Topsoil foraging- an architectural adaptation of plants to low phosphorus availability. Plant and Soil237: 225-237.
Lynch JP, Brown KM. 2008. Root strategies for phosphorus acquisition. In: White PJ, Hammond JP, eds. The ecophysiology of plant-phosphorus interactions. Dordrecht, the Netherlands: Springer, 83-116.
Mairhofer S, Zappala S, Tracy SR, et al. 2012. RooTrak: Automated recovery of three-dimensional plant root architecture in soil from X-ray microcomputed tomography images using visual tracking. Plant Physiology158: 561–569.
Malamy JE. 2005. Intrinsic and environmental response pathways that regulate root system architecture. Plant, Cell and Environment28: 67-77.
Marschner H.2012. Mineral nutrition of higher plants. 3nd edn. London: Academic Press.
Mollier A, Pellerin S. 1999. Maize root system growth and development as influenced by phosphorus deficiency. Journal of Experimental Botany50: 487-497.
Nagel KA, Putz A, Gilmer F, et al. 2012. Growscreen-rhizo is a novel phenotyping robot enabling simultaneous measurements of root and shoot growth for plants grown in soil-filled rhizotrons. Functional Plant Biology39: 891-904.
Pearse SJ, Veneklass EJ, Cawthray GR, Bolland MDA, Lambers H. 2006. Carboxylate release of wheat, canola and 11 grain legume species as affected by phosphorus status. Plant and Soil288: 127-139.
Peng YF, Yu P, Zhang Y, et al.2012. Temporal and spatial dynamics in root length density of field-grown maize and NPK in the soil profile. Field Crops Research131: 9-16.
Peret B, Clement M, Nussaume L, Desnos T. 2011. Root developmental adaptation to phosphate starvation: better safe than sorry. Trends in Plant Science16: 442-450.
Polomski J, Kuhn N.2002. Root research methods. In: Wsisel Y et al., eds. Plant roots the hhiden half, 3rd edn. New York, USA: Marcel Dekker, 295-321.
Raghothama KG.1999. Phosphate acquisition. Annual Review of Plant Physiology and Plant Molecular Biology50: 665-693.
Rose TJ, Impa SM, Rose MT, et al. 2012. Enhancing phosphorus and zinc acquisition efficiency in rice: a critical review of root traits and their potential utility in rice breeding. Annals of Botany112: 331-345.
Rubio G, Liao H, Yan X, Lynch JP.2003. Topsoil foraging and its role in plant competitiveness for phosphorus in common bean. Crop Science43: 598-607.
Sanchez-Calderon L, Lopez-Bucio J, Chacon-Lopez A, et al. 2005. Phosphate starvation induces a determinate developmental program in the roots of Arabidopsis thaliana. Plant and Cell Physiology46: 174-174.
Shi TX, Li RY, Zhao ZK, et al.2013a. QTL for yield traits and their association with functional genes in response to phosphorus deficiency in Brassicanapus. PLoS One8: e54559.
Shi TX, Zhao DY, Li DX, et al.2013b.Brassica napus root mutants insensitive to exogenous cytokinin show phosphorus efficiency. Plant and Soil358: 61-74.
Shi L, Shi TX, Broadley MR, et al.2013c. High throughput root phenotyping screens identify genetic loci associated with root architectural traits in Brassica napus under contrasting phosphate availabilities. Annals of Botany112: 381-389.
Snapp S, Shennan C.1992. Effects of salinity on root growth and death dynamics of tomato Lycopersicon esculentum Mill. New Phytologist121: 71-79.
Svistoonoff S, Creff A, Reymond M, et al.2007. Root tip contact with low-phosphate media reprograms plant root architecture. Nature Genetics39: 792-796.
Ticconi CA, Delatorre CA, Lahner B, Salt DE, Abel S. 2004. Arabidopsis pdr2 reveals a phosphate-sensitive checkpoint in root development. The Plant Journal37: 801-814.
Thomas CL, Graham NS, Hayden R, Meacham MC, Neugebauer K, Nightingale M, Dupuy LX, Hammond JP, White PJ, Broadley MR. 2016. High throughput phenotyping (HTP) identifies seedling root traits linked to variation in seed yield and nutrient capture in field-grown oilseed rape (Brassica napus L.). Annals of Botany, in press.
25
crops. In: Harapiak JT. ed. Oilseed and pulse crops in western Canada- a symposium. Calgary, Alberta: Western Cooperative Fertilizers Ltd, 325-374.
Vance CP. 2001. Symbiotic nitrogen fixation and phosphorus acquisition: plant nutrition in a world of declining renewable resources. Plant Physiology127: 390-397.
Wang Y, Liu T, Li XK, Ren T, Cong RH, Lu JW.2014. Nutrient deficiency limits population development, yield formation, and nutrient uptake of direct sown winter oilseed rape. Journal of Integrative Agriculture14: 670-680.
Wells CE, Eissenstat DM.2003. Beyond the roots of young seedlings: the influence of age and order on fine root physiology. Plant Growth Regulation21: 324-334.
White CA, Sylvester-Bradley R, Berry PM. 2015. Root length densities of UK wheat and oilseed rape crops with implications for water capture and yield. Journal of Experimental Botany 66: 2293-2303.
Whalley WR, Watts CW, Gregory AS,et al. 2008. The effect of soil strength on the yield of wheat. Plant and Soil306: 237-247.
White PJ, George TS, Gregory PJ, Bengough GA, Hallett PD, McKenzie BM. 2013.
Matching roots to their environment. Annals of Botany112: 207-222.
White RG, Kirkegaard JA. 2010. The distribution and abundance of wheat roots in a dense, structured subsoil-implications for water uptake. Plant, Cell and Environment 33: 133-148.
Williamson LC, Ribrioux SPCP, Fitter AH, Leyser HMO. 2001. Phosphate availability regulates root system architecture in Arabidopsis. Plant Physiology126: 875-882.
Wissuwa M, Gamat G, Ismail AM.2005. Is root growth under phosphorus deficiency affected by source or sink limitations? Journal of Experimental Botany56: 1943-1950.
Wu P, Shou HX, Xu GH, Lian XM.2013. Improvement of phosphorus efficiency in rice on the basis of understanding phosphate signaling and homeostasis. Current Opinion in Plant biology16: 205-212.
Yang M, Ding GD, Shi L, Feng J, Xu FS, Meng JL. 2010. Quantitative trait loci for root morphology in response to low phosphorus stress in Brassica napus. Theoretical and Applied Genetics121: 181-193.
Yan XL, Wu P, Ling HQ, Xu GH, Xu FS, Zhang QF.2006. Plant nutriomics in China: An overview. Annals of Botany98: 473-482.
Yu GR, Zhuang J, Nakayama K.2007. Root water uptake and soil water profile as affected by vertical root distribution. Plant Ecology189: 15-30.
Zhang FS, Ma J, Cao YP. 1997. Phosphorus deficiency enhances root exudation of low-molecular weight organic acids and utilization of sparingly soluble inorganic phosphates by radish (Raphanus sativus L.) and rape (Brassica napus L.) plants. Plant and Soil196: 261-264.
42
TABLE 1. Root length density of cv. Zhongshuang 11 (Brassica napus L.) at LP (low
phosphorus) and at HP (high phosphorus)
Growth Stage
Seedling Budding Bolting Flowering Silique Ripening
HP 0.015±0.002 a 0.062±0.005 a 0.098±0.009 a 0.079±0.002 a 0.058±0.0006 a 0.070±0.0009 a
LP 0.012±0.0006 a 0.029±0.003 b 0.037±0.003 b 0.041±0.005 b 0.064±0.001 b 0.053±0.006 b
Note: Root length density (mm·mm-2) = total root length (mm) / total root area (mm2) .
Values are mean±SE of 27 plants at the seedling stage and nine plants during the budding,
bolting, flowering, silique and ripening stages. Different lower case letters denote significant
TABLE 2.Seed yield and yield components of cv. Zhongshuang 11 (Brassica napus L.) at LP
(low phosphorus) and at HP (high phosphorus)
LP HP
SY 11.6±0.8 b 35.6±1.7 a
BN 4.0±0.3 b 8.7±0.6 a
PN 141.3±17.4 a 368.0±31.4 a
PNM 62.0±3.9 a 66.2±4.6 a
SW 3.4±0.1 b 4.0±0.1 a
SN 21.1±0.9 b 23.6±0.3 a
Note: Seed yield (g; SY), number of primary branches per plant (n; BN), pod number per
plant (n; PN), pod number of main inflorescence (n; PNM), seed weight of 1,000 seeds (g per
1000 seeds; SW), seed number per pod (n; SN). Values are mean ± SE of nine plants.
44
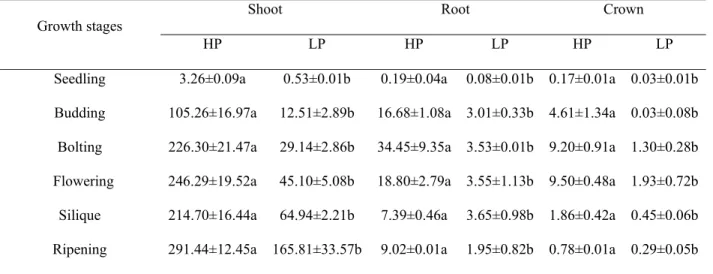
TABLE 3. P content of cv. Zhongshuang 11 (Brassica napus L.) at LP (low phosphorus) and
at HP (high phosphorus).
Growth stages Shoot Root Crown
HP LP HP LP HP LP
Seedling 3.26±0.09a 0.53±0.01b 0.19±0.04a 0.08±0.01b 0.17±0.01a 0.03±0.01b Budding 105.26±16.97a 12.51±2.89b 16.68±1.08a 3.01±0.33b 4.61±1.34a 0.03±0.08b Bolting 226.30±21.47a 29.14±2.86b 34.45±9.35a 3.53±0.01b 9.20±0.91a 1.30±0.28b Flowering 246.29±19.52a 45.10±5.08b 18.80±2.79a 3.55±1.13b 9.50±0.48a 1.93±0.72b Silique 214.70±16.44a 64.94±2.21b 7.39±0.46a 3.65±0.98b 1.86±0.42a 0.45±0.06b Ripening 291.44±12.45a 165.81±33.57b 9.02±0.01a 1.95±0.82b 0.78±0.01a 0.29±0.05b
Note: Values are mean±SE of 27 plants at the seedling stage and nine plants during the
budding, bolting, flowering, silique and ripening stages. Different lower case letters denote
FIG. 1. Rhizotron. (A) The container (up to a volume of ~118 L) (1) with dimensions 670
mm wide×180 mm deep×1000 mm height has a piece of transparent polycarbonate attached
(1b), a hollow steel tube¢50 mm×7 mm used to support the rhizotron (2) and two
concrete-sustained walls (850 mm height) with grooves (3) 1a, a drain valve; 1d, screw; 1e,
clamp. (B) An installation diagram of the rhizotron. 1b, transparent polycarbonate; 1c, a
piece of black blow molding board; 1e, clamp. (C) Polycarbonate plate root system
architecture (plate RSA) of Zhongshuang 11 (Brassica napus L.) at the budding stage at high
phosphorus (HP), 134 d after sowing. Primary roots (ⅰ) and lateral (ⅱ) roots are indicated.
(D) The BMP format image of plate RSA.
FIG. 2.Dynamics of total root length (A, B) and root tip number (C, D) of cv.Zhongshuang
11 (Brassica napus L.) grown in rhizotrons at low (LP) and high (HP) phosphorus treatments.
A and C show the root traits excavated from soil. B and D show the root traits traced on the
polycarbonate plate. Values are mean±SE of 27 plants at the seedling stage and nine plants
during the budding, bolting, flowering, silique and ripening stages. The error bars indicate the
standard error of the mean.
FIG. 3.Number (A) and dry weight (B) of lateral roots of different diameter ranges of cv.
Zhongshuang 11 (Brassica napus L.) at low (LP) and high (HP) phosphorus treatments, from
flowering to ripening stages from excavated soils. Fig. 3 A does not include numbers of
lateral roots with diameter <2 mm because they are too numerous to calculate. Values are
mean±SE of 27 plants at the seedling stage and nine plants during the budding, bolting,
flowering, silique and ripening stages. Different lower case letters on right side of the bar
46
FIG. 4. Root length density of cv.Zhongshuang 11 (Brassica napus L.) at different soil depths
at low (LP) and high (HP) phosphorus treatments. Growth stages are separated as panels A,
seedling; B, budding; C, bolting; D, flowering; E, silique; F, ripening. Root length density is
calculated based on the polycarbonate plate root traits. Values are mean±SE of 27 plants at the
seedling stage and nine plants during the budding, bolting, flowering, silique and ripening
stages. The vertical bar in the figures indicate the size of the least significant differences
(LSD) to allow comparison of any two means each growth stage.
FIG. 5.Root dry weight (A), total plant dry weight (B), shoot dry weight (C) and root:shoot
biomass ratio (D) of Zhongshuang 11 (Brassica napus L.) at different growth stages at low
(LP) and high (HP) phosphorus treatments. Values are mean±SE of 27 plants at the seedling
stage and nine plants during the budding, bolting, flowering, silique and ripening stages. The
error bars indicate the standard error of the mean.
FIG. 6. P concentration in root (A), (mature) hypocotyl (B) and shoot (C, D) of cv.
Zhongshuang 11 (Brassica napus L.) during grown at low (LP) and high (HP) phosphorus
treatments. Values are mean±SE of 27 plants at the seedling stage and nine plants during the
budding, bolting, flowering, silique and ripening stages. The error bars indicate the standard
error of the mean.
FIG. 7.Physiological P use efficiency (PPUE) of root (A), (mature) hypocotyl (B) and shoot
(C, D) of cv. Zhongshuang 11 (Brassica napus L.) grown at low (LP) and high (HP)
phosphorus treatments.Values are mean±SE of 27 plants at the seedling stage and nine plants
during the budding, bolting, flowering, silique and ripening stages. The error bars indicate the
R o o t ti p n u m b e r 100 200 300 400 500 600 HP LP R o o t ti p n u m b e r 0 5000 10000 15000 20000 25000 30000 35000 HP LP T o ta l ro o t le n g th ( m ) 0 4 8 12 16 20 HP LP T o ta l ro o t le n g th ( m ) 0 30 60 90 120 150 180 HP
LP
A
B
C
D
FIG. 3
L a te ra l ro o t n u m b e r ( N o . ) 0 5 10 15 20 25 30 >10 mm 5-10 mm 2-5 mm Growth stages L a te ra l ro o t d ry w e ig h t ( g p la n t-1 )
0 5 10 15 20 10-15 mm 5-10 mm 2-5 mm < 2 mm
HP LP HP LP HP LP HP LP HP LP HP LP
A
B
a
a
a
b
b
b
a
a
a
a
b
b
b
b
a
a
a
b
0.00 0.02 0.04 0.06 0.08 0.10 0.12 0 20 40 60 80 100
0.00 0.02 0.04 0.06 0.08 0.10 0.12 0 20 40 60 80 100
0.00 0.02 0.04 0.06 0.08 0.10 0.12 0 20 40 60 80 100
0.00 0.02 0.04 0.06 0.08 0.10 0.12 0 20 40 60 80 100
0.00 0.02 0.04 0.06 0.08 0.10 0.12 0 20 40 60 80 100 0.00 0.02 0.04 0.06 0.08 0.10 0.12
0 20 40 60 80 100 HP LP LSD