First trimester serum tests for Down’s syndrome screening
(Review)
Alldred SK, Takwoingi Y, Guo B, Pennant M, Deeks JJ, Neilson JP, Alfirevic Z
This is a reprint of a Cochrane review, prepared and maintained by The Cochrane Collaboration and published inThe Cochrane Library 2015, Issue 11
http://www.thecochranelibrary.com
T A B L E O F C O N T E N T S
1 HEADER . . . .
1
ABSTRACT . . . .
2
PLAIN LANGUAGE SUMMARY . . . .
3
BACKGROUND . . . .
5
OBJECTIVES . . . .
6 METHODS . . . .
9 RESULTS . . . .
Figure 1. . . 10
Figure 2. . . 12
21 DISCUSSION . . . . 22 AUTHORS’ CONCLUSIONS . . . . 22 ACKNOWLEDGEMENTS . . . . 23 REFERENCES . . . . 56 CHARACTERISTICS OF STUDIES . . . . 161 DATA . . . . Test 1. 1T PAPP-A, 5% FPR. . . 166
Test 2. 1T PAPP-A,≤5th percentile. . . 166
Test 3. 1T PAPP-A, mixed cut-points. . . 167
Test 4. 1T free ßhCG, 5% FPR. . . 167
Test 5. 1T total hCG, 5FPR. . . 168
Test 6. 1T AFP, 5% FPR. . . 168
Test 10. 1T AFP, mixed cut-points. . . 169
Test 11. 1T Inhibin, 5FPR. . . 169
Test 12. 1T ADAM 12, 5FPR. . . 170
Test 13. 1T SP1, 5% FPR. . . 170
Test 17. ba_hcg_ratio, 0.25MoM. . . 171
Test 18. 1T uE3, 5% FPR. . . 171
Test 19. 1T PlGF, 5FPR. . . 171
Test 20. 1T PAPP-A and 1T free ßhCG, 5% FPR. . . 172
Test 21. 1T PAPP-A and 1T free ßhCG, mixed cut-points. . . 172
Test 22. 1T PAPP-A and 1T AFP, 5% FPR. . . 173
Test 23. 1T PAPP-A and 1T ITA, 3% FPR. . . 173
Test 24. 1T PAPP-A and 1T ITA, 5% FPR. . . 173
Test 25. 1T free ßhCG and 1T Inhibin, 5% FPR. . . 174
Test 26. 1T free ßhCG and 1T AFP, 5% FPR. . . 174
Test 27. 1T PAPP-A and 1T ITA, 10% FPR. . . 174
Test 28. 1T PAPP-A, 1T free ßhCG and 1T ITA, 5% FPR. . . 175
Test 29. 1T PAPP-A, 1T free ßhCG and 1T ITA,3% FPR. . . 175
Test 30. 1T PAPP-A, 1T free ßhCG and 1T ITA, 10% FPR. . . 175
Test 31. 1T total hCG, 1T freeαhCG and 1T progesterone, 0.34 MoM. . . 176
Test 32. Age, 1T Inhibin, risk 1:100. . . 176
Test 33. Age, 1T Inhibin, risk 1:250. . . 176
Test 34. Age, 1T Inhibin, risk 1:400. . . 177
Test 35. Age, 1T Inhibin, 5FPR. . . 177
Test 36. Age, 1T Inhibin, mixed cut-points. . . 178
Test 37. Age, 1T PAPP-A, 5FPR. . . 178
Test 38. Age, 1T PAPP-A, mixed cut-points. . . 179
Test 39. Age, 1T free ßhCG, 5FPR. . . 179
Test 40. Age, 1T free ßhCG, risk 1:384. . . 180
Test 41. Age, 1T free ßhCG, mixed cut-points. . . 180
Test 42. Age, 1T total hCG,risk 1:384. . . 181
Test 43. Age, 1T total hCG, mixed cut-points. . . 181
Test 44. Age, 1T AFP, 5FPR. . . 182
Test 45. Age, 1T AFP, risk1:384. . . 182
Test 46. Age, 1T AFP,mixed cut-points. . . 183
Test 47. Age, 1T uE3, risk 1:384. . . 183
Test 48. Age, 1T uE3, mixed cut-points. . . 184
Test 49. Age, 1T freeαhCG, risk 1:384. . . 184
Test 50. Age, 1T SP1, 5FPR. . . 185
Test 51. Age, 1T ProMBP, risk 1:250. . . 185
Test 52. Age, 1T ITA, 5FPR. . . 185
Test 53. Age, 1T ADAM 12, risk 1:400. . . 186
Test 54. Age, 1T PAPP-A and 1T free ßhCG, risk 1:250. . . 186
Test 55. Age, 1T PAPP-A and 1T free ßhCG, 5FPR. . . 187
Test 56. Age, 1T PAPP-A and 1T free ßhCG, mixed cut-points. . . 188
Test 57. Age, 1T PAPP-A and 1T free ßhCG, mixed cut-points without 5FPR. . . 189
Test 58. Age, 1T total hCG and 1T PAPP-A, 5FPR. . . 190
Test 59. Age, 1T PAPP-A and 1T Inhibin, risk 1:100. . . 191
Test 60. Age, 1T PAPP-A and 1T Inhibin, risk 1:250. . . 191
Test 61. Age, 1T PAPP-A and 1T Inhibin, risk 1:400. . . 191
Test 62. Age, 1T PAPP-A and 1T Inhibin, 5FPR. . . 192
Test 63. Age, 1T PAPP-A and 1T Inhibin, mixed cut-points. . . 192
Test 64. Age, 1T PAPP-A and 1T ITA, 5FPR. . . 193
Test 65. Age, 1T PAPP-A and 1T AFP, 5FPR. . . 193
Test 66. Age, 1T free ßhCG and 1T Inhibin, risk 1:100. . . 194
Test 67. Age, 1T free ßhCG and 1T Inhibin, risk 1:250. . . 194
Test 68. Age, 1T free ßhCG and 1T Inhibin, risk 1:400. . . 194
Test 69. Age, 1T free ßhCG and 1T Inhibin, 5FPR. . . 195
Test 70. Age, 1T free ßhCG and 1T Inhibin, mixed cut-points. . . 195
Test 71. Age, 1T free ßhCG and 1T AFP, 5FPR. . . 196
Test 72. Age, 1T free ßhCG and 1T AFP, risk 1:250. . . 196
Test 73. Age, 1T free ßhCG and 1T AFP, risk 1:384. . . 197
Test 74. Age, 1T free ßhCG and 1T AFP, mixed cut-points. . . 197
Test 75. Age, 1T AFP and 1T uE3, risk 1:384. . . 198
Test 76. Age, 1T AFP and 1T freeαhCG, risk 1:384. . . 198
Test 77. Age, 1T free ßhCG and 1T total hCG, risk 1:384. . . 198
Test 78. Age, 1T free ßhCG and 1T uE3, risk 1:384. . . 199
Test 79. Age, 1T free ßhCG and 1T uE3, 5FPR. . . 199
Test 80. Age, 1T free ßhCG and 1T uE3, mixed cut-points. . . 200
Test 81. Age, 1T free ßhCG and 1T SP1, 5FPR. . . 200
Test 82. Age, 1T free ßhCG and 1T SP1 risk 1:250. . . 200
Test 83. Age, 1T AFP and 1T total hCG, 1:384. . . 201
Test 84. Age, 1T free ßhCG and 1T freeαhCG, risk 1:384. . . 201
Test 85. Age, 1T total hCG and 1T uE3, risk 1:384. . . 202
Test 86. Age, 1T total hCG and 1T Inhibin, 5FPR. . . 202
Test 87. Age, 1T total hCG and 1T freeαhCG, risk 1:384. . . 202
Test 88. Age, 1T uE3 and 1T freeαhCG, risk 1:384. . . 203
Test 89. Age, 1T PAPP-A, 1T free ßhCG and 1T AFP, 5FPR. . . 203
Test 90. Age, 1T PAPP-A, 1T free ßhCG and 1T AFP, mixed cut-points. . . 204
Test 91. Age, 1T free ßhCG, 1T AFP and 1T uE3, 5FPR. . . 204
Test 92. Age, 1T free ßhCG, 1T AFP and 1T uE3, risk 1:384. . . 205
Test 93. Age, 1T free ßhCG, 1T AFP and 1T uE3, mixed cut-points. . . 205
Test 94. Age, 1T total hCG, 1T AFP and 1T uE3, risk 1:384. . . 205
Test 95. Age, 1T total hCG, 1T AFP and 1T uE3, mixed cut-points. . . 206
Test 96. Age, 1T AFP, freeαhCG and 1T uE3, risk 1:384. . . 206
Test 97. Age, 1T PAPP-A, 1T free ßhCG and 1T Inhibin, 5FPR. . . 207
Test 98. Age, 1T PAPP-A, 1T total hCG and 1T Inhibin, 5FPR. . . 207
Test 99. Age, 1T PAPP-A, sp1 and 1T ProMBP, 5FPR. . . 207
Test 100. Age, 1T PAPP-A, sp1 and 1T ProMBP, risk 1:250. . . 208
Test 101. Age, 1T free ßhCG, 1T total hCG, 1T AFP and 1T uE3, risk 1:384. . . 208
Test 102. Age, 1T total hCG, 1T AFP, 1T uE3 and 1T freeαhCG, risk 1:384. . . 209
Test 103. Age, 1T PAPP-A, 1T free ßhCG, 1T AFP, 1T uE3 and 1T Inhibin, 5FPR. . . 209
Test 104. Age, 1T PAPP-A, 1T total hCG, 1T AFP, 1T uE3 and 1T Inhibin, 5FPR. . . 209
Test 105. Age, 1T free ßhCG, 1T total hCG, 1T AFP, 1T uE3 and 1T freeαhCG, risk 1:384. . . 210
Test 106. Age, 1T hPL, risk 1:250. . . 210
Test 107. Age, 1T hPL, 1T PAPP-A, risk 1:250. . . 211
Test 108. Age, 1T hPL, 1T free ßhCG, risk 1:250. . . 211
Test 109. Age, 1T hPL, 1T PAPP-A, 1T free ßhCG, risk 1:250. . . 211
Test 110. Age, 1T PGH, risk 1:250. . . 212
Test 111. Age, 1T PGH, 1T PAPP-A , risk 1:250. . . 212
Test 112. Age, 1T PGH, 1T free ßhCG , risk 1:250. . . 213
Test 113. Age, 1T PGH, 1T PAPP-A, 1T free ßhCG , risk 1:250. . . 213
Test 114. Age, 1T GHBP, risk 1:250. . . 213
Test 115. Age, 1T GHBP, 1T PAPP-A, risk 1:250. . . 214
Test 116. Age, 1T GHBP, 1T free ßhCG, risk 1:250. . . 214
Test 117. Age, 1T GHBP, 1T PGH, risk 1:250. . . 215
Test 118. Age, 1T GHBP, 1T PAPP-A, 1T free ßhCG , risk 1:250. . . 215
Test 119. Age, 1T GHBP, 1T PGH, 1T PAPP-A, 1T free ßhCG , risk 1:250. . . 215
Test 120. Age, 1T ADAM 12, risk 1:250. . . 216
Test 121. Age, 1T ADAM 12, 1T PAPP-A, 1T free ßhCG, risk 1:250. . . 216
Test 122. Age, PlGF, 1T PAPP-A, 1T free ßhCG, 5FPR. . . 217
Test 123. Age, 1T PAPP-A and 1T free ßhCG, risk 1:300. . . 217
Test 124. Age, 1T PAPP-A, 1T Hyperglycosylated hCG, 5FPR. . . 218
Test 128. Age, ADAM 12, 1T PAPP-A, 5FPR. . . 218
Test 129. Age, ADAM 12, 1T PAPP-A, 1T free ßhCG, 5FPR. . . 218
Test 130. Age, 1T PlGF, 5FPR. . . 219
Test 131. 1T PlGF, 1T PAPP-A, 1T free ßhCG, 5FPR. . . 219
Test 132. Age, 1T ADAM 12, 1T PAPP-A, 1T free ßhCG, mixed cut-points. . . 220
Test 133. Age, 1T PAPP-A, 1T free ßhCG and 1T Inhibin, risk 1:250. . . 220
Test 134. Age, 1T PAPP-A, 1T free ßhCG, and 1T Inhibin, mixed cut-points. . . 221 221 ADDITIONAL TABLES . . . .
229
APPENDICES . . . .
237
CONTRIBUTIONS OF AUTHORS . . . .
237 DECLARATIONS OF INTEREST . . . .
237 SOURCES OF SUPPORT . . . .
238
DIFFERENCES BETWEEN PROTOCOL AND REVIEW . . . .
238 NOTES . . . .
[Diagnostic Test Accuracy Review]
First trimester serum tests for Down’s syndrome screening
S Kate Alldred1, Yemisi Takwoingi2, Boliang Guo3, Mary Pennant4, Jonathan J Deeks2, James P Neilson1, Zarko Alfirevic1
1Department of Women’s and Children’s Health, The University of Liverpool, Liverpool, UK.2Public Health, Epidemiology and
Biostatistics, University of Birmingham, Birmingham, UK.3School of Medicine, University of Nottingham, Nottingham, UK.4Public
Health Directorate, Cambridgeshire County Council, Cambridge, UK
Contact address: S Kate Alldred, Department of Women’s and Children’s Health, The University of Liverpool, First Floor, Liverpool Women’s NHS Foundation Trust, Crown Street, Liverpool, L8 7SS, [email protected].
Editorial group:Cochrane Pregnancy and Childbirth Group.
Publication status and date:New, published in Issue 11, 2015.
Review content assessed as up-to-date: 17 December 2013.
Citation:Alldred SK, Takwoingi Y, Guo B, Pennant M, Deeks JJ, Neilson JP, Alfirevic Z. First trimester serum tests for Down’s syndrome screening.Cochrane Database of Systematic Reviews2015, Issue 11. Art. No.: CD011975. DOI: 10.1002/14651858.CD011975.
Copyright © 2015 The Cochrane Collaboration. Published by John Wiley & Sons, Ltd.
A B S T R A C T
Background
Down’s syndrome occurs when a person has three, rather than two copies of chromosome 21; or the specific area of chromosome 21 implicated in causing Down’s syndrome. It is the commonest congenital cause of mental disability and also leads to numerous metabolic and structural problems. It can be life-threatening, or lead to considerable ill health, although some individuals have only mild problems and can lead relatively normal lives. Having a baby with Down’s syndrome is likely to have a significant impact on family life.
Noninvasive screening based on biochemical analysis of maternal serum or urine, or fetal ultrasound measurements, allows estimates of the risk of a pregnancy being affected and provides information to guide decisions about definitive testing. However, no test can predict the severity of problems a person with Down’s syndrome will have.
Objectives
The aim of this review was to estimate and compare the accuracy of first trimester serum markers for the detection of Down’s syndrome in the antenatal period, both as individual markers and as combinations of markers. Accuracy is described by the proportion of fetuses with Down’s syndrome detected by screening before birth (sensitivity or detection rate) and the proportion of women with a low risk (normal) screening test result who subsequently had a baby unaffected by Down’s syndrome (specificity).
Search methods
We conducted a sensitive and comprehensive literature search of MEDLINE (1980 to 25 August 2011), Embase (1980 to 25 August 2011), BIOSIS via EDINA (1985 to 25 August 2011), CINAHL via OVID (1982 to 25 August 2011), The Database of Abstracts of Reviews of Effectiveness (The Cochrane Library25 August 2011), MEDION (25 August 2011), The Database of Systematic Reviews and Meta-Analyses in Laboratory Medicine (25 August 2011), The National Research Register (Archived 2007), Health Services Research Projects in Progress database (25 August 2011). We did forward citation searching ISI citation indices, Google Scholar and PubMed ‘related articles’. We did not apply a diagnostic test search filter. We also searched reference lists and published review articles.
Selection criteria
We included studies in which all women from a given population had one or more index test(s) compared to a reference standard (either chromosomal verification or macroscopic postnatal inspection). Both consecutive series and diagnostic case-control study designs were included. Randomised trials where individuals were randomised to different screening strategies and all verified using a reference
standard were also eligible for inclusion. Studies in which test strategies were compared head-to-head either in the same women, or between randomised groups were identified for inclusion in separate comparisons of test strategies. We excluded studies if they included less than five Down’s syndrome cases, or more than 20% of participants were not followed up.
Data collection and analysis
We extracted data as test positive or test negative results for Down’s and non-Down’s pregnancies allowing estimation of detection rates (sensitivity) and false positive rates (1-specificity). We performed quality assessment according to QUADAS (Quality Assessment of Diagnostic Accuracy Studies) criteria. We used hierarchical summary ROC meta-analytical methods or random-effects logistic regression methods to analyse test performance and compare test accuracy as appropriate. Analyses of studies allowing direct and indirect comparisons between tests were undertaken.
Main results
We included 56 studies (reported in 68 publications) involving 204,759 pregnancies (including 2113 with Down’s syndrome). Studies were generally of good quality, although differential verification was common with invasive testing of only high-risk pregnancies. We evaluated 78 test combinations formed from combinations of 18 different tests, with or without maternal age; ADAM12 (a disintegrin and metalloprotease), AFP (alpha-fetoprotein), inhibin, PAPP-A (pregnancy-associated plasma protein A, ITA (invasive trophoblast antigen), freeβhCG (beta human chorionic gonadotrophin), PlGF (placental growth factor), SP1 (Schwangerschafts protein 1), total hCG, progesterone, uE3 (unconjugated oestriol), GHBP (growth hormone binding protein), PGH (placental growth hormone), hyperglycosylated hCG, ProMBP (proform of eosinophil major basic protein), hPL (human placental lactogen), (freeαhCG, and free ßhCG to AFP ratio. Direct comparisons between two or more tests were made in 27 studies.
Meta-analysis of the nine best performing or frequently evaluated test combinations showed that a test strategy involving maternal age and a double marker combination of PAPP-A and free ßhCG significantly outperformed the individual markers (with or without maternal age) detecting about seven out of every 10 Down’s syndrome pregnancies at a 5% false positive rate (FPR). Limited evidence suggested that marker combinations involving PAPP-A may be more sensitive than those without PAPP-A.
Authors’ conclusions
Tests involving two markers in combination with maternal age, specifically PAPP-A, freeβhCG and maternal age are significantly better than those involving single markers with and without age. They detect seven out of 10 Down’s affected pregnancies for a fixed 5% FPR. The addition of further markers (triple tests) has not been shown to be statistically superior; the studies included are small with limited power to detect a difference.
The screening blood tests themselves have no adverse effects for the woman, over and above the risks of a routine blood test. However some women who have a ‘high risk’ screening test result, and are given amniocentesis or chorionic villus sampling (CVS) have a risk of miscarrying a baby unaffected by Down’s. Parents will need to weigh up this risk when deciding whether or not to have an amniocentesis or CVS following a ‘high risk’ screening test result.
P L A I N L A N G U A G E S U M M A R Y
Screening tests for Down’s syndrome in first three months of pregnancy
Background
Down’s syndrome (also known as Down’s or Trisomy 21) is an incurable genetic disorder that causes significant physical and mental health problems, and disabilities. However, there is wide variation in how Down’s affects people. Some individuals are severely affected whilst others have mild problems and are able to lead relatively normal lives. There is no way of predicting how badly a baby might be affected.
Expectant parents are given the choice to be tested for Down’s during pregnancy to assist them in making decisions. If a mother is carrying a baby with Down’s, then there is the decision about whether to terminate or continue with the pregnancy. The information offers parents the opportunity to plan for life with a Down’s child.
The most accurate tests for Down’s involve testing fluid from around the baby (amniocentesis) or tissue from the placenta (chorionic villus sampling (CVS)) for the abnormal chromosomes associated with Down’s. Both these tests involve inserting needles through the mother’s abdomen and are known to increase the risk of miscarriage. Thus, the tests are not suitable for offering to all pregnant women. Rather, tests that measure markers in the mother’s blood, urine or on ultrasound scans of the baby are used for screening. These screening tests are not perfect, they can miss cases of Down’s and also give a ‘high risk’ test result to a number of women whose babies are not affected by Down’s. Thus, pregnancies identified as ‘high risk’ using these screening tests require further testing using amniocentesis or CVS to confirm a diagnosis of Down’s.
What we did
The aim of this review was to find out which of the blood screening tests done during the first three months of pregnancy are the most accurate at predicting the risk of a pregnancy being affected by Down’s. We looked at 18 different blood markers that can be used alone or in combination, taken before 14 weeks gestation, thus creating 78 screening tests fro Down’s. We found 56 studies, involving 204,759 pregnancies of which 2113 had pregnancies affected by Down’s.
What we found
For the first 14 weeks of pregnancy, the evidence supports the use of the double test of two blood markers; pregnancy-associated plasma protein A (PAPP-A) and free beta human chorionic gonadotrophin (βhCG), in combination with the mother’s age. This test detects around seven out of every 10 (68%) pregnancies affected by Down’s. It is common practice to offer amniocentesis or CVS to women with a high risk test result. About one in 20 women (5%) having this test will have a ‘high risk’ result but most of these women will not be carrying a baby with Down’s. We found for tests in the first 14 weeks of pregnancy, there is little evidence to support the use of serum tests made up of more than two blood markers.
Other important information to consider
The blood tests themselves have no adverse effects for the woman, over and above the risks of a routine blood test. However some women who have a ‘high risk’ screening test result, and are given amniocentesis or CVS have a risk of miscarrying a baby unaffected by Down’s. Parents will need to weigh up this risk when deciding whether or not to have an amniocentesis or CVS following a ‘high risk’ screening test result.
B A C K G R O U N D
This is one of a series of reviews on antenatal screening for Down’s syndrome following a generic protocol (Alldred 2010) -seePublished notesfor more details.
Target condition being diagnosed
Down’s syndrome
Down’s syndrome affects approximately one in 800 live-born ba-bies (Cuckle 1987a). It results from a person having three, rather than two, copies of chromosome 21, or the specific area of chro-mosome 21 implicated in causing Down’s syndrome, as a result of trisomy or translocation. If not all cells are affected, the pattern is described as ’mosaic’. Down’s syndrome can cause a wide range of
physical and mental problems. It is the commonest cause of men-tal disability, and is also associated with a number of congenimen-tal malformations, notably affecting the heart. There is also an in-creased risk of cancers such as leukaemia, and numerous metabolic problems including diabetes and thyroid disease. Some of these problems may be life-threatening, or lead to considerable ill health, while some individuals with Down’s syndrome have only mild problems and can lead a relatively normal life.
There is no cure for Down’s syndrome, and antenatal diagnosis allows for preparation for the birth and subsequent care of a baby with Down’s syndrome, or for the offer of a termination of preg-nancy. Having a baby with Down’s syndrome is likely to have a significant impact on family and social life, relationships and par-ents’ work. Special provisions may need to be made for education and care of the child, as well as accommodating the possibility of periods of hospitalisation.
Definitive invasive tests (amniocentesis and chorionic villus sam-pling (CVS)) exist that allow the diagnosis of Down’s syndrome before birth, but carry a risk of miscarriage. No test can predict the severity of problems a person with Down’s syndrome will have. Noninvasive screening tests based on biochemical analysis of ma-ternal serum or urine, or fetal ultrasound measurements, allow an estimate of the risk of a pregnancy being affected and provide parents with information to enable them to make choices about definitive testing. Such screening tests are used during the first and second trimester of pregnancy.
Screening tests for Down’s syndrome
Initially, screening was determined solely by using maternal age to classify a pregnancy as high or low risk for trisomy 21, as it was known that older women had a higher chance of carrying a baby with Down’s syndrome (Penrose 1933).
Further advances in screening were made in the early 1980s, when Merkatz et al. investigated the possibility that low maternal serum alpha-fetoprotein (AFP), obtained from maternal blood in the sec-ond trimester of pregnancy could be associated with chromoso-mal abnorchromoso-malities in the fetus. Their retrospective case-control study showed a statistically significant relationship between fetal trisomy, such as Down’s syndrome, and lowered maternal serum AFP (Merkatz 1984). This was further explored by Cuckle et al in a larger retrospective trial using data collected as part of a neural tube defect (NTD) screening project (Cuckle 1984). This work was followed by calculation of risk estimates using maternal serum AFP values and maternal age, which ultimately led to the intro-duction of the two screening parameters in combination (Alfirevic 2004).
In 1987, in a small case-control study of women carrying fe-tuses with known chromosomal abnormalities, Bogart and col-leagues investigated maternal serum levels of human chorionic go-nadotrophin (hCG) as a possible screening tool for chromosomal abnormalities in the second trimester (Bogart 1987). This fol-lowed the observations that low hCG levels were associated with miscarriages, which are commonly associated with fetal chromo-somal abnormalities. They concluded that high hCG levels were associated with Down’s syndrome and because hCG levels plateau at 18 to 24 weeks, that this would be the most appropriate time for screening. Later work suggested that the ß subunit of hCG was a more effective marker than total hCG (Macri 1990;Macri 1993). Second trimester unconjugated oestriol (uE3), produced by the fetal adrenals and the placenta, was also evaluated as a potential screening marker. In another retrospective case-control study, uE3 was shown to be lower in Down’s syndrome pregnancies compared with unaffected pregnancies. When used in combination with AFP and maternal age, it appeared to identify more pregnancies affected by Down’s syndrome than AFP and age alone (Canick 1988). Further work suggested that all three serum markers (AFP, hCG and uE3) showed even higher detection rates when combined with
maternal age (Wald 1988a;Wald 1988b) and appeared to be a cost-effective screening strategy (Wald 1992a).
Two other serum markers, produced by the placenta, have been linked with Down’s syndrome, namely pregnancy associated plasma protein A or A, and first trimester Inhibin A. PAPP-A has been shown to be reduced in the first trimester of Down’s syndrome pregnancies, with its most marked reduction in the early first trimester (Bersinger 1995). Inhibin A is high in the second trimester in pregnancies affected by Down’s syndrome (Cuckle 1995;Wallace 1995). There are some issues concerning the bio-logical stability and hence reliability of this marker, and the effect this will have on individual risk.
Screening and parental choice
Antenatal screening is used for several reasons (Alfirevic 2004), but the most important is to enable parental choice regarding preg-nancy management and outcome. Before a woman and her part-ner opt to have a screening test, they need to be fully informed about the risks, benefits and possible consequences of such a test. This includes the choices they may have to face should the re-sult show that the woman has a high risk of carrying a baby with Down’s syndrome and implications of both false positive and false negative screening tests. They need to be informed of the risk of a miscarriage due to invasive diagnostic testing, and the possibility that a miscarried fetus may be chromosomally normal. If, follow-ing invasive diagnostic testfollow-ing, the fetus is shown to have Down’s syndrome, further decisions need to be made about continuation or termination of the pregnancy, the possibility of adoption and finally, preparation for parenthood. Equally, if a woman has a test that shows she is at a low risk of carrying a fetus with Down’s syndrome, it does not necessarily mean that the baby will be born with a normal chromosomal make up. This possibility can only be excluded by an invasive diagnostic test (Alfirevic 2003).The deci-sions that may be faced by expectant parents inevitably engender a high level of anxiety at all stages of the screening process, and the outcomes of screening can be associated with considerable physi-cal and psychologiphysi-cal morbidity. No screening test can predict the severity of problems a person with Down’s syndrome will have.
Index test(s)
This review examined serum screening tests used in the first trimester of pregnancy (up to 14 weeks’ gestation) comprised of the following 18 individual markers; a disintegrin and metal-loprotease 12 (ADAM12), AFP, inhibin, PAPP-A, invasive tro-phoblast antigen (ITA), free βhCG, placental growth factor (PlGF), Schwangerschafts protein 1 (SP1), total hCG, proges-terone, uE3, growth hormone binding protein (GHBP), placen-tal growth hormone (PGH), hyperglycosylated hCG, proform of eosinophil major basic protein (ProMBP), human placental
gen (hPL), free alpha human chorionic gonadotrophin (αhCG), and free ßhCG to AFP ratio. These markers can be used individu-ally, in combination with age, and can also be used in combination with each other. The risks are calculated by comparing a woman’s test result for each marker with values for an unaffected popula-tion, and multiplying this with her age-related risk. Where several markers are combined, risks are computed using risk equations (of-ten implemented in commercial software) that take into account the correlational relationships between the different markers and marker distributions in affected and unaffected populations.
Alternative test(s)
Down’s syndrome can be detected during pregnancy with inva-sive diagnostic tests such as amniocentesis or CVS, with or with-out prior screening. The ability to determine fetal chromosomal make up (also known as a karyotype) from amniotic fluid sam-ples was demonstrated in 1966 by Steele and Breg (Steele 1966), and the first antenatal diagnosis of Down’s syndrome was made in 1968 (Vaklenti 1968). Amniocentesis is an invasive procedure that involves taking a small sample of the amniotic fluid (liquor) surrounding the baby, using a needle which goes through the ab-dominal wall into the uterus, and is usually performed after 15 weeks’ gestation. CVS involves taking a sample of the placental tissue using a needle which goes through the abdominal wall and uterus or a cannula through the cervix. It is usually performed between 10 and 13 weeks’ gestation. Amniocentesis and CVS are both methods of obtaining fetal chromosomal material, which are then used to diagnose Down’s syndrome. Both tests use ultrasound scans to guide placement of the needle. Amniocentesis carries a risk of miscarriage in the order of 1%; transabdominal CVS may carry a similar risk (Alfirevic 2003).
Rationale
This is one of a suite of Cochrane reviews, the aim of which is to identify all screening tests for Down’s syndrome used in clinical practice, or evaluated in the research setting, in order to try to identify the most accurate test(s) available, and to provide clin-icians, policy-makers and women with robust and balanced evi-dence on which to base decisions about interpreting test results and implementing screening policies to triage the use of invasive diagnostic testing.
There are many different screening tests which are available and offered which will be the subject of additional Cochrane reviews (currently in preparation or published (Alldred 2012)), and there are other reviews looking at this area. Tests to be assessed in Cochrane reviews include second trimester serum tests; urine tests; first trimester ultrasound markers; tests that combine serum and ultrasound markers; and tests that combine markers from the first trimester with markers from the second trimester. Second trimester
ultrasound markers have been assessed in a previous systematic review (Smith-Bindman 2001).
The topic has been split into several different reviews to allow for greater ease of reading and greater accessibility of data, and also to allow the reader to focus on separate groups of tests, for example, first trimester serum tests alone, first trimester serum and ultra-sound, second trimester serum alone, first and second trimester serum combinations, with or without ultrasound markers; and urine markers alone. An overview review will compare the best tests, focusing on commonly used strategies and the best tests from each of these categories. This review is written with the global per-spective in mind, rather than to conform with any specific local or national policy, as not all tests will be available in all areas where screening for Down’s syndrome is carried out.
A systematic review of second trimester ultrasound markers in the detection of Down’s syndrome fetuses was published in 2001 that concluded that nuchal fold thickening may be useful in de-tecting Down’s syndrome, but that it was not sensitive enough to use as a screening test. The review concluded that the other second trimester ultrasound markers did not usefully distinguish between Down’s syndrome and pregnancies without Down’s syn-drome (Smith-Bindman 2001). There has yet to be a systematic review and meta-analysis of the observed data on serum, urine and first trimester ultrasound markers, in order to draw rigorous and robust conclusions about the diagnostic accuracy of available Down’s syndrome screening tests.
O B J E C T I V E S
The aim of this review was to estimate and compare the accuracy of first trimester serum markers for the detection of Down’s syn-drome in the antenatal period, both as individual markers and as combinations of markers. Accuracy is described by the propor-tion of fetuses with Down’s syndrome detected by screening before birth (sensitivity or detection rate), and the proportion of women with a low risk (normal) screening test result who subsequently had a baby unaffected by Down’s syndrome (specificity).
Investigation of sources of heterogeneity
We planned to investigate whether a uniform screening test is suit-able for all women, or whether different screening methods are more applicable to different groups, defined by advanced mater-nal age, ethnic groups and aspects of the pregnancy and medical history such as multiple pregnancy, diabetes and family history of Down’s syndrome. We also considered whether there existed evidence of overestimation of test accuracy in studies evaluating risk equations in the derivation sample rather than in a separate validation sample.
M E T H O D S
Criteria for considering studies for this review
Types of studies
We included studies in which all women from a given popula-tion had one or more index test(s) compared to a reference stan-dard. Both consecutive series and diagnostic case-control study designs were included. Randomised trials where individuals were randomised to different screening strategies and all verified using a reference standard were also eligible for inclusion. Studies in which test strategies were compared head-to-head, either in the same women, or between randomised groups were identified for inclusion in separate comparisons of test strategies. Studies were excluded if they included less than five Down’s syndrome cases, or more than 20% of participants were not followed up.
Participants
Pregnant women at less than 14 weeks’ gestation confirmed by ultrasound, who had not undergone previous testing for Down’s syndrome in their pregnancy were eligible. Studies were included if the pregnant women were unselected, or if they represented groups with increased risk of Down’s syndrome, or difficulty with conventional screening tests including maternal age greater than 35 years old, multiple pregnancy, diabetes mellitus and family history of Down’s syndrome.
Index tests
The following 18 index tests were examined; ADAM12, AFP, in-hibin, PAPP-A, ITA, free βhCG, PlGF, SP1, total hCG, pro-gesterone, uE3, GHBP, PGH, hyperglycosylated hCG, ProMBP, hPL, freeαhCG, and free ßhCG to AFP ratio, and combinations of these markers combined with maternal age.
We looked at comparisons of tests used in isolation and in 78 various combinations. These included single (one marker), double (two markers), triple (three markers), quadruple (four markers) and quintuple (five markers) tests, some of which were adjusted for maternal age.
Where tests were used in combination, we looked at the perfor-mance of test combinations according to predicted probabilities computed using risk equations and dichotomised into high risk and low risk.
Target conditions
Down’s syndrome in the fetus due to trisomy, translocation or mosaicism.
Reference standards
We considered several reference standards, involving chromoso-mal verification and postnatal macroscopic inspection. Chromo-somal verification is considered preferential but because of the risks involved, often not feasible. Where macroscopic inspection or examination raises a question about the possibility of an indi-vidual being affected by Down’s syndrome, in clinical practice this is usually confirmed or refuted by formal karyotyping.
Amniocentesis and CVS are invasive chromosomal verification tests undertaken during pregnancy. They are highly accurate but the process carries a 1% miscarriage rate, and therefore they are only used in pregnancies considered to be high risk of Down’s, or on the mother’s request. All other types of testing (postnatal examination, postnatal karyotyping, birth registers and Down’s syndrome registers) are based on information available at the end of pregnancy. For the purposes of meta-analysis they are considered equivalent. The greatest concern is not their accuracy, but the loss of the pregnancy to miscarriage between the timing of serum testing and the reference standard. Miscarriage with cytogenetic testing of the fetus is included in the reference standard where available.
We anticipated that older studies, and studies undertaken in older women were more likely to have used invasive chromosomal veri-fication tests in all women. Studies undertaken in younger women and more recent studies were likely to use differential verification as they often only used prenatal karyotypic testing on fetuses con-sidered screen positive or high risk according to the screening test; the reference standard for most unaffected infants is likely to be observation of a phenotypically normal baby. Although the ac-curacy of this combined reference standard is considered high, it is methodologically a weaker approach because pregnancies that miscarry between the index test and birth are likely to be lost from the analysis, and miscarriage is more likely to occur in Down’s than normal pregnancies.
Search methods for identification of studies
We used one generic search strategy to identify studies for all reviews in this series
Electronic searches
We applied a sensitive search strategy to search the follow-ing databases usfollow-ing the text words and MeSH terms detailed inAppendix 1, adapting the search strategy for each different database.
Databases searched included:
• MEDLINE via OVID (1980 to 25 August 2011) • Embase via Dialog Datastar (1980 to 25 August 2011)
• BIOSIS via EDINA (1985 to 25 August 2011)
• CINAHL via OVID (1982 to 25 August 2011)
• The Database of Abstracts of Reviews of Effectiveness (25 August 2011)
• MEDION(25 August 2011)
• The Database of Systematic Reviews and Meta-Analyses in
Laboratory Medicine (www.ifcc.org/) (25 August 2011)
• The National Research Register(Archived 2007)
• Health Services Research Projects in Progress database ( HSRPROJ) (25 August 2011)
The search strategy combined three sets of search terms (see Appendix 1). The first set was made up of named tests, general terms used for screening/diagnostic tests and statistical terms. Note that the statistical terms were used to increase sensitivity and were not used as a methodological filter to increase specificity. The sec-ond set was made up of terms that encompass Down’s syndrome and the third set made up of terms to limit the testing to pregnant women. All terms within each set were combined with the Boolean operator OR and then the three sets were combined using AND. The terms used were a combination of subject headings and free text terms. The search strategy was adapted to suit each database searched.
We attempted to identify cumulative papers which reported data from the same data set, and contacted authors to obtain clarifi-cation of the overlap between data presented in these papers, in order to prevent data from the same women being analysed more than once.
Searching other resources
In addition, we examined references cited in studies identified as being potentially relevant, and those cited by previous reviews. We contacted authors of studies where further information was required.
We carried out forward citation searching of relevant items, us-ing the search strategy in ISI citation indices, Google scholar and Pubmed ‘related articles’.
We did not apply language restrictions to the search.
Data collection and analysis
Selection of studies
Two review authors screened the titles and abstracts (where avail-able) of all studies identified by the search strategy. We obtained full-text versions of studies identified as being potentially relevant and two review authors independently assessed these for inclusion, using a study eligibility screening pro forma according to the pspecified inclusion criteria. Any disagreement between the two re-view authors was settled by consensus, or where necessary, by a third party.
Data extraction and management
A data extraction form was developed and piloted using a subset of 20 identified studies. Two review authors independently extracted data, and where disagreement or uncertainty existed, a third review author validated the information extracted.
Data on each marker were extracted as binary test positive/test negative results for Down’s and non-Down’s pregnancies, with a high-risk result-as defined by each individual study-being regarded as test positive (suggestive or diagnostic of Down’s syndrome), and a low-risk result being regarded as test negative (suggestive of absence of Down’s syndrome). Where results were reported at several thresholds, we extracted data at each threshold.
We made a note of those in special groups that posed either in-creased risk of Down’s syndrome or difficulty with conventional screening tests, including maternal age greater than 35 years old, multiple pregnancy, diabetes mellitus and family history of Down’s syndrome.
Assessment of methodological quality
We used a modified version of the QUADAS (Quality Assessment of Diagnostic Accuracy Studies) tool (Whiting 2003), a quality assessment tool for use in systematic reviews of diagnostic accuracy studies, to assess the methodological quality of included studies. We anticipated that a key methodological issue would be the po-tential for bias arising from the differential use of invasive testing and follow-up for the reference standard according to index test results, bias arising due to higher loss to miscarriage if false nega-tives than true neganega-tives. We chose to code this issue as originating from differential verification in the QUADAS tool: we are aware that it could also be coded under delay in obtaining the reference standard, and reporting of withdrawals. We omitted the QUADAS item assessing quality according to length of time between index and reference tests, as Down’s syndrome is either present or absent rather than a condition that evolves and resolves, and disregarding the differential reference standard issue, thus any length of delay is acceptable. Two review authors assessed each included study sep-arately. Any disagreement between the two authors was settled by consensus, or where necessary, by a third party. Each item in the QUADAS tool was be marked as ‘yes’, ‘no’ or ‘unclear’, and scores are presented graphically and in tables. We did not use a summary quality score. SeeAppendix 3for QUADAS questionnaire.
Statistical analysis and data synthesis
We initially examined each test or test strategy at each of the com-mon risk thresholds used to define test positivity by plotting esti-mates of sensitivity and specificity from each study on forest plots and in receiver operating characteristic (ROC) space. Test strate-gies were selected for further investigation if they were evaluated in four or more studies or, if there were two or three studies, but the individual study results indicated performance likely to be su-perior to a sensitivity of 70% and specificity of 90%.
Estimation of average sensitivity and specificity
The analysis for each test strategy was undertaken first restricting to studies that reported a common threshold to estimate average sensitivity and specificity for each test at each threshold. Although data on all thresholds were extracted, we present only key common thresholds from the literature, close to risks of 1:384, 1:250 and the 5% false positive rate (FPR), unless other thresholds were more commonly reported. Where combinations of tests were used in a risk score we extracted the result for the test combination using the risk score and not the individual components that made up the test.
We undertook meta-analyses using hierarchical summary ROC (HSROC) models, which included estimation of random-effects in accuracy and threshold parameters when there were four or more studies. Where there were fewer than four studies and the studies reported test performance at a common threshold, we computed average sensitivity and specificity values by using univariate fixed-effect or random-fixed-effects logistic regression models to average logit sensitivity and logit specificity separately because of insufficient number of studies to reliably estimate all the parameters in the HSROC model. It is common in this field for studies to report sensitivity for a fixed specificity (usually a 5% FPR). This removes the requirement to account for the correlation between sensitivity and specificity across studies by using a bivariate meta-analytical method since all specificities are the same value. Thus, at a fixed specificity value, logit sensitivities were pooled using a univariate random-effects logistic regression model. This model was further simplified to a fixed-effect model when there were only two or three studies and heterogeneity was not observed on the SROC plot. All analyses were undertaken using the NLMIXED procedure in SAS (version 9.2; SAS Institute, Cary, NC) and the xtmelogit command in Stata version 11.2 (Stata-Corp, College Station, TX, USA).
Comparisons between tests
We made comparisons between tests, first by utilising all available studies, selecting one threshold from each study to estimate a sum-mary ROC curve without restricting to a common threshold, and second, by making pair-wise comparisons using studies that com-pared tests in the same mothers (direct head-to-head comparison). The threshold was chosen for each study according to the follow-ing order of preference a) the risk threshold closest to 1 in 250; b) a multiples of the median (MoM) or presence/absence threshold; c) the performance closest to a 5% FPR or 95th percentile. The 5% FPR was chosen as a cut-off point as this is the cut-off most commonly reported in the literature.
For the analysis that included data from all studies, we compared test strategies in a single HSROC model, including two indicator terms for each test to allow for differences in accuracy and thresh-old. There was no indication of differing SROC curve shape be-tween tests and so a single SROC shape parameter was included
in the model, such that the fitted SROC curves did not cross. The initial meta-analyses of individual test strategies indicated there were differences in the variability of the accuracy parameter such that the assumption of equal variances may not be justifiable. We attempted to fit a model with separate variance terms for each test strategy for the accuracy parameter but the model did not con-verge. We therefore restricted the meta-analysis that compared the accuracy of the different test strategies to only studies that used a 5% FPR threshold so that we could fit a univariate random effects logistic regression model that allowed for a separate variance term for the random-effects of logit sensitivity for each test. Using non-linear combinations of the parameter estimates from this model, we derived ratios of sensitivities for each pair of tests included in the model and obtained their corresponding 95% confidence in-terval (CI) by using the delta method. We used likelihood ratio tests to assess the statistical significance of differences in sensitivity between tests.
For direct comparisons between each pair of tests at the 5% FPR threshold, we used a separate model for each pair-wise compari-son and pooled logit sensitivities using a univariate random-effects model. As studies rarely reported data cross-classified by both tests for Down’s and normal pregnancies, the analytical method did not take full account of the pairing of test results, but the restriction to direct head-to-head comparisons should have removed the po-tential confounding of test comparisons with other features of the studies. The strength of evidence for differences in performance of test strategies relied on evidence from both the direct and indirect comparisons.
Investigations of heterogeneity
We planned to undertake investigations of heterogeneity if there were 10 or more studies available for a test. We planned to in-vestigate the effect of a covariate by adding covariate terms to the HSROC model to assess differences in accuracy and threshold.
Sensitivity analyses
Mothers with pregnancies identified as high risk for Down’s syn-drome by serum testing are often offered immediate definitive testing by amniocentesis, whereas those considered low risk are assessed for Down’s syndrome by inspection at birth. Such delayed and differential verification will introduce bias most likely through there being greater loss to miscarriage in the Down’s syndrome pregnancies that were not detected by the serum testing (the false negative diagnoses). Testing and detection of miscarriages is im-practical in many situations, and no clear data are available on the magnitude of these miscarriage rates.
To account for the possible bias introduced by such a mechanism, we planned to perform sensitivity analyses by increasing the per-centage of false negatives in studies where delayed verification in test negatives occurred (Mol 1999). We planned to incrementally
increase the percentage from 10% to 50%, the final value repre-senting a scenario where a third or more Down’s pregnancies than normal pregnancies were likely to miscarry, thought to be higher than the likely value. We intended to conduct the sensitivity anal-yses on the analysis investigating the effect of maternal age on test sensitivity.
R E S U L T S
Results of the search
The search for the whole suite of reviews identified a total of 15,394 papers, once the results from each bibliographic database were combined and duplicates were removed. After screening out obviously inappropriate papers based on their title and abstract, 1145 papers remained and we obtained full-text copies for formal assessment of eligibility. From these, a total of 269 papers were deemed eligible and were included in the suite of reviews. We included a total of 56 studies (reported in 68 publications) in this review of first trimester serum screening, involving 204,759 pregnancies, of which 2113 were Down’s syndrome pregnancies. A total of 78 different test strategies or combinations, at one or more thresholds, were evaluated in the 56 studies. These tests were produced from combinations of 18 different serum tests with and without maternal age; ADAM12, AFP, inhibin, PAPP-A, ITA, freeβhCG, PlGF, SP1, total hCG, progesterone, uE3, GHBP, PGH, hyperglycosylated hCG, ProMBP, hPL, freeαhCG, and free ßhCG to AFP ratio. Strategies evaluated included three quintuple tests, three quadruple tests, 12 triple tests, 27 double tests and 15 single tests in combination with maternal age, and three triple tests, five double tests and 10 single tests without maternal age. The following combinations evaluated included four or more stud-ies.
Double tests with maternal age
1. Free ßhCG, AFP and maternal age (five studies; 5160 women including 174 Down’s syndrome pregnancies)
2. Free ßhCG, PAPP-A and maternal age (31 studies; 158,878 women including 1430 Down’s syndrome pregnancies)
Single tests with maternal age
1. Free ßhCG and maternal age (nine studies; 16,656 women including 549 Down’s syndrome pregnancies)
2. PAPP-A and maternal age(six studies; 13,742 women including 409 Down’s syndrome pregnancies)
Single tests without maternal age
1. Free ßhCG (four studies; 4280 women including 390 Down’s syndrome pregnancies)
2. PAPP-A (six studies; 25,510 women including 430 Down’s syndrome pregnancies)
Of the remaining test combinations, seven were evaluated in three studies, 17 were evaluated in two studies and the remainder were evaluated in single studies only.
Methodological quality of included studies
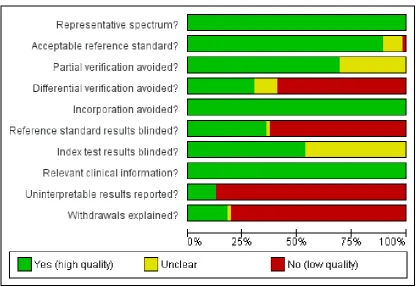
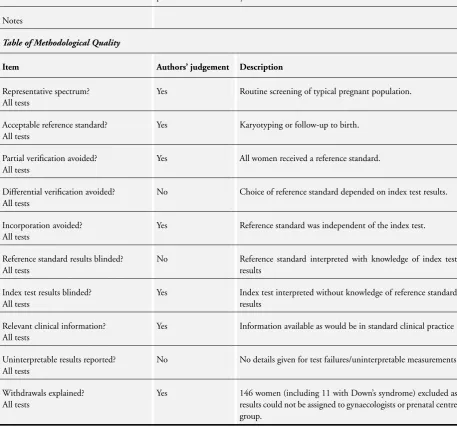
We judged the methodological quality of the studies to be high in most categories (Figure 1). Due to the nature of testing for Down’s syndrome screening and the potential side effects of inva-sive testing, differential verification is almost universal in the gen-eral screening population, as most women whose screening test result is defined as low risk will have their screening test verified at birth, rather than by invasive diagnosis in the antenatal period. Additionally, it was not always possible to ascertain from the in-cluded studies whether or not the results of index tests and refer-ence standards were blinded. It would be difficult to blind clini-cians performing invasive diagnostic tests (reference standards) to the index test result, unless all women received the same reference standard, which would not be appropriate in most scenarios. Any biases secondary to a lack of clinician blinding are likely to be minimal.
Figure 1. Methodological quality graph: review authors’ judgements about each methodological quality item presented as percentages across all included studies.
Where details of completeness of follow-up were poorly reported, most studies seemed to assume 100% follow-up. However, there will inevitably be losses to follow-up due to women moving out of area, for example. Studies sometimes accounted for these and it is unlikely that there were enough losses to follow-up to have introduced significant bias. There was likely under-ascertainment of miscarriage, and very few papers accounted for miscarriage, or performed tissue karyotyping in pregnancies resulting in miscar-riage. Some studies attempted to adjust for predicted miscarriage rate and the incidence of Down’s syndrome in this specific pop-ulation, but most did not. We have not attempted to adjust for expected miscarriage rate in this review. There is a higher natural miscarriage rate in the first trimester, however this will be uniform across studies and therefore unlikely to introduce significant bias. Some studies that provided estimates of risk using multivariable equations used the same data set to evaluate performance of the risk equation as was used to derive the equation. This is often thought to lead to over-estimation of test performance.
Findings
The findings of the 21 most common and/or best performing test strategies are given inSummary of findings 1. The remaining 57
strategies are briefly summarised inSummary of findings 2. The test strategies evaluated by four or more studies are detailed below.
1) Free ßhCG, PAPP-A and maternal age (double test)
Results for this double test were derived from 31 studies (Biagiotti 1998;Brambati 1994;Christiansen 2005; Christiansen 2007a; Christiansen 2009; Christiansen 2010; Cowans 2010; Crossley 2002a;De Graaf 1999a;Forest 1997;Gyselaers 2005;Haddow 1998;Kagan 2009; Kozlowski 2007 GC; Kozlowski 2007 PC; Krantz 2000; Muller 2003a; Niemimaa 2001a; O’Leary 2006; Orlandi 1997;Sahota 2010;Schaelike 2009;Scott 2004;Spencer 1999a; Torring 2010; Tsukerman 1999; Valinen 2007; Wald 2003a;Wapner 2003;Wojdemann 2005;Zaragoza 2009), and in-cluded 158,878 women in whom 1430 pregnancies were known to be affected by Down’s syndrome. Seven studies contributed over 10,000 pregnancies each to the data (Crossley 2002a;Gyselaers 2005;Kagan 2009;Krantz 2000;O’Leary 2006;Sahota 2010; Schaelike 2009). Studies presented data for cut-points of 5% FPR (Biagiotti 1998;Brambati 1994;Cowans 2010;De Graaf 1999a; Forest 1997;Haddow 1998;Kagan 2009;Sahota 2010;Spencer 1999a;Sahota 2010; Torring 2010; Tsukerman 1999; Wald
[image:14.595.99.516.108.395.2]2003a;Wapner 2003;Zaragoza 2009), 1:250 risk (Christiansen 2005;Christiansen 2007a;Christiansen 2009;Christiansen 2010; Crossley 2002a;Kagan 2009;Muller 2003a; Niemimaa 2001a; Torring 2010;Valinen 2007;Wojdemann 2005), and 1:300 risk (Kozlowski 2007 GC;Kozlowski 2007 PC;Schaelike 2009). At a cut-point of 5% FPR (17 studies), the sensitivity wa s estimated as 68% (95% confidence interval (CI) 65 to 71) and the specificity at 95% (95% CI 95 to 95). At a cut-point of 1:250 FPR (11 studies), the sensitivity was estimated as 73% (95% CI 67 to 79) and the specificity as 93% (95% CI 91 to 94).
2) Free ßhCG, AFP and maternal age (double test)
Results for this double test were derived from five studies (Benattar 1999; Biagiotti 1995; Forest 1995; Tsukerman 1999; Wald 2003a), and included 5160 women in whom 174 pregnancies were known to be affected by Down’s syndrome. Two contributed over 1000 pregnancies each to the data (Benattar 1999;Tsukerman 1999. Studies presented data for cut-points of 5% FPR (Biagiotti 1995;Tsukerman 1999;Wald 2003a), 1:250 risk (Benattar 1999) and 1:384 risk (Forest 1995). At a cut-point of 5% FPR (three studies), the sensitivity was estimated as 49% (95% CI 39 to 60) and the specificity as 95% (95% CI 94 to 96).
3) PAPP-A and maternal age (single test)
Results for this single test were derived from six studies (Biagiotti 1998;Brambati 1993;Forest 1997;Krantz 2000;Spencer 1999a; Wald 2003a), and included 13,742 women in whom 409 pregnan-cies were known to be affected by Down’s syndrome.Krantz 2000 was the largest study, contributing over 10,000 pregnancies to the data. Studies presented data for cut-points of 5% FPR (Biagiotti 1998;Brambati 1993;Forest 1997;Spencer 1999a;Wald 2003a) and 1:105 risk (Krantz 2000). At a cut-point of 5% FPR (five studies), the sensitivity was estimated as 55% (95% CI 46 to 63) and the specificity as 95% (95% CI 94 to 96).
4) Free ßhCG and maternal age (single test)
Results for this single test were derived from nine studies (Biagiotti 1995;Biagiotti 1998;Brambati 1994;Forest 1995;Forest 1997; Krantz 2000;Noble 1995;Spencer 1999a;Wald 2003a), and in-cluded 16,656 women in whom 549 pregnancies were known to be affected by Down’s syndrome.Krantz 2000contributed over 10,000 pregnancies to the data. Studies presented data for cut-points of 5% FPR (Biagiotti 1995;Biagiotti 1998;Brambati 1994; Forest 1997,Noble 1995;Spencer 1999a;Wald 2003a), 1:384 risk (Forest 1995) and 1:105 risk (Krantz 2000). At a cut-point of 5% FPR (seven studies), the sensitivity was estimated as 42% (95% CI 36 to 48) and the specificity as 95% (95% CI 94 to 96).
5) PAPP-A alone (single test without maternal age)
Results for this single test were derived from six studies (Brambati 1993;Brameld 2008;Brizot 1994;Casals 1996;Spencer 1999a; Wald 2003a), and included 25,510 women in whom 430 preg-nancies were known to be affected by Down’s syndrome.Brameld 2008was the largest study contributing over 20,000 pregnan-cies to the data. Studies presented data for cut-points of 5% FPR (Brambati 1993;Brizot 1994;Casals 1996;Spencer 1999a;Wald 2003a) and≤5th percentile (Brameld 2008). At a cut-point of
5% FPR (four studies), the sensitivity was estimated as 52% (95% CI 39 to 65) and the specificity as 95% (95% CI 94 to 96).
6) Free ßhCG alone (single test without maternal age) Results for this single test were derived from four studies (Casals 1996;Noble 1997;Spencer 1999a;Wald 2003a), and included 4280 women in whom 390 pregnancies were known to be affected by Down’s syndrome. Studies were all of a similar size. Studies presented data at a 5% FPR. At this cut-point, the sensitivity was estimated as 25% (95% CI 18 to 34) and the specificity as 95% (95% CI 94 to 96).
7) Other test combinations
Of the 73 test combinations evaluated in three or fewer studies, several test combinations demonstrated estimated sensitivities of more than 70% and estimated specificities of more than 90%. Twelve of these were evaluated in single studies (Summary of findings 2), however, three test combinations were evaluated in two or more studies.
1. A triple test ofPAPP-A, free ßhCG, AFP and maternal agewas evaluated in three studies (Muller 2003a;Tsukerman 1999;Wald 2003a), had an estimated sensitivity of 74% (95% CI 65 to 81) at a cut-point of 5% FPR.
2. A triple test ofADAM 12, PAPP-A, free ßhCG and maternal agewas evaluated in three studies (Christiansen 2010; Torring 2010;Valinen 2009), had an estimated sensitivity of 74% (95% CI 63 to 83) at a cut-point of 5% FPR.
3. A triple test ofPlGF, PAPP-A, free ßhCG and maternal agewas evaluated in two studies (Cowans 2010;Zaragoza 2009), had an estimated sensitivity of 76% (95% CI 69 to 82) at a cut-point of 5% FPR.
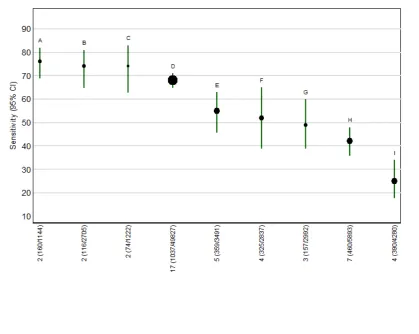
Comparative analysis of the nine selected test strategies
estimated detection rate at a 5% FPR was 49% (95% CI 39 to 60) based on data from three studies with 157 affected cases and 2992 total participants. The test combinations inFigure 2are ordered according to decreasing detection rates. The single test strategies with and without maternal age (PAPP-A alone; freeβhCG alone, PAPP-A and maternal age, and freeβhCG and maternal age) have the worst performance, whereas, the triple test strategies (ADAM 12, PAPP-A, freeβhCG and maternal age; PAPP-A, freeβhCG, AFP and maternal age) have the highest performance. In between lie the double tests (freeβhCG, PAPP-A and maternal age; free
βhCG, AFP and maternal age). However, it should be noted that the confidence intervals on these estimates are wide and overlap for the lower performing five strategies, suggesting that any of the differences observed may be explicable by chance.
Figure 2. Detection rates (sensitivity) at a 5% false positive rate for the nine selected test strategies. Each circle represents the summary sensitivity for a test strategy and the size of each circle is proportional to the
number of Down’s cases. The estimates are shown with 95% confidence intervals. The test strategies are ordered on the plot according to decreasing detection rate. The number of studies, cases and women included for each test strategy are shown on the horizontal axis.A = Age, PlGF, A and free ßhCG; B = Age, PAPP-A, free ßhCG and AFP; C = Age, ADAM 12, PAPP-A and free ßhCG; D = Age, PAPP-A and free ßhCG ; E =
Age, PAPP-A; F = PAPP-A; G = Age, free ßhCG and AFP ; H = Age, free ßhCG; I = Free ßhCG
[image:16.595.102.522.354.688.2]Table 1shows pair-wise direct comparisons (head-to-head) where studies were available. Such comparisons are regarded as providing the strongest evidence as they compare tests within pregnancies and are thus unconfounded. The table shows the ratios of sen-sitivities with 95% CIs and P values (P < 0.05 being considered a statistically significant difference) for each test comparison, the number of studies (K) for which data were available. The table shows that the sensitivity of the single test combinations (PAPP-A alone, freeβhCG alone, PAPP-A and maternal age, and free
βhCG and maternal age) tended to be significantly worse (P < 0.05) than the double and triple tests where data are available. The double test comprised of PAPP-A, freeβhCG and maternal age appears to have significantly better (P = 0.004) test accuracy than the double test comprised of freeβhCG, AFP and maternal age. Otherwise, there was no strong evidence of significant improve-ments in sensitivity with the addition of a third marker. However, most comparisons in this table are based on only single studies and are unlikely to be powered to detect differences in detection rates.
Table 2shows the same comparisons made using all available data (as used to createFigure 2). Results are in agreement with the di-rect comparisons, and in addition, showed that the triple test com-prised of PlGF, PAPP-A, free ßhCG and maternal age is signifi-cantly better (P = 0.024) than the double test comprised of PAPP-A, freeβhCG and maternal age. However, these comparisons are potentially confounded by differences between the studies, and are based on small numbers of studies.
Investigation of heterogeneity and sensitivity analyses
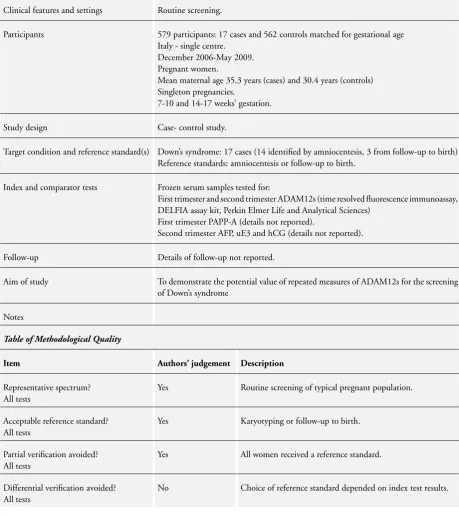
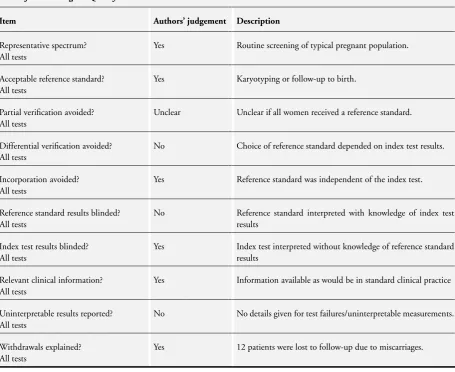
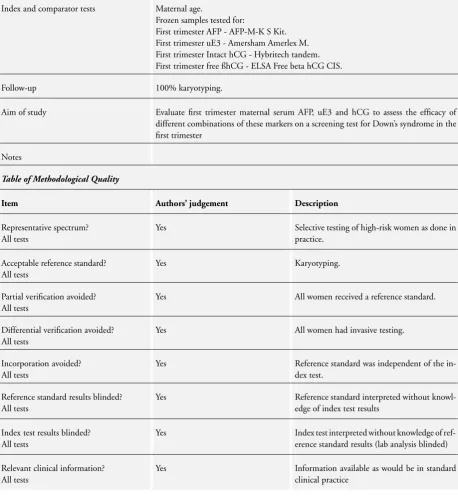
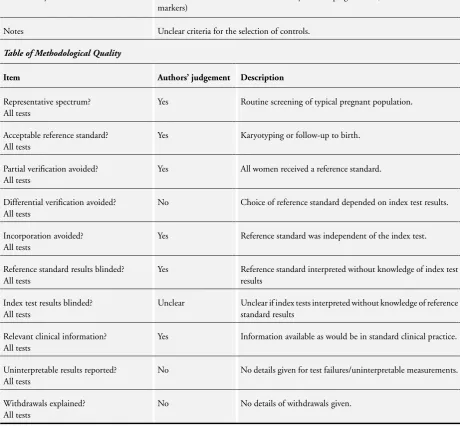
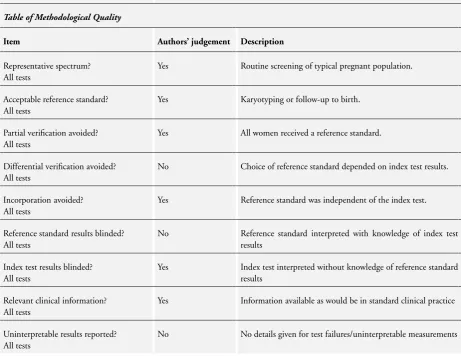
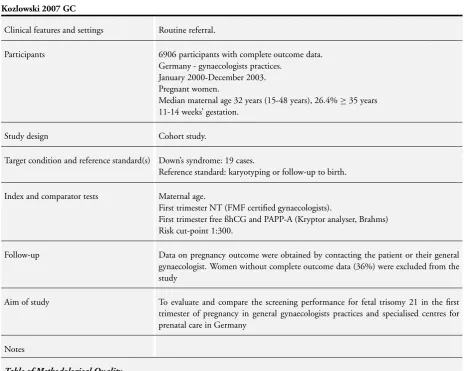
The key characteristics of the 56 included studies is summarised inTable 3with further details available in theCharacteristics of included studiestable. Only one test combination- PAPP-A, free ßhCG and maternal age (17 studies) was evaluated by 10 or more studies but there were no data for investigation of the effect of maternal age or any other potential source of heterogeneity. The planned sensitivity analyses were also not possible.
Summary of findings
Review Question What is the accuracy of serum-based markers for Down’s syndrome screening in the first trimester?
Population Pregnant women at less than 14 weeks’ gestation confirmed by ultrasound, who had not undergone previous testing for Down’s syndrome. Most studies were undertaken in women identified to be high risk based on maternal age
Settings All settings
Numbers of studies, preg-nancies and Down’s syn-drome cases
56 studies (68 publications) involving 204,759 pregnancies of which 2113 were Down’s syndrome pregnancies
Index tests 18 serum markers (ADAM12, AFP, inhibin, PAPP-A, ITA, freeβhCG, PlGF, SP1, total hCG, progesterone, uE3, GHBP, PGH, hyperglycosylated hCG, ProMBP, hPL, freeαhCG, and free ß hCG to AFP ratio) singly or in combination with or without maternal age
Reference standards Chromosomal verification (amniocentesis and CVS undertaken during pregnancy, and postnatal karyotyping) and postnatal macroscopic inspection
Study limitations 35 studies used selective chromosomal verification during pregnancy, and were at risk of under-ascertainment of Down’s syndrome cases due loss of the pregnancy to miscarriage between the serum test and the reference standard
Tests with at least 70% sensitivity and at least 95% specificity
Test strategy Studies Women (cases) Sensitivity (95% CI) Specificity (95% CI) Test*
Test strategies (with or without maternal age) evaluated by a single study
Without maternal age
Double tests
PAPP-A and AFP 1 96 (16) 81 (54 to 96) 95 (88 to 99)
PAPP-A and ITA 1 344 (24) 71 (49 to 87) 95 (92 to 97)
PAPP-A, free ß hCG and ITA 1 344 (24) 75 (53 to 90) 95 (92 to 97)
PlGF, PAPP-A and free ß hCG 1 699 (90) 72 (62 to 81) 95 (93 to 97)
With maternal age
Double tests
Free ß hCG and SP1 1 60 (14) 71 (42 to 92) 96 (85 to 99)
PAPP-A and Hyperglycosy-lated hCG
1 10775 (23) 74 (52 to 90) 95 (95 to 95)
Triple tests
PAPP-A, free ß hCG and In-hibin
1 1110 (85) 74 (63 to 83) 95 (94 to 96)
PAPP-A, SP1 and ProMBP 1 192 (15) 73 (45 to 92) 95 (91 to 98)
hPL, PAPP-A and free ß hCG (1:250 risk)
1 183 (47) 77 (62 to 88) 95 (90 to 98)
Quadruple tests
GHBP, PGH, PAPP-A and free ß hCG (1:250 risk)
1 335 (74) 76 (64 to 85) 95 (91 to 97)
Quintuple tests
PAPP-A, free ß hCG, AFP, uE3 and Inhibin
1 1110 (85) 78 (67 to 86) 95 (94 to 96)
PAPP-A, total hCG, AFP, uE3 and Inhibin
1 1110 (85) 73 (62 to 82) 95 (94 to 96)
Free ß hCG 4 4280 (390) 25 (18 to 34) 95 (94 to 96) P <0.001
PAPP-A 4 2837 (325) 52 (39 to 65) 95 (94 to 96)
Age, free ß hCG 7 5893 (460) 42 (36 to 48) 95 (94 to 96)
Age, PAPP-A 5 3491 (359) 55 (46 to 63) 95 (94 to 96)
Age, free ß hCG and AFP 3 2992 (157) 49 (39 to 60) 95 (94 to 96)
Age, PAPP-A and free ß hCG 17 49827 (1037) 68 (65 to 71) 95 (95 to 95)
Age, PAPP-A, free ß hCG and AFP
2 2705 (116) 74 (65 to 81) 95 (94 to 96)
Age, ADAM 12, PAPP-A and free ß hCG
2 1222 (74) 74 (63 to 83) 95 (94 to 96)
Age, PlGF, PAPP-A and free ß hCG
2 1144 (160) 76 (69 to 82) 95 (93 to 96)
*Likelihood ratio test for the difference in sensitivity between the nine test strategies that were formally compared in a single meta-analytic model.
ADAM12:a disintegrin and metalloprotease;AFP:alpha-fetoprotein;αhCG: alpha human chorionic gonadotrophin;ß hCG:beta human chorionic gonadotrophin;CI:confidence interval;CVS:chorionic villus sampling;GHBP:growth hormone binding protein;hCG:human chorionic gonadotrophin;hPL:human placental lactogen; ITA:invasive trophoblast antigen;PAPP-A:pregnancy-associated plasma protein A;PGH:placental growth hormone;PIGF:placental growth factor;PROMBP:proform of eosinophil major basic protein;SPI: Schwangerschafts protein 1;uE3:unconjugated oestriol
Test strategy Studies Women (cases) Sensitivity (95% CI) Specificity (95% CI) Threshold
Without maternal age
Single tests
AFP 2 2248 (104) 10 (4 to 21) 95 5% FPR
ADAM 12 1 579 (17) 41 (18 to 67) 95 (93 to 97) 5% FPR
Free ß hCG to AFP ratio 1 476 (9) 11 (0 to 48) 98 (96 to 99) 0.25 MoM
Inhibin 3 2098 (184) 19 (4 to 58) 95 5% FPR
PlGF 1 699 (90) 28 (19 to 38) 95 (93 to 97) 5% FPR
Total hCG 3 2098 (184) 19 (4 to 58) 95 5% FPR
SP1 3 1080 (53) 32 (1 to 96) 95 5% FPR
uE3 1 1110 (85) 13 (7 to 22) 95 (94 to 96) 5% FPR
Double tests
Free ß hCG and AFP 1 1138 (19) 16 (3 to 40) 95 (94 to 96) 5% FPR
Free ß hCG and Inhibin 1 876 (76) 30 (20 to 42) 95 (93 to 96) 5% FPR
PAPP-A and free ß hCG 2 795 (106) 64 (50 to 76) 95 5% FPR
Triple tests
Total hCG, freeαhCG and pro-gesterone
1 129 (17) 53 (28 to 77) 96 (90 to 99) 0.34 MoM
Single tests
ADAM 12 2 703 (46) 67 (46 to 83) 91 (87 to 94) 1:400 risk
AFP 2 1397 (126) 33 (23 to 46) 95 5% FPR
FreeαhCG 1 512 (12) 25 (5 to 57) 89 (86 to 91) 1:384 risk
GHBP 1 335 (74) 27 (17 to 39) 95 (91 to 97) 1:250 risk
hPL 1 183 (47) 45 (30 to 60) 93 (88 to 97) 1:250 risk
Inhibin 1 1110 (85) 32 (22 to 43) 95 (94 to 96) 5% FPR
ITA 1 278 (54) 48 (34 to 62) 95 (91 to 98) 5% FPR
PGH 1 335 (74) 41 (29 to 53) 94 (91 to 97) 1:250 risk
PlGF 1 699 (90) 43 (33 to 54) 95 (93 to 97) 5% FPR
ProMBP 1 181 (25) 36 (18 to 57) 94 (89 to 97) 1:250 risk
SP1 2 804 (29) 38 (22 to 56) 95 5% FPR
Total hCG 1 512 (12) 33 (10 to 65) 94 (92 to 96) 1:384 risk
uE3 1 512 (12) 33 (10 to 65) 86 (83 to 89) 1:384 risk
Double tests
ADAM 12 and PAPP-A 1 691 (46) 61 (45 to 75) 95 (93 to 97) 5% FPR
AFP and freeαhCG 1 512 (12) 33 (10 to 65) 87 (83 to 89) 1:384 risk
AFP and total hCG 1 512 (12) 33 (10 to 65) 93 (90 to 95) 1:384 risk
AFP and uE3 1 512 (12) 42 (15 to 72) 87 (84 to 90) 1:384 risk
Free ß hCG and freeαhCG 1 512 (12) 42 (15 to 72) 94 (91 to 96) 1:384 risk
Free ß hCG and Inhibin 1 1110 (85) 44 (33 to 55) 95 (94 to 96) 5% FPR
Free ß hCG and total hCG 1 512 (12) 25 (5 to 57) 93 (90 to 95) 1:384 risk
Free ß hCG and uE3 1 287 (41) 61 (45 to 76) 95 (92 to 97) 5% FPR
GHBP and free ß hCG 1 335 (74) 61 (49 to 72) 92 (88 to 95) 1:250 risk
GHBP and PAPP-A 1 335 (74) 66 (54 to 77) 93 (89 to 96) 1:250 risk
GHBP and PGH 1 335 (74) 47 (36 to 59) 93 (90 to 96) 1:250 risk
hPL and free ß hCG 1 183 (47) 68 (53 to 81) 94 (89 to 97) 1:250 risk
hPL and PAPP-A 1 183 (47) 55 (40 to 70) 94 (89 to 97) 1:250 risk
PAPP-A and AFP 2 2705 (116) 63 (50 to 74) 95 5% FPR
PAPP-A and Inhibin 1 1110 (85) 68 (57 to 78) 95 (94 to 96) 5% FPR
PAPP-A and ITA 2 622 (78) 62 (46 to 75) 95 5% FPR
PGH and free ß hCG 1 335 (74) 64 (52 to 74) 93 (89 to 96) 1:250 risk
PGH and PAPP-A 1 335 (74) 65 (53 to 76) 93 (89 to 96) 1:250 risk
Total hCG and freeαhCG 1 512 (12) 42 (15 to 72) 92 (89 to 94) 1:384 risk
Total hCG and Inhibin 1 1110 (85) 34 (24 to 45) 95 (94 to 96) 5% FPR
Total hCG and PAPP-A 2 4327 (133) 66 (54 to 76) 95 5% FPR
Total hCG and uE3 1 512 (12) 42 (15 to 72) 92 (89 to 94) 1:384 risk
uE3 and freeαhCG 1 512 (12) 33 (10 to 65) 89 (86 to 91) 1:384 risk
Triple tests
AFP, freeαhCG and uE3 1 512 (12) 58 (28 to 85) 82 (79 to 85) 1:384 risk
Free ß hCG, AFP and uE3 1 287 (41) 66 (49 to 80) 95 (92 to 97) 5% FPR
GHBP, PAPP-A and free ß hCG 1 335 (74) 76 (64 to 85) 94 (91 to 97) 1:250 risk
PAPP-A, total hCG and Inhibin 1 1110 (85) 69 (58 to 79) 95 (94 to 96) 5% FPR
PGH, PAPP-A and free ß hCG 1 335 (74) 76 (64 to 85) 94 (91 to 97) 1:250 risk
Total hCG, AFP and uE3 1 512 (12) 42 (15 to 72) 91 (88 to 94) 1:384 risk
Quadruple tests
Free ß hCG, total hCG, AFP and uE3
1 512 (12) 50 (21 to 79) 92 (89 to 94) 1:384 risk
Total hCG, AFP, uE3 and free
αhCG
1 512 (12) 50 (21 to 79) 90 (87 to 92) 1:384 risk
Quintuple tests
Free ß hCG, total hCG, AFP, uE3 and freeαhCG
1 512 (12) 33 (10 to 65) 90 (87 to 92) 1:384 risk