Numerical study on load-bearing capabilities of beam-like lattice structures with three
different unit cells
Abstract
The design and analysis of lattice structures manufactured using Additive Manufacturing (AM) technique is a new approach to create lightweight high-strength components. However, it is difficult for engineers to choose the proper unit cell for a certain function structure and loading case. In this paper, three beam-like lattice structures with triangular prism, square prism and hexagonal prism were designed, manufactured by SLM process using AlSi10Mg and tested. The mechanical performances of lattice structures with equal relative density, equal base area and height, and equal length for all unit cells were conducted by Finite Element Analysis (FEA). It was found that effective Young’s modulus is proportional to relative density, but with different affecting levels. When the lattice structures are designed with the same relative density or the same side lengths, the effective Young’s modulus of lattice structure with triangular prism exhibits the maximum value for both cases. When the lattice structures are designed with the same base areas for all unit cells, the effective Young’s modulus of lattice structures with square prism presents the maximum. FEA results also show that the maximum stress of lattice structures with triangular prisms in each comparison is at the lowest level and the stiffness-to-mass ratio remains at the maximum value, showing the overwhelming advantages in terms of mechanical strength. The excellent agreements between numerical results and experimental tests reveal the validity of FEA methods applied. The results in this work provide an explicit guideline to fabricate beam-like lattice structures with the best tensile and bending capabilities.
Keywords: Lattice structure; Unit cell; Additive Manufacturing (AM); Finite Element Analysis (FEA); Selective Laser Melting (SLM).
1. Introduction
Additive manufacturing (AM) technologies are able to provide the promising possibilities to create new design without a multitude of limitations by conventional processes, such as moulds and dies, casting etc. Lightweight design is one area that AM achieves well where it is impractical for other conventional fabrication technologies [1-3]. Currently there are two main methods of lightweight design, including cellular structure with unit cell [4-6] and topology optimization with advanced algorithm [2, 3, 7]. Topology optimization has only been used for maximum stiffness design to date but lacks sufficient capabilities for hierarchical design integrations at multiple scales [1]. Gervasi and Stahl [2] also found some types of topology optimization to show unrealistic presence of regions with intermediate densities. Lattice structure explores to achieve the balance between design convenience/efficiency and design accuracy by representative geometries to efficiently perform design tasks. Some researchers even tried to integrate lattice microstructures with its structural optimization to maximize the stiffness-to-mass ratio [2, 7, 8]. Basically, the use of lattice structures and other cellular materials is motivated by where the material is needed and periodically or randomly arranged [9]. These periodic cellular lattice structures are advantageous in high performance features such as high specific stiffness and high strength, as well as the possibility of tailoring their properties by designing appropriate cell architecture [6, 10]. By imagining a procedure to re-orienting the lattice elements, it is possible to make the lattice conform to principal stress direction [2], accomplishing the design and fabrication of lightweight parts. It makes cellular materials suitable for high value aero-space, medical and engineering products [11]. Besides, it is convenient to form the regular relationships between mechanical properties and geometrical parameters used to define the shape of unit cell.
are the typical structures defined by two-dimensional prismatic cellular materials of periodic meso-structures and have been primarily used in lightweight sandwich structures for their high out-of-line stiffness [17, 18]. Based on the belief that hexagonal honeycombs are valued for their combination of high strength and low density, Ju et al. [19] employed an in-plane linear elastic honeycomb model to compliant hexagonal periodic lattice structures, which turn out to achieve both high shear strength and high shear strain. As stated by Gibson and Ashby [17], cells in honeycombs are not always hexagonal. Ceramic and metal honeycombs used for exchangers and catalyst supports sometimes have square or triangular cells. Hence for light weight and load bearing, typically unit cells such as triangular, cubic and hexagonal are used.
The load bearing capability of each unit cell is also determined by the loading conditions. As an example, honeycomb with triangular unit cell is even stiffer compared to hexagonal honeycomb under the same axial stress. Through the comparison of triangular honeycombs, square honeycombs and hexagonal honeycombs under the same force by Ju and Summers [19], triangular honeycombs show the minimal value of normalized shear strain-shear strength, indicating the advantage of triangular honeycombs under shear force. Brenne et al. [20] gained insight into the impact of microstructure with square unit cells and local strains on the monotonic and cyclic behaviour under uniaxial and a more complex loading conditions by a plain sandwich structure under four-point-bending. It was found that most of the above mentioned publications focused on one certain type of unit cell in ideal model, no practical applications and most of the loads were axial compression [1, 11, 14, 21].
One critical challenge in realizing engineered lattice structures is the mechanical variation determined by shapes and sizes of struts composing the lattice due to the capability of AM process. Many researches have focused on the evaluation of mechanical properties of lattice structures over the past decades. Mathematical relationships or theoretical models [22-25], experimental study [5, 11, 19, 20] and Finite Element Method (FEM) [21, 26, 27], have been proposed to estimate the mechanical properties such as Young’s modulus and ultimate strength. In the work done by Park et al [9], they investigated the elastic modulus of lattice structure filled with square unit cells. The result showed that the elastic modulus changes with the varying strut diameters and rotation angles. Papers in this area only focus on one specific unit cell and describe its mechanical properties by simple and limited number of samples [1, 11, 14, 22]. It lacks of practical engineering applications, especially for the conformal structures with some certain unit cells. In another aspect, there are fewer comparisons among the potential unit cells used to conform to the practical load bearing parts. As pointed out by Jin et al. [18], an overall understanding of specimen size effects on the mechanical properties (modulus, strength, plateau stress and densification strain) in out-of-plane and in-plane directions is still unclear.
As there is no explicit guidance regarding to the preferable choice of potential unit cells, it is difficult for engineers to make a sound decision when selecting the unit cells to make conformal lattice structures. Fortunately, FEA has been successfully used for the prediction of mechanical properties of AM polymeric and composite scaffolds [28, 29]. However, some unit cells are so complex that besides taking up too much design space, their FEA models are also difficult to build and modify. Moreover, not all unit cells are designed for mechanical supporting structures, could be fabricated by AM process [12], or are suitable for beam-like structures. Even for supporting function unit cells, some of them also originated from triangular prism [30-32], cubic prism [20, 33-35] and hexagonal prism [19, 25] that are widely used in mechanical engineering.
As triangular prism, square prism and hexagonal prism are the most widely used unit cells in mechanical engineering, these were selected to be investigated in this work. The material used was AlSi10Mg alloy. It is a traditional cast alloy often used for die-casting that is also frequently used in SLM-fabricated components [36]. From the results by FEA, the corresponding mechanical performances, such as effective Young’s modulus, maximum von Mises stress, and stiffness-to-mass ratio were classified and compared. The FEA results of Young’s modulus were also verified by physical test with SLM manufactured AlSi10Mg samples.
2. Lattice structures and geometry model 2.1 Lattice structures
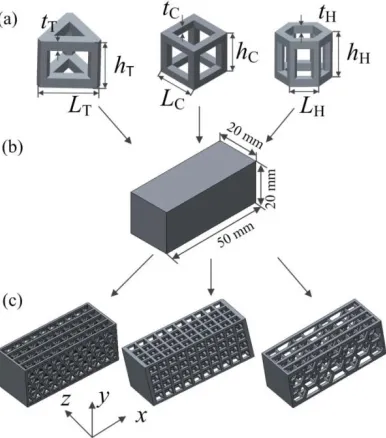
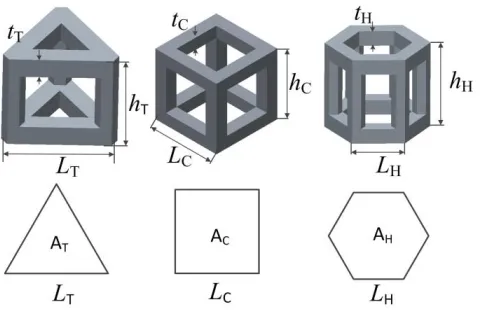
deliver therapeutic agents [22]. However, from a mechanical engineering point of view, the principal function should be able to reduce weight while keeping the load bearing capability. The critical issue is therefore to investigate mechanical response of lattice structures. In this work, three unit cells, including triangular prism, square prism, and hexagonal prism constructed using strut at each edge as shown in Fig. 1(a) were investigated.
2.2 Conformal lattice structures
[image:3.612.74.267.292.511.2]In this paper, another method to generate the lattice structure with traditional CAD software package Creo® was proposed and published by the authors [37]. The first step was to create a large scale lattice structures with the basic unit cells as displayed in Fig. 1(a). Here the basic unit cell is shaped by length, L, strut thickness with square cross-section, t, and height, h. One single layer of unit cells was firstly obtained by patterning in in-plane direction. This single layer was then repeated N times in out-plane direction, where the distance was equal to h between neighboring layers. This modelling method may cost relatively more time to generate each parametrical part due to scale features and large computations of Boolean operation, but is still a good proposal to build lattice structure for those who use Creo® only. Besides, as there will be more than one hundred models with different shape parameters in the following comparisons, it is more convenient to change and edit the varied structures by PLS file in Creo® [37].
Fig. 1 Geometrical evolution of lattice structures with three unit cells, (a) 3D skeleton unit cells of triangular prism, square prism and hexagonal prism, (b) to be replaced solid volume 20 mm × 20 mm × 50 mm, (c) three types of parametric lattice structures [37].
2.3 Design constraints based on AM
Challenges to CAD design planning would be in the determination of the smallest manufacturable element, which in turn depends on the fabrication process and the material properties. The resolution of AM in creating components is an important basis for designing and fabricating cellular structure, as the thickness of the strut should not be smaller than the fabricating resolution. Firstly, the minimum pore should be able to avoid shrinkage and make it possible to remove the remaining powders though the open cells according to the powder based AM process. Secondly, the strength of the lattice structure is positively related to the strut thickness, hence it cannot be too small [40]. It should be noted that the characteristic lengths of the cells in meso-scale are in the range of 0.1 to 10 mm [4]. The minimum thickness applied by Wang et al. [40] was 0.15 mm, which is proven to be fabricated well. For the maximum size, when the large unit cell size is greater than 5 mm, it could not be built by SLM process since over hanging struts in the cells resulted in the occurrence of serious deformation [11], which is regarded to be the upper limitation on manufacturing of struts for complex cellular structure. In terms of lattice structure, it means the smallest feasible strut thickness is 0.15 mm, while L should be bigger than t, but less than 5 mm. The thicknesshcould be calculated by the number of layer in its thickness direction. The original solid part used in this paper is a rectangular beam-like structure (20×20×50 mm3). Since the purpose of this paper is to compare the mechanical properties of three
conformal lattice structures with the same design variables, it is not important to get the accurate range of manufacturable dimensions, as long as it is within the resolution and manufacturability of the SLM process used in this paper.
3. Finite element modelling methodology 3.1 Aluminium alloy AlSi10Mg
The aluminium alloy applied is AlSi10Mg from SLM Solutions. It is a widely used alloy for casting and in AM [41, 42]. The hypoeutectic alloy is near the eutectic composition (12.5% Si) which is responsible for the excellent casting properties. According to the experiment by Kempen et al. [43], the mechanical properties of SLM-printed AlSi10Mg parts are higher or at least comparable to the casted AlSi10Mg in terms of very fine microstructure and fine distribution of Si phase. The Young’s modulus of parts built in diagonal direction with layer thickness of 30μm is 63±4 GPa and the Poisson’s ratio is 0.33.
3.2 Mesh generation
Fig. 2 Mesh-sensitivity study by maximum stress to number of divisions for strut in h direction. 3.3 Loading cases
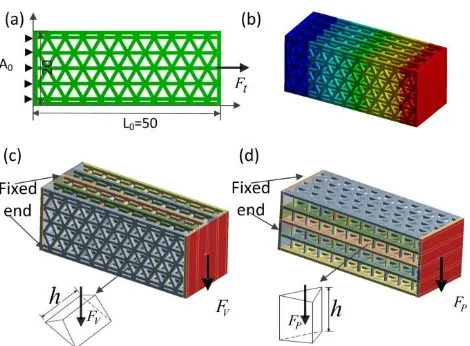
In order to obtain the E* which will be defined in section 4, the mechanical behaviour was investigated under axial tension and bending as shown in Fig. 3. In both cases, the left end was fixed and a force was axially applied on the other end. In the axial tension case, a concentrated forceF, was applied as shown in Fig. 3(a). Fig. 3(b) shows the contour plot of displacement distribution by axially force F. In the bending case, the force was applied in two directions: perpendicular to the height,h, of the unit cell (Fig. 3(c)) and parallel to the height, h (Fig. 3(d)). The perpendicular force is referred to asFVand the parallel force is FP, where FV = FP = 200 N.
Fig. 3 Boundary conditions applied to FEA model, (a) boundary conditions with left side fixed and axial force on the right, (b) contour plot of displacement distribution under axial stretch, (c) bending test with left end fixed and concentrated force perpendicular to the height of unit cell, (d) bending test with left end fixed and concentrated force parallel to the height of unit cell.
3.4 Simulation demonstrations
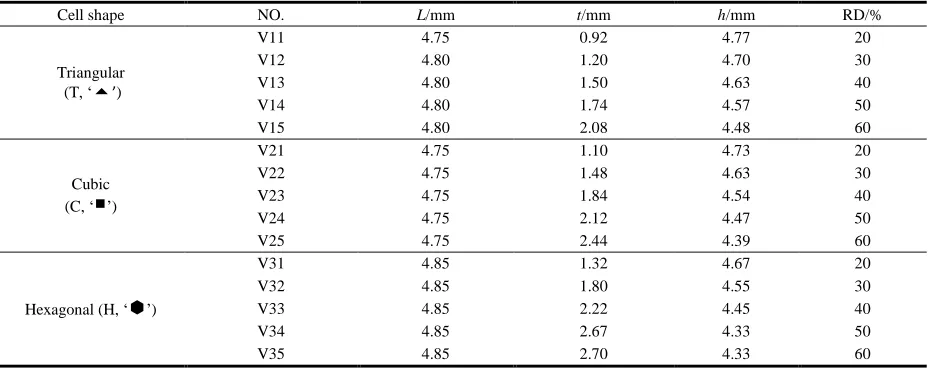
Three cases of simulation experiments by FEA were implemented. Three unit cells [Triangular (T), Cubic (C), and Hexagonal (H)] are used to construct lattice structures with the same relative density (RD) [6], the same base areas A (AT, AC, AH) of the unit cells and equal dimensions of the struts of the three unit cells.
[image:5.612.73.308.372.545.2]As listed in Table1, V11-V15, V21-V25, and V31-V35 are geometry parameters of five sampling points in each group of lattice structures with triangular unit cell (denoted as ‘T’ and symbolized as ‘’), cubic unit cell (denoted as ‘C’ and symbolized as ‘
’), and hexagonal unit cell (denoted as ‘H’ and symbolized as ‘’), respectively. RD for each group gradually increases from 20% to 60%. RD is defined by the following formula:% 100
RD (1) where ρ*is the effective density covered in the general dimensions of the lattice structures and can be measured by Creo®, ρ is the density of the wall material.
[image:6.612.68.537.267.452.2]For each given value of RD, there are many combinations of shape parameters making RDs of all the three lattice structures equal. Here L and h were kept extremely similar, but t was varied. It can be seen that although RDs of lattice structures with different unit cells are all equal, the dimension may vary a lot. Particularly for each value of RD, when L and h are slightly changed, tT remains the smallest with the relation tT<tC<tH.
Table 1 Parameters of lattice structures of all three unit cells with the same RD.
Cell shape NO. L/mm t/mm h/mm RD/%
Triangular (T, ‘’)
V11 4.75 0.92 4.77 20
V12 4.80 1.20 4.70 30
V13 4.80 1.50 4.63 40
V14 4.80 1.74 4.57 50
V15 4.80 2.08 4.48 60
Cubic (C, ‘
’)V21 4.75 1.10 4.73 20
V22 4.75 1.48 4.63 30
V23 4.75 1.84 4.54 40
V24 4.75 2.12 4.47 50
V25 4.75 2.44 4.39 60
Hexagonal (H, ‘’)
V31 4.85 1.32 4.67 20
V32 4.85 1.80 4.55 30
V33 4.85 2.22 4.45 40
V34 4.85 2.67 4.33 50
V35 4.85 2.70 4.33 60
Case 2:
h
T=h
C=h
H, A
T=A
C=A
HWhen all lattice structures were designed with the same volume, namely hT=hC=hH and AT=AC=AH as shown in Fig.
4, the relation among LT, LC and LH can be derived by the following formulae.
Because
H C
T A A
A (2) where 2 4 3 T T L
Fig. 4 Diagram ofhT=hC=hH, AT=AC=AH. 2
C C L
A (4)
2 2
3 3
H
H L
A (5)
Hence, LT and LC can be represented by LH as followings,
H
T L
L 6 (6)
H
C
L
L
2
3
3
(7)Then the magnitude relation of LT, LC and LH is:
T C
H L L
L (8) From Eqs. (6) and (7), it can be seen that for a given value of LH, LT and LC can be obtained. The shapes of three unit
cells are also determined by these given geometrical parameters. Supposed that RD is a constant, when the unit cell size is decreased, the number of unit cells with smaller cores and thinner struts will be increased. However, when the unit cell size is decreased to a very low value, the cores will become too small for the loose powder to be removed from the part following the completion of SLM [11].
Case 3: h
T=h
C=h
H, L
T=L
C=L
H, t
T=t
C=t
HThe third comparison is to investigate on the differences of designs with all equal sizes of three unit cells as displayed in Fig. 5. The dimension relations of h, L and t can be expressed by Eq. (9).
[image:7.612.73.299.587.670.2]
t
t
t
t
L
L
L
L
h
h
h
h
H C T H C T H C T (9)4. Numerical results and discussion 4.1 Comparison with the same RD
The FEA results based on case 1 are listed in Table 2. E* can be derived by the relation below [6],
Tot t L L A F E / 0
(10)
where σ is normal stress, ε is axial strain, Ft is axial tension force, A0is the total area covered by the cross-section as
shown in Fig. 3, LTot is the total length, and ΔL is the elastic tensile elongation.
In accordance with two loading conditions during bending, the results are also classified as caseⅠ for FV and case Ⅱfor FP. dV is the predicted displacement based on E*, dv is the calculated displacement using FEA and σv,max is the
maximum von Mises stress in the vertical direction. To evaluate the results and demonstrate the capabilities of these lattice structures, the assessed value of stiffness-to-mass ratio RV is applied from [7]. In this paper, it is used to
investigate the differences among these three unit cells filled structures by involving the critical results, the dependent relation between the force, the displacement and the responding weight. Here, RV is given as:
m d F R V V
V / (11)
where m*is the weight of the lattice structure and can be obtained by RD. For a given force, there is an inverse proportion relationship between RV anddVor RP and dp, as well as m*. It can be stated that for a certain force and displacement, the smaller the value of m*, the better the structure performs. In a similar way, for a certain force and mass, the smaller of dv or dp, the structure performs better.
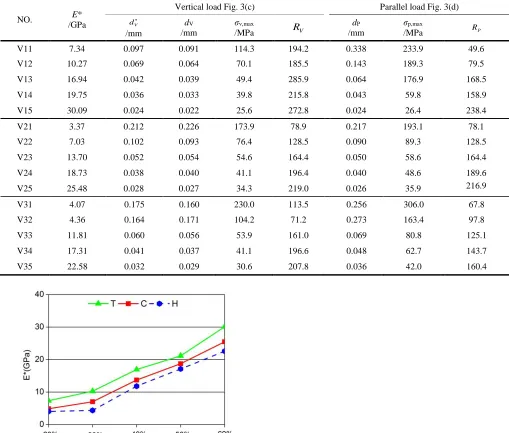
The E* of the lattice structures by FEA are graphed in Fig. 6, where symbol line ‘T’, ‘C’ and ‘H’ denotes lattice
Table 2 Mechanical performance of lattice structures with equal RD.
NO. E*
/GPa
Vertical load Fig. 3(c) Parallel load Fig. 3(d)
V
d /mm
dV /mm
σv,max
/MPa RV
dP /mm
σp,max
/MPa RP
V11 7.34 0.097 0.091 114.3 194.2 0.338 233.9 49.6
V12 10.27 0.069 0.064 70.1 185.5 0.143 189.3 79.5
V13 16.94 0.042 0.039 49.4 285.9 0.064 176.9 168.5
V14 19.75 0.036 0.033 39.8 215.8 0.043 59.8 158.9
V15 30.09 0.024 0.022 25.6 272.8 0.024 26.4 238.4
V21 3.37 0.212 0.226 173.9 78.9 0.217 193.1 78.1
V22 7.03 0.102 0.093 76.4 128.5 0.090 89.3 128.5
V23 13.70 0.052 0.054 54.6 164.4 0.050 58.6 164.4
V24 18.73 0.038 0.040 41.1 196.4 0.040 48.6 189.6
V25 25.48 0.028 0.027 34.3 219.0 0.026 35.9 216.9
V31 4.07 0.175 0.160 230.0 113.5 0.256 306.0 67.8
V32 4.36 0.164 0.171 104.2 71.2 0.273 163.4 97.8
V33 11.81 0.060 0.056 53.9 161.0 0.069 80.8 125.1
V34 17.31 0.041 0.037 41.1 196.6 0.048 62.7 143.7
V35 22.58 0.032 0.029 30.6 207.8 0.036 42.0 160.4
Fig. 6 E* to RD for the three lattice structures.
To validate the effectiveness of displacementdVby E*, the total deformation by direct FEA and the relative error calculated using Eq. (12) are listed in Table 3. As the relative errors and average absolute errors are all within ± 10%, except one 11.2%, it implies the good agreements between two calculation methods. Herein, E* can be the material input into the FEA analysis to evaluate the performance of the final part. It is consistent with the result by Parthasarathy et al. [39].
% 100
V V V
d d d
Table 3 Comparison of displacements by E* and that by FEA.
RD (%) Lattice with triangular prism Lattice with square prism Lattice with hexagonal prism V
d /mm dV/mm δ/% dV/mm dV/mm δ dV/mm dV/mm δ/%
20% 0.086 0.093 7.1 0.215 0.202 -6.3 0.153 0.167 9.4
30% 0.061 0.066 8.0 0.088 0.097 9.8 0.163 0.156 -4.1
40% 0.038 0.040 6.8 0.052 0.050 -3.9 0.054 0.058 8.1
50% 0.032 0.034 8.3 0.04 0.036 3.4 0.035 0.039 11.2
60% 0.021 0.023 8.1 0.026 0.027 1.9 0.027 0.03 9.4
7.7 5.0 8.4
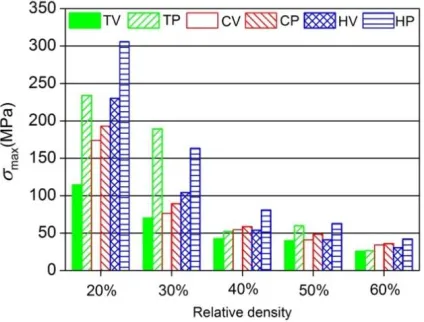
According to Table 2 and Fig. 7, the maximum stress decreases with increasing RD, which can be explained by the increased materials. It is also noted that the maximum stress of triangular unit cell under FV is at the minimum for
each group with the same RD, even though it has the smallest tT (Table 1) compared with the other two prisms.
Another interesting result is that, for all unit cells in each group, the stress level under FV is lower than that of force
FP, revealing the anisotropy property of this design. The reason for this phenomenon lies in the triangular unit cell
within the in xy plane (Fig. 1). It gives good support by proper stability of the triangle, while only reduces non load-bearing materials by isolated struts in z direction. Fig. 7 also depicts that when RD is 20% or 30%, the stress for all three unit cells are in high level, where stresses caused by Fv are much smaller than that by Fp for each unit cell. When RD increases to 40%, 50% to 60%, the stresses by Fv and FP become very close, showing that the shape and
[image:10.612.76.539.92.216.2]size difference become less obvious with regards to structure strength with the arising of bulk materials. It is also worth mentioning that the difference in stress in both directions for square prism structured part is the minimal among all. It can be explained by the symmetry and regularity of rectangle in each face of the square prism. Similar results were obtained by Parthasarathy et al. [39].
Fig. 7 Maximum von Mises stress to relative density (RD). (Note: TV/TP, CV/CP, HV/HP mean the values of σmax were obtained for lattice structures with triangular prism, cubic prism and hexagonal prism under vertical/parallel force, respectively)
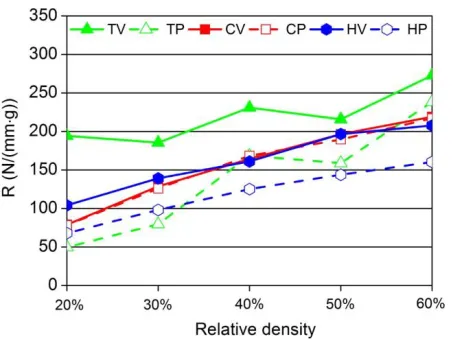
In Table 2 and Fig. 8, the value of strength-to-weight, R, relation is proportional to relative density for all three unit cells, but with some minor differences. The strength-to-weight ratio of the conformal structure with triangular unit cells remains the maximum over the other two unit cells.
[image:10.612.74.286.408.569.2]Fig. 8 R to relative density (RD) of three types of unit cells. (Note: TV/TP, CV/CP, HV/HP mean the values of R were obtained for lattice structures with triangular prism, cubic prism and hexagonal prism under vertical/parallel force, respectively)
4.2 Comparisons with the same volume
In this section, thickness t for all three unit cells is set as 1.0 mm, 1.2 mm and 1.4 mm. For each given thickness, LH
is set as 2.0 mm, 2.2 mm, 2.4 mm, 2.6 mm and 2.8 mm. The side lengths of LT and LC can be derived by Eq. (7) and
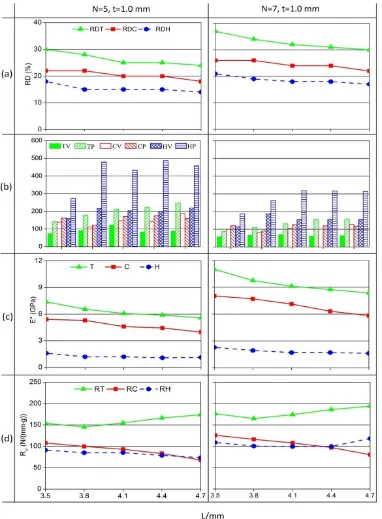
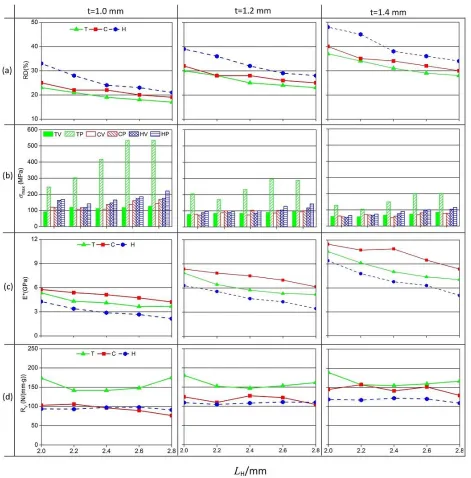
(8). Fig. 9 shows the results by FEA with the same boundary conditions as section 3.3. For all graph in this paper, line symbols with ‘T’, ‘C’ and ‘H’ indicate the property items (RD, σ, E*, R) are based on lattice structures using triangular prism, cubic prism and hexagonal prism, while TV/TP, CV/CP, HV/HP stand for maximum von Mises stress of the lattice structures subjected to vertical/parallel force.
In Fig. 9(a), although the base areas and heights are all equal (identical volume) for lattice structures with hexagonal prism, cubic prism and triangular prism, the RDs are still distinguished that RDH (blue line) is the maximum, RDC
(red line) is intermediate and followed by RDT (green line). It is opposite to the side length relation (Eq. (7)) with
the same base area for all unit cells.
For the maximum stress under FV and FP in Fig. 9(b), when the thickness of the strut is given as 1.0 mm, the maximum stress increases slightly with side length due to the small changed values. It was found that the maximum stress by vertical force is always smaller than that by parallel force with the same magnitude and this regulation is validated when thickness is given as 1.2 mm and 1.4 mm. Among the strength performance, the stress level of the structure with triangular prism subjected to FV is the lowest at every sampling point, while the triangular lattice
prism performs the worst in out-plane direction, since the value of its maximum stress doubles than that in in-plane direction, so as to exceed the yield stress of AlSi10Mg (280 MPa) for most cases.
For E* in Fig. 9(c), when the strut thickness is 1.0 mm, * T
E , *
C
E andE*H decreases when side length increases from 2.0 mm to 2.8 mm. This can be explained by the reduced materials (decreasing RD) due to the increasing side length. The E* of structure with cubic prism is the maximum at each sampling point, followed by that with triangular prism and hexagonal prism. This relationship is the same when t is 1.2 mm and 1.4 mm.
In Fig. 9(d), when side length gradually varies from 2.0 mm to 2.8 mm, the stiffness-to-mass ratio of lattice structure with triangular unit cell (T, green line) attains greater value over that of other lattice structures with cubic prism (C, red line) and hexagonal prism (H, blue line) in general. It is notable that the values of all stiffness-to-mass ratios vary in a certain and stable range. More specifically, both RC and RH range from 100 N/(mm·g) to 150 N/(mm·g),
while RT varies from 150 N/(mm·g) to 200 N/(mm·g), where RT presents larger at points 2.0 mm and 2.8 mm than
that at the other points. It reveals that triangular prism replaced lattice structure exhibits the dominant advantages, the lesser bulk material and the smaller displacement, with the same design constrains and loads conditions. But for lattice structures with triangular unit cells, the change in t does not really affect the RV. The others are slightly
triangular unit cells has significant differences at 2.0 mm and 2.8 mm. This result discloses the importance of parameter ranges for experimental of lattice structures with triangular unit cells.
Fig. 9 Comparison of (a) relative density RD, (b) maximum stressunder Fv and Fp,(c) effective Young’s modulus E*, and (d) stiffness-to-mass ratio under Fv with equal base areas of all three kinds of unit cells.
4.3 Comparisons with all equal dimensions of all unit cells
In Fig. 10(a), N=5 and t=1.0 mm, where h is determined by N and t in RVE. For points L=3.5 to 4.7 mm, RD gradually decreases for all unit cell types. The same tendency is repeated when N=7 and t=1.0 mm. The declines of RD of structures with all three prisms result from the increasing side length of the unit cells. As the values of side length of all three types of unit cells are equal, the base area of triangular unit cell is the smallest according to Eq. (3) to Eq. (5). Hence the total number of unit cells covered in the beam-like bending structures. Therefore the RDT is
always bigger than RDC and RDH for all sampling points.
In Fig. 10(b), when N=5, t=1.0 mm, σTV varies from around 75 MPa to 120 MPa at each sampling point and remains
the minimal compared with σTC and σTH. Distinguished from design with the same base area for all unit cells, the
worst condition occurs to lattice structures with hexagonal prism subjected to parallel force, where σHP is twice as
σHV. As σHP exceeds the yield strength (σs=338 MPa) for the last three sampling points, the values of σHP are
meaningless. In this case, the conformal lattice structures with triangular prism tend to be a preferable option with regard to structural strength. When N=7, t=1.0 mm, the relative density increases with the added two layers, as graphed in Fig. 10(b). The maximum stresses are all reduced at every data point compared with that when N=5 and t=1.0 mm, due to the increment of materials in the restricted volume. Likewise, stress level of model with triangular prism subjected to vertical force continues to be the lowest. Based on above results and analysis, the mechanical properties under vertical force are referred in Fig. 10(c) and (d). Fig. 10(c) shows the dominant strength in terms of
E* of parts with triangular prism, which is followed by that with cubic prism and finally followed by hexagonal prism.
Finally in Fig. 10(d), for the given five sampling points, when N=5, t=1.0 mm, RT ranges from 150 N/(mm·g) to 200
N/(mm·g), and has the distinct advantages over structures designed with other two unit cells, which are around 100 N/(mm·g). It is interesting to note that for cubic, E* is much higher than for H, but the specific strength is quite similar for both. While it should be emphasized that there is no remarkable difference in terms of the value of stiffness-to-mass ratio between N=5 and N=7 with other same shape parameters. In this respect, using triangular prism to fill the conformal cellular structure is preferential design when the shape parameters are all equal for all proposed unit cells.
5. Experimental testing and validation 5.1 Material and specimen manufacturing
[image:13.612.71.313.515.554.2]To verify the effectiveness of using FEA for prediction of the mechanical properties of the lattice structures, some samples were selected and manufactured by SLM technique using AlSi10Mg powders. The composition of the powders are listed in Table 4 [44]. The size range is 20-63 µm. Due to its near eutectic elements of Al and Si, it shows good weldability. Minor additions of Mg (0.20–0.45%) allow hardenability through natural or artificial ageing [41].
Table 4 Chemical composition of the AlSi10Mg powders [44]. Element Al Si Mg Cu Fe Mn Zn Ti Others
wt% Bal. 9-11 0.20-0.45 0.05 0.55 0.45 0.10 0.15 0.3
Fig. 11 Modified design for manufacturing and tensile test with the consideration of shrinkage during manufacturing: (a) original model with meshed unit cells used in FEA, (b) solutions with solid ends for gripping in tensile tests, (c) post-manufacturing with residual stress at the cooled ends and the solid-meshed interface.
With AlSi10Mg powders and STL models of the three designs placed in diagonal direction, the standard printing parameters with SLM280HL were applied as follows:
Laser energy density of 60J/mm3.
Laser beam diameter of Ø 0.1 mm. Layer thickness of 30 µm.
Argon gas shielding.
Table 5 Design parameters of the manufactured specimens. NO. L/mm h/mm t/mm RD/% EFEA/GPa Sample 1 5.88 3.80 1.00 19 4.11 Sample 2 2.20 3.80 1.00 28 3.38 Sample 3 4.90 3.70 1.40 37 10.56
Finally, three samples after post-processing for comparative study as stated in case 2 and results in section 4.2 are displayed in Fig. 12 (a). The shape of the unit cell, geometry parameters and E* according to above numerical results are listed in Table 5. It can be seen that all selected lattice structures were successfully fabricated with fine features. The shrinkage due to the thermal dissipation during the fabrication process did not significantly affect the final general dimensions.
5.2 Bulk tensile testing and results
[image:15.612.72.277.418.490.2]Fig. 12 Prototypes manufactured by SLM process: (a) photos of the samples in front view, (b) picture of samples tested to failure. Taking a specific looking at the fracture surfaces, it was found that the fracture angles are all about 60o along the
boundary of the unit cell. It is quite different from the classical fracture angle of 45o for solid metals. As the focus of
this paper is on linear elastic deformation of the lattice structures, the fracture behaviour will not be further discussed here.
5.3 Comparison of the bulk tensile curves and effective Young’s modulus
The load-extension curves and the converted stress-strain curves of all three samples are plotted in Fig. 13(a) and (b) respectively. Fig. 13(a) describes the whole extension curves of the samples between two gripped ends. It was used to expose how the structure behaved from elastic to plastic and finally fracture. Fig. 13(b) mainly plots the elastic stress-strain relations which were the key region studied in this paper. To be
Fig. 13 Tensile tests of SLM printed AlSi10Mg samples, (a) load-extension curves observed between two gripped ends and (b) converted stress-strain curves mainly in elastic region obtained by extensometer of 25 mm gauge length.
[image:16.612.84.524.376.538.2]Fig. 14 Results by simulation and experimental testing and the relative errors.
In general, the simulation results agree very well with the experimental results, implying that the material properties of the cellular structure are consistent and predictable. It also indicates that the boundary conditions applied to the FEA models are reasonable.
6. Discussions
When the conformal lattice structures were designed with the same RD for all unit cells discussed in this paper, the Young’s modulus, maximum von Mises stress and stiffness-to-mass ratio were differently affected by shape parameters of unit cells. Among all three comparisons of design methods with regular unit cells, the in-plane performances of conformal lattice structures with all three unit cells revealed better structure strength than that in out-plane direction or along the parallel force. Particularly, the stress value of lattice structure with triangular prism remains the smallest in this case.
Relative density is an essential factor to determine the strength of lattice structures. However, it is not a sufficient condition alone. Firstly, suppose the RDs of the lattice structures are all equal as stated in Case 1, the mechanical properties were still varied due to different unit cell shapes. Secondly, even for the same unit cell with the same RD, the mechanical performance is also discrepant. It’s owing to variations of geometrical parameters used to determine dimensions and shapes of the unit cells. For instance, when RDV is 30% in Table 1(V12), where N=5, LT=4.8 mm
and T
t =1.2 mm, the value of E* is 10.76 GPa, the maximum stress is 70.1 MPa and the stiffness-to-mass ratio is 194.8 N/(mm·g). And in Fig. 10, when N=5, LT =3.5 mm andtT=1.0 mm, where RDV is also 30%, but E* is 7.73
GPa, the maximum stress is 74.6 MPa and the stiffness-to-mass ratio is 161.9 N/(mm·g). Also in Fig. 10, when N=7,
LT=4.7 mm andtT=1.0 mm, although the RDV is also 30%, E* is 8.8 GPa, the maximum stress is 64.3 MPa and the
stiffness-to-mass ratio is 200.3 N/(mm·g). According to Fig. 9(a) (c) and Fig. 10(a) and (c), , the values of E* are all proportional to relative density, which is similar to the conclusion for triangular honeycomb by Hunt [13] and Gibson et al [17]. It is noticed that the impact of RD on stress are different for different unit cells. For example, in Fig. 9(a), the value of RDH at each sampling point is the greatest, followed by RDC and RDT. In contrast, the value
of * C
E (Fig. 9(c)) is the biggest followed by * T E and *
C
E . While in Fig. 10(a), when the shape parameters of the unit cells are all equal, value of RDT is the followed by RDC and RDH, their values of Young’s modulus rank in the same
order. Herein, the strength of a cellular material with certain unit cell is dependent on the shape parameters, not only on its RD.
For conformal lattice structure with triangular prism, its Young’s modulus in section 4.1 (Fig. 6) and section 4.3 (Fig. 10(c)) show the maximum value and that in section 4.2 (Fig. 9(c)) present the intermediate value. However, the stiffness-to-mass ratios always exhibit better performance over the other two types of unit cells accordingly. A conclusion can be drawn that for a given load-bearing structure and proposed design constraints, building the lightweight conformal cellular structures with triangular prism unit cells is the best option compared to cubic and hexagonal ones Namely triangular lattice structures have value of high E* by axial tension, lower stress level and the dominant stiffness-to-mass ratio, compared with the commonly used cubic and hexagonal unit cells in structural applications by AM technology.
Sample 1 Sample 2 Sample 3
FEA 4.11 3.38 10.56
Exp 4.27 3.45 9.83
δ -3.7 -1.8 7.4
-4 -1 2 5 8 0 3 6 9 12 R el a ti v e er ro r (% ) E * ( GPa )
To get insight into the mechanism of the advantage of conformal lattice structure with triangular prism, the stress contours of three types of lattice structures obtained from FEA are listed in Fig. 15. All the three models have the same base area of unit cells, the same number of layers in the out-plane direction, as well as the same loads and boundary conditions. It is obvious that the maximum stress locations for all three cases are all within in lower fixed end. The hexagonal lattice structure in Fig. 15(a) has the largest number of unit cells followed by cubic lattice structure in Fig. 15(b). While triangular lattice structure has the fewest and weights the least which is in good accordance with RD relations as graphed in Fig. 9(a). The maximum stress of model with hexagonal unit cell is 165 MPa (Fig. 15(a)). While that with cubic unit cell is 120 MPa (Fig. 15(b)) and that with triangular unit cell is only 92 MPa (Fig. 15(c)). In this aspect, replacing the solid materials with triangular prism is potentially the best solution, regarding to structural strength with the same area of three proposed conformal methods in meso-scale. Besides, the displacements of models in dH (Fig. 15 (a)), dC (Fig. 15 (b)) and dT (Fig. 15 (c)) have the relation dH>dC>and dT.
[image:18.612.73.319.222.553.2]Herein, the shape of the unit cell has a high impact on the strength performance of the lattice structure.
Fig. 15 Comparison of maximum stress and maximum displacement under Fv with equal base area of (a) triangular unit cell, (b) cubic unit cell and (c) hexagonal unit cell.
advantages. Interesting to note in Fig. 15(c), the inter-connected triangular unit cells form the shape of hexagonal unit cells which are strengthened by inner strut as highlighted in Fig. 15(c) c1. Besides, equilateral parallelogram is also included in the scaled triangular unit cells but is distorted and strengthened by one inner strut as highlighted in Fig. 15(c) c2. Therefore, based on the stress trajectory in Fig. 15(a), stress distribution in all three contours in Fig. 15, and unique inter-connected struts, using triangular lattice method to create the tailored and conformal cellular structure is a preferable approach for a load-bearing beam in terms of mechanical performance, such as Young’s modulus, maximum stress and value of stiffness-to-mass ratio.
7. Conclusions
To take the advantage of lightweight design method based on lattice structures by additive manufacturing, the mechanical performances of three potential unit cells were investigated. In this work, a design method was proposed for the uniformly replaced beam-like lattice structures by three unit cells, triangular prism, square prism and hexagonal prism. The numerical results revealed that when the new conformal design was begun with equal relative density, the vertical displacements according to E* by axial tensile force were in great agreement with that by direct calculation of FEA for all three conformal methods. The relative errors were all within ±10%, showing that it was reasonable to use E* for calculation of bending of lattice structures. When the design was begun with equal area and height, although the lattice structure with triangular prism had the minimal relative density and the median of Young’s modulus, it still had the lowest stress level under the vertical end force and achieved the maximum stiffness-to-mass ratio. It should be noticed that this cellular method performed the worst under parallel force. When design was begun with the same dimensions of side length of all three unit cells, not only the Young’s modulus of triangular prism conformal structure ranked the maximum, but the stiffness-to-mass ratio also presented the maximum value. The good agreements between the calculated E* and experimental results validated the FEA method applied. The relative density is proportional to E*, which is, however, more reliable on shapes and parameters of unit cell. As a conclusion, the lattice structure with triangular unit cell is the best in terms of minimum stress and maximum stiffness-to-mass ratio under vertical force subjected to one end of the beam-like structure. It was observed in experiments that the initial fracture frequently occurred at transition region between meshed part and solid ends, where there is a big difference of stiffness. The E* proposed in this paper can be used to estimate load transmission and the deformation of bulk material with number of unit cells greater than 2×5×2, i.e. 2 rows, 5 volumes and 2 layers. This is extremely useful in the initial analysis of the lattice structures made of these unit cells at the design stage. However, it cannot represent the local stress concentration within the unit cells and therefore accurate fatigue life calculation cannot be obtained either. Further work may include the comparison among more unit cells, such as recently developed re-entrant auxetic lattice structure [1] and body-centred cubic lattice structure [27]. The fundamental study of triangular lattice structures would also be carried out by theoretical analysis and experimental testings in the future.
References
1. Yang, L., Harrysson, O., Cormier, D., et al., Additive Manufacturing of Metal Cellular Structures: Design and Fabrication. Jom, 2015. 67(3): p. 608-615.
2. Gervasi, V.R. and Stahl, D.C. Design and fabrication of components with optimized lattice microstructures. in Proceedings of the Solid Freeform Fabrication Symposium. 2004. Austin, TX.
3. Li, Z., Zhang, D.Z., Dong, P., et al., A lightweight and support-free design method for selective laser melting. The International Journal of Advanced Manufacturing Technology, 2016: p. 1-11.
4. Rosen, D.W. Design for additive manufacturing: A method to explore unexplored regions of the design space. in Eighteenth Annual Solid Freeform Fabrication Symposium. 2007.
5. Hao, L. and Raymond, D. Design and additive manufacturing of cellular lattice structures. in The International Conference on Advanced Research in Virtual and Rapid Prototyping (VRAP). Taylor & Francis Group, Leiria. 2011.
6. Choi, J. and Chae, T.-S., Effective stiffness and effective compressive yield strength for unit-cell model of complex truss. International Journal of Mechanics and Materials in Design, 2015. 11(1): p. 91-110.
7. Reinhart, G. and Teufelhart, S., Load-adapted design of generative manufactured lattice structures. Physics Procedia, 2011. 12: p. 385-392.
9. Park, S.-I., Rosen, D.W., Choi, S.-k., et al., Effective mechanical properties of lattice material fabricated by material extrusion additive manufacturing. Additive Manufacturing, 2014. 1: p. 12-23.
10. Luxner, M.H., Stampfl, J., and Pettermann, H.E., Finite element modeling concepts and linear analyses of 3D regular open cell structures. Journal of Materials science, 2005. 40(22): p. 5859-5866.
11. Yan, C., Hao, L., Hussein, A., et al., Evaluations of cellular lattice structures manufactured using selective laser melting. International Journal of Machine Tools and Manufacture, 2012. 62: p. 32-38.
12. Giannitelli, S., Accoto, D., Trombetta, M., et al., Current trends in the design of scaffolds for computer-aided tissue engineering. Acta biomaterialia, 2014. 10(2): p. 580-594.
13. Hunt, H., The mechanical strength of ceramic honeycomb monoliths as determined by simple experiments: Advanced materials. Chemical engineering research & design, 1993. 71(3): p. 257-266..
14. Yan, C., Hao, L., Hussein, A., et al., Microstructure and mechanical properties of aluminium alloy cellular lattice structures manufactured by direct metal laser sintering. Materials Science and Engineering: A, 2015. 628: p. 238-246.
15. Brennan-Craddock, J., Brackett, D., Wildman, R., et al. The design of impact absorbing structures for additive manufacture. in Journal of Physics: Conference Series. 2012. IOP Publishing.
16. Alzahrani, M., Choi, S.-K., and Rosen, D.W., Design of truss-like cellular structures using relative density mapping method. Materials & Design, 2015. 85: p. 349-360.
17. Gibson, L.J. and Ashby, M.F., Cellular solids: structure and properties. 1999: Cambridge university press. 18. Jin, T., Zhou, Z., Wang, Z., et al., Experimental study on the effects of specimen in-plane size on the
mechanical behavior of aluminum hexagonal honeycombs. Materials Science and Engineering: A, 2015. 635: p. 23-35.
19. Ju, J. and Summers, J.D., Compliant hexagonal periodic lattice structures having both high shear strength and high shear strain. Materials & Design, 2011. 32(2): p. 512-524.
20. Brenne, F., Niendorf, T., and Maier, H.J., Additively manufactured cellular structures: Impact of microstructure and local strains on the monotonic and cyclic behavior under uniaxial and bending load.
Journal of Materials Processing Technology, 2013. 213(9): p. 1558-1564.
21. Li, P., Constitutive and failure behaviour in selective laser melted stainless steel for microlattice structures.
Materials Science and Engineering: A, 2015. 622: p. 114-120.
22. Ahmadi, S.M., Campoli, G., Amin Yavari, S., et al., Mechanical behavior of regular open-cell porous biomaterials made of diamond lattice unit cells. J Mech Behav Biomed Mater, 2014. 34: p. 106-15.
23. Gibson, L.J. and Ashby, M. The mechanics of three-dimensional cellular materials. in Proceedings of the Royal Society of London A: Mathematical, Physical and Engineering Sciences. 1982. The Royal Society. 24. Ashby, M.F. and Medalist, R.M., The mechanical properties of cellular solids. Metallurgical Transactions
A, 1983. 14(9): p. 1755-1769.
25. Onck, P., Andrews, E., and Gibson, L., Size effects in ductile cellular solids. Part I: modeling. International Journal of Mechanical Sciences, 2001. 43(3): p. 681-699.
26. Youssef, S., Maire, E., and Gaertner, R., Finite element modelling of the actual structure of cellular materials determined by X-ray tomography. Acta Materialia, 2005. 53(3): p. 719-730.
27. Smith, M., Guan, Z., and Cantwell, W.J., Finite element modelling of the compressive response of lattice structures manufactured using the selective laser melting technique. International Journal of Mechanical Sciences, 2013. 67: p. 28-41.
28. Eshraghi, S. and Das, S., Micromechanical finite-element modeling and experimental characterization of the compressive mechanical properties of polycaprolactone–hydroxyapatite composite scaffolds prepared by selective laser sintering for bone tissue engineering. Acta biomaterialia, 2012. 8(8): p. 3138-3143. 29. Gorguluarslan, R.M., Gandhi, U.N., Mandapati, R., et al., Design and fabrication of periodic lattice-based
cellular structures. Computer-Aided Design and Applications, 2016. 13(1): p. 50-62.
30. Evans, A.G., Hutchinson, J.W., Fleck, N.A., et al., The topological design of multifunctional cellular metals. Progress in Materials Science, 2001. 46(3): p. 309-327.
31. Wang, H., Chen, Y., and Rosen, D.W. A hybrid geometric modeling method for large scale conformal cellular structures. in ASME 2005 International Design Engineering Technical Conferences and Computers and Information in Engineering Conference. 2005. American Society of Mechanical Engineers. 32. Williams, C.B., Cochran, J.K., and Rosen, D.W., Additive manufacturing of metallic cellular materials via
three-dimensional printing. The International Journal of Advanced Manufacturing Technology, 2011. 53(1): p. 231-239.
34. Seepersad, C.C., Kumar, R.S., Allen, J.K., et al., Multifunctional design of prismatic cellular materials.
Journal of Computer-Aided Materials Design, 2004. 11(2): p. 163-181.
35. Lee, S., Barthelat, F., Moldovan, N., et al., Deformation rate effects on failure modes of open-cell Al foams and textile cellular materials. International Journal of Solids and Structures, 2006. 43(1): p. 53-73.
36. Read, N., Wang, W., Essa, K., et al., Selective laser melting of AlSi10Mg alloy: Process optimisation and mechanical properties development. Materials & Design, 2015. 65: p. 417-424.
37. Niu, J., Choo, H.L., and Sun, W., Finite element analysis and experimental study of plastic lattice structures manufactured by selective laser sintering. Proceedings of the Institution of Mechanical Engineers, Part L: Journal of Materials: Design and Applications, 2017. 231(1-2): p. 171-178.
38. Deshpande, V.S., Fleck, N.A., and Ashby, M.F., Effective properties of the octet-truss lattice material.
Journal of the Mechanics and Physics of Solids, 2001. 49(8): p. 1747-1769.
39. Parthasarathy, J., Starly, B., and Raman, S., A design for the additive manufacture of functionally graded porous structures with tailored mechanical properties for biomedical applications. Journal of Manufacturing Processes, 2011. 13(2): p. 160-170.
40. Wang, D., Yang, Y., Liu, R., et al., Study on the designing rules and processability of porous structure based on selective laser melting (SLM). Journal of Materials Processing Technology, 2013. 213(10): p. 1734-1742.
41. Brandl, E., Heckenberger, U., Holzinger, V., et al., Additive manufactured AlSi10Mg samples using Selective Laser Melting (SLM): Microstructure, high cycle fatigue, and fracture behavior. Materials & Design, 2012. 34: p. 159-169.
42. Maskery, I., Aboulkhair, N.T., Corfield, M.R., et al., Quantification and characterisation of porosity in selectively laser melted Al–Si10–Mg using X-ray computed tomography. Materials Characterization, 2016. 111: p. 193-204.
43. Kempen, K., Thijs, L., Van Humbeeck, J., et al., Mechanical Properties of AlSi10Mg Produced by Selective Laser Melting. Physics Procedia, 2012. 39: p. 439-446.
![Table 4 Chemical composition of the AlSi10Mg powders [44].](https://thumb-us.123doks.com/thumbv2/123dok_us/8579630.369597/13.612.71.313.515.554/table-chemical-composition-alsi-mg-powders.webp)