1
J. Dairy Sci. 100:1–14
https://doi.org/10.3168/jds.2016-12012
© 2017, THE AUTHORS. Published by FASS and Elsevier Inc. on behalf of the American Dairy Science Association®. This is an open access article under the CC BY-NC-ND license (http://creativecommons.org/licenses/by-nc-nd/3.0/).
ABSTRACT
Claw horn disruption lesions (CHDL) are a major cause of lameness in dairy cattle and are likely a result of excessive forces being applied to the germinal epithe-lium that produces the claw horn. The digital cushion is a connective tissue structure, containing depots of adipose tissue, that sits beneath the distal phalanx and has been shown to be thicker in fatter cows. Body condi-tion score (BCS) loss is a risk factor for CHDL, and one possible explanation is that fat is mobilized from the digital cushion during negative energy balance, causing the digital cushion to thin and lose force-dissipating ca-pacity, leading to disruption of claw horn growth. This prospective cohort study investigated the association between measures of body fat and sole soft tissue (SST) thickness (a combined measure of the corium and digital cushion beneath the distal phalanx) in a longitudinal manner. The SST of 179 cows in 2 high-yielding dairy herds were measured at 5 assessment points between 8 wk before and 35 wk postcalving. The BCS, back fat thickness (BFT), and lesion incidence were recorded. Data were analyzed in a 4-level mixed effects regression model, with the outcome being SST thickness beneath the flexor tuberosity of the distal phalanx. Data from 827 assessment points were available for analysis. The overall mean of SST was 4.99 mm (standard deviation: 0.95). The SST was thickest 8 wk before calving (5.22 mm, standard deviation: 0.91) and thinnest 1 wk post-calving (4.68 mm, standard deviation: 0.87), suggesting an effect of calving on SST. The BFT was positively correlated with SST in the model with a small effect size (a 10 mm decrease in BFT corresponded with a 0.13 mm decrease in SST), yet the nadir of BFT was 11.0 mm at 9 to 17 wk postcalving (when SST was
~4.95 mm), rather than occurring with the nadir of SST immediately after calving. The SST also varied with other variables [e.g., cows that developed a sole ulcer or severe sole hemorrhage during the study had thinner SST (−0.24 mm)], except when a sole ulcer was present, when it was thicker (+0.53 mm). Cows that developed lesions had a thinner digital cushion before the lesion occurrence, which became thickened with sole ulcer presence, perhaps representing inflammation. Furthermore, although BFT was correlated with SST over time, SST may also have been influenced by other factors such as integrity of the suspensory apparatus, which could have a major effect on CHDL. Measures of body fat likely contributed to having thin SST, but other factors including calving, herd, and lesion pres-ence also had an effect.
Key words: dairy cow, lameness, body condition, digital cushion
INTRODUCTION
Claw horn disruption lesions (CHDL: sole hemor-rhage, sole ulcer, and white line disease) cause a large proportion of lameness in dairy cattle and have a high rate of recurrence (Hirst et al., 2002; Reader et al., 2011; Green et al., 2014). These diseases are prevalent in developed dairy systems worldwide (Barker et al., 2007; Dippel et al., 2009; Foditsch et al., 2016), signifi-cantly affect cow welfare and farm profitability (Booth et al., 2004; Sogstad et al., 2006; Cha et al., 2010), and have a plethora of associated risk factors (Cramer et al., 2009; Chapinal et al., 2013; Solano et al., 2015). Sole ulcers and sole hemorrhage appear to be differ-ent presdiffer-entations of a similar disease process, which is likely through insult to the germinal epithelium of the sole and poor quality horn production, as a result of in-appropriate transfer of forces through the foot (Bicalho and Oikonomou, 2013; Nuss, 2014); white line disease may also precipitate from the same disease process where contusions occur in the soft tissues around the
A prospective cohort study of digital cushion and corium thickness. Part 1:
Associations with body condition, lesion incidence, and proximity to calving
R. F. Newsome,*1 M. J. Green,* N. J. Bell,† N. J. Bollard,* C. S. Mason,‡ H. R. Whay,§ and J. N. Huxley*
*School of Veterinary Medicine and Science, University of Nottingham, Sutton Bonington Campus, Sutton Bonington, Leicestershire, LE12 5RD, United Kingdom
†Royal Veterinary College, Hawkshead Lane, North Mymms, Hertfordshire, AL9 7TA, United Kingdom ‡Scotland’s Rural College (SRUC), Kings Buildings, West Mains Road, Edinburgh, EH9 3JG, United Kingdom §School of Veterinary Sciences, University of Bristol, Langford House, Langford, BS40 5DU, United Kingdom
Received September 18, 2016. Accepted February 19, 2017.
periphery of the base of the foot (Le Fevre et al., 2001; Newsome et al., 2016).
Epidemiological studies have demonstrated that body condition loss preceded lameness events, whether lameness was defined by visual detection of impaired mobility (Lim et al., 2015; Randall et al., 2015) or by CHDL treatment incidence (Green et al., 2014). The distal phalanx is suspended from the hoof wall by strong ligamentous attachments, referred to as the suspensory apparatus of the distal phalanx, and is supported by the digital cushion, which is a modified layer of the sub-cutis that is situated beneath the caudal aspect of the distal phalanx. The cushion and associated structures are considered to be important in absorbing impact and dissipating forces during foot strike and limb loading, protecting the germinal epithelium that produces the sole horn (Lischer et al., 2002). Thickness of the digital cushion has been assessed in several studies that used ultrasonography to measure the distance from the in-ner aspect of the claw horn to the distal surface of the distal phalanx, beneath the flexor tuberosity. The mea-surement incorporates 2 tissue layers: the subcutis (i.e., the digital cushion) and the dermis (corium). Previous works have termed combined measurements of the 2 tissue layers as “digital cushion thickness,” where the measurement was taken beneath the axial aspect of the flexor tuberosity (Bicalho et al., 2009; Machado et al., 2011), or “sole soft tissue thickness,” where the mea-surement was taken in the midline of the sole (Toholj et al., 2014).
Bicalho et al. (2009) reported that BCS was posi-tively associated with digital cushion thickness. This association could be biologically plausible because the digital cushion contains adipose tissue (Räber et al., 2004, 2006); therefore, lipid could be deposited to and mobilized from the digital cushion during periods of positive and negative energy balance. Further, having a thin digital cushion and corium thickness appears to predispose subsequent lameness from CHDL (Machado et al., 2011; Toholj et al., 2014). A possible mechanism for the temporal association between body condition loss and lameness is that fat is mobilized from the digital cushion during negative energy balance, which leads to depletion of the digital cushion, poorer force dissipation of forces during foot strike, greater peak forces on the germinal epithelium, leading to hemor-rhage and interrupted epidermal differentiation and cornification, the formation of poor quality sole horn, and subsequent lameness. However, previous works as-sessing the digital cushion and corium have assessed their combined thickness at a single time point (Bicalho et al., 2009; Machado et al., 2011; Toholj et al., 2014), and whether the digital cushion becomes thinner as body fat is mobilized is yet to be demonstrated. This
is a key step in demonstrating whether digital cushion depletion with body condition loss is a mechanism by which cows develop CHDL.
The current article presents a prospective cohort study of the sole soft tissues (a combined measure of thickness of the digital cushion and the corium), lame-ness and lesions, and analyses of associations between sole soft tissue thickness and measures of body fat. The aim of this analysis was to determine how the digital cushion changes throughout lactation and with changes in measures of body fat.
MATERIALS AND METHODS
Study Design
A prospective cohort study assessed the combined thickness of the digital cushion and corium (termed sole soft tissue thickness) on the hind claws at 5 time points (termed assessment points; AP) between ap-proximately 8 wk before and 35 wk postcalving. The null hypothesis stated that sole soft tissue thickness did not vary with measures of body fat. Animals were stud-ied during first, second, third, or fourth lactation, from before calving. On the hind feet, the sole soft tissues were measured ultrasonographically and foot lesions were recorded at each AP, and cows were locomotion scored every 2 wk from calving. Local ethical approval was granted by the University of Nottingham School of Veterinary Medicine and Science Ethical Review Com-mittee.
Timing of Assessment Points
Animals were enrolled at the first AP, which was at approximately 8 wk before their predicted calving date, termed AP−8. The second AP occurred between 4 and 10 d postcalving and was termed AP+1 (ap-proximately 1 wk postcalving). The third AP was at 6, 8, or 10 wk after AP+1 and this period was assigned se-quentially within each lactation group, such that cows from each lactation group were studied across the range of likely timings of peak yield. This third AP occurred on average 9 wk postcalving and was termed AP+9, and the variation in this timing was accounted for by testing a polynomial function of DIM in the statistical analysis. Assessment points 4 and 5 were 8 and 20 wk after AP+9 (AP+17 and AP+29, respectively).
Study Farms
ensure ease of access to cows, good handling facilities, and willingness of farm managers to accommodate the study. High-producing herds were selected because cows in such systems were more likely to undergo body condition change during lactation. Cow data and man-agement systems information are outlined in Table 1. Both farms fed a partial mixed ration. Mixed ration was provided ad libitum at the feed face, which was based predominantly on maize and whole crop wheat silages on farm 1 and a combination of alfalfa and whole crop wheat silages on farm 2. The aim of mixed ration formulation was to provide for maintenance en-ergy requirements and 30 L of milk production, and was supplemented with concentrate feed at a rate of 0.45 kg/L for parity >1 or parity 1 animals producing >26 or >22 L per day, respectively. The exact formula-tion of the raformula-tions varied throughout the course of the study, but the overall aims of the diet did not vary. An example mixed ration analysis for each farm is shown in Table 1 (Biotal Forage Analysis, Worcester, UK).
All animals on both farms were trimmed by a pro-fessional foot trimmer every 4 to 6 mo; the claws on all feet were trimmed if considered to be overgrown. Additionally, lame cows were treated when identified as lame by stockpersons and this method of lameness management continued as normal throughout the study period.
Sample Size and Subject Enrolment
Sample size was estimated based on the data re-ported by Bicalho et al. (2009). The calculation was based on a 2-sample t-test with α = 0.05 and β = 0.8, and estimated that 108 cows were required in each of 2 groups to detect a difference in sole soft tissue thickness of 1 mm, which was the difference reported between cows with BCS 2 and 3 in that study. Due to the longitudinal study design in the current study and statistical analyses in multi-level frameworks (see below), this estimate was likely to be conservative and the target was to have at least 150 cows completing all 5 AP. Animals were enrolled at approximately 8 wk before calving for their first, second, third, or fourth lactation, if there was no intention to cull before the end of the subsequent lactation and until the necessary sample size was reached.
Collection of Assessment Point Data
At each AP throughout the study, cows were indi-vidually restrained in a foot trimming crush (farm 1: Electric Hoofcare Crush, GDS-Hoofcare, the Nether-lands; farm 2: SA35 Cattle Crush, Wopa, UK) and data
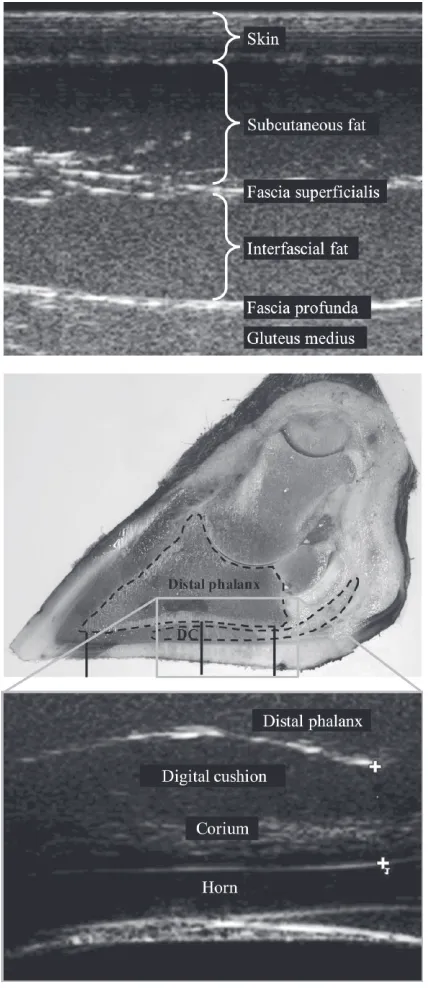
were collected as follows. Body condition score on a 1 to 5 scale with quarter-point intervals (Wildman et al., 1982; Edmonson et al., 1989). Additionally, back fat thickness (BFT) was measured using B-mode ul-trasonography (MyLab30 scanner, Esaote Europe BV, Cambridge, UK) with a 5-cm linear transducer set at 7.5 MHz (resolution: 0.1 mm). Coupling gel was used at all scanning interfaces. The transducer was placed 5 to 10 cm cranial to the tuber ischium, perpendicular to the skin on a line to the tuber coxa, to visualize the fascia profunda (Figure 1), as described by Schröder and Staufenbiel (2006). Two images of BFT were ob-tained from both the left and the right hand side of the cow. Ultrasonograms were saved for measurement of BFT after the study period was complete, when file order was randomized and a blinded observer measured the distance from the external surface of the skin to the fascia profunda, using electronic calipers using the open-source platform Fiji (Schindelin et al., 2012) for the image analysis software ImageJ (Schneider et al., 2012).
Foot lesions were assessed as follows. The hind feet were raised in turn and inspected for overgrowth. If the claw was deemed to be overgrown, a functional foot trim was performed according to a modification of the Dutch method; a set claw length was not used (Archer et al., 2015) but emphasis was placed on maintain-ing claw angles (Manske et al., 2002). When a claw was deemed to be in shape, a very thin (<0.5 mm) shaving was removed from the plantar surface of the whole foot (Leach et al., 1998) to clearly visualize any lesions present. A photograph was taken of the sole with a 12-megapixel digital camera (Cyber-shot DCS-W510, Sony Europe Ltd., Surrey, UK) held square to the claw, 30 cm distant. Photographs were stored for lesion analysis after the on-farm data collection was complete. Briefly, for the current analysis lesions were categorized as sole ulcer, severe sole hemorrhage, se-vere white line lesion, or a digital dermatitis lesion; Newsome et al. (2017) describes the full lesion analysis, which was based on lesion descriptors previously used in the literature (Dopfer et al., 1997; Leach et al., 1998; Sogstad et al., 2007).
(Figure 1). Two replicate images were taken at each site and stored for measurement later. After the study period, image order was randomized as for BFT, and measurements were taken; measurements at these sites included the corium (dermis) at all sites and the digital cushion (subcutis) at sites 2 and 3. The term “sole soft tissue thickness” at sites 1, 2, and 3 is used in this study to describe the thickness of the soft tissues between the sole horn and distal phalanx.
[image:4.612.46.547.88.548.2]The complete data set of back fat and sole soft tis-sue ultrasonographic measurements consisted of 23,598 measurements. Raw data were checked by inspecting and re-measuring outlying data points. Next, 2.5% of ultrasonograms were randomly selected and re-measured; the R2 value between checked and original was 0.992. Within-AP repeatability was assessed by comparing replicate measures. The R2 value was 0.988 and repeatability was deemed to be very good.
Table 1. Farm systems1 and animal data for 2 study farms used in a prospective cohort study of the digital cushion, hoof lesions, and lameness
Variable Farm 1 Farm 2
Housing
Milking system 4 × Lely A3 automatic milking systems 4 × Lely A4 automatic milking systems Management groups
(randomly assigned) 4 groups, 1 robot per group 2 groups, 2 robots per group
Number of cubicles 241 240
Total floor area, m2 1,196 (excluding cubicles) 1,016 (excluding cubicles)
Floor type Rubber matting Concrete slats
Shed roof type Pitched, open ridge Pitched, open ridge
Shed ventilation Combination of natural and fan-assisted
ventilation Natural ventilation via side-walls Precalving heifer housing Cubicle sheds from 6 mo old, with rubber mats
in cubicles and concrete passageways At pasture during spring, summer, and autumn months from 6 mo old, or indoors on deep straw bedding, weather dependent
Cubicle dimensions, m
Width 1.16 1.12
Neck rail height 1.2 1.3
Length to brisket board 1.75 1.85
Curb height 0.2 0.16
Management
Foot bathing protocol 3 times per week: 2 × 4% formalin solution, 1 ×
5% copper sulfate solution Every 2 wk, alternating between 4% formalin solution and 5% copper sulfate solution
Scraper frequency Once every hour Once every hour
Animal data
No. of cows milking Average: 175 (maximum 190) Average: 201 (maximum 210)
Breed 100% Holstein ≥75% Holstein genetics. Brown Swiss and
Ayreshires had been crossed into the herd. Age at first calving,2 mo Mean: 25.8 (median: 25.6) Mean: 26.8 (median: 26.7)
Milk frequency, per day2 2.9 3.5
Mean farm 305-d yield,3 kg 11,380 12,350
Calving interval,2 d Mean: 366 (median: 394) Mean: 401 (median: 411)
Lactation length,2 d Mean: 305 (median: 310) Mean: 311 (median: 308)
Feeding information
Feed type Partial mixed ration: mixed ration ad libitum at feed face, supplemented with concentrates to production in parlor
Partial mixed ration: mixed ration ad libitum at feed face, supplemented with concentrates to production in parlor
Feed frequency (ration) 1 per day 1 per day
Push-up frequency 6 per day 11 per day
Analysis of mixed ration3
DM, % 38 39
ME, MJ/kg of DM 12.1 12.4
CP, g/kg of DM 160 181
Sugar, g/kg of DM 32 15
Starch, g/kg of DM 270 205
NDF, g/kg of DM 415 480
Oil, g/kg of DM 55 60
Feed space length/cow, m 0.83 0.63
Feed space partitioning 184 headlocks 192 headlocks
Water points 2 m × 0.6 m water troughs (n = 18) 2 m × 0.6 m water troughs (n = 16)
1Lely UK, St Neots, UK.
2Animal data that apply to animals studied.
Other Data Collection
In addition to data collected at each AP, withers height was recorded at AP−8. Animal data and pro-duction data were collected from farm management software (UNIFORM-Agri, Somerset, UK). Weigh cells were present in the milking robots on farm 1. On farm 2, weigh cells (HD1010 Load Bars, Tru-Test Ltd., Auckland, New Zealand) were installed beneath the foot trimming crush and BW was recorded at each AP. Weigh cells were checked throughout the study using known weights, and readings remained consistent.
Management of Dropouts and Missing Data
An AP was terminated early if a cow became unduly stressed during an assessment, or missed completely if temperament posed a risk to handlers or herself, or for health reasons such as mastitis. If a clear ultrasono-graphic image could not be obtained, an image of the sole soft tissues was not taken. If a block was present on a claw, the nonblocked claw was still imaged, but no ultrasonographic measurement could be taken from the blocked claw (this occurred at <10 claw assessments). Reasons for missing data and exclusions were recorded and other data collected on that cow at the same or other AP were included in analyses where sufficient data were available. If a cow missed ≥3 consecutive AP, the cow was excluded from the study.
Summary of Terms Used in Analysis
Assessment point (± the number of weeks relative to calving): at which a cow was assessed for BFT, BCS (assessed visually), sole soft tissue thickness, and foot lesions.
Back fat thickness: an ultrasonographic measure of back fat over the gluteus medius muscle.
Claw horn disruption lesion: sole ulcer, severe sole hemorrhage, severe white line hemorrhage, or severe white line separation.
Sole soft tissue thickness, at sites 1 to 3: ultrasono-graphic measures of the soft tissues between the inner margin of the sole and the border of the distal phalanx (Figure 1), taken in the midline of the sole, at
• Site 1: Corium thickness beneath the apex of the distal phalanx (the digital cushion is absent at this location),
[image:5.612.80.294.77.571.2]• Site 2: Digital cushion and corium thickness be-neath the highest point of the arch of the distal phalanx, and
Figure 1. Top: ultrasonogram of back fat. The transducer was
• Site 3: Digital cushion and corium thickness be-neath the vertex of the flexor tuberosity of the distal phalanx.
Statistical Analysis
Data were initially inspected for trends using charts constructed in Microsoft Excel (2010, Microsoft Corpo-ration, Redmond, WA) and descriptive statistics were calculated in Minitab 17 (Minitab Inc., State College, PA) to evaluate patterns in the data, which included Pearson correlation coefficients and chi-squared tests.
Mixed-effects linear regression models were con-structed to explore relationships between sole soft tissue thickness and explanatory variables, as follows: 2 separate models were constructed with the outcome either “sole soft tissue thickness at site 2” or “sole soft tissue thickness at site 3” because at these 2 sites the digital cushion was incorporated in the measurement. Models were constructed in MLwiN 2.26 (Rasbash et al., 2012) using iterative generalized least squares algo-rithms with a forward stepwise procedure and took the following format:
Yijkl = α + β1Xl + β2Xkl + β3Xjkl + β4Xijkl + fl + vkl + ujkl + eijkl,
fl ~N
(
0,σf2)
,vkl ~N
(
0,σv2)
,ujkl ~N
(
0,σu2)
,eijkl ~N
(
0,σe2)
,where Yijkl was the outcome of the 4 level linear re-gression model; subscripts i, j, k, and l denote the ith repeated measure within the jth assessment of the kth claw of the lth cow, respectively; α was the intercept; β1, β2, β3, and β4 represent vectors of coefficients for the fixed effects; Xl, Xlk, Xjkl, and Xijkl represent fixed effect variables at cow, claw, claw-AP, and repeated measure levels, respectively; and fl, vkl, ujkl, and eijkl de-note the residual error terms at each level (assumed to be normally distributed with mean 0 and variance σ2). The cow, claw, and claw-AP level random effects al-lowed for any explanatory variable to explain variance only at the level at which it varied, therefore accounting for correlations within the data. Cow level explanatory variables tested included lactation number, farm, with-ers height, and lesion incidence throughout the study
period. Claw level variables identified lateral or medial claw and claw-level lesion incidence throughout the study period. Variables were tested denoting whether cows or claws had displayed a lesion at the start of the study (at AP−8) or at previous AP during the study, but no data on lesion incidence before the start of the study were available. Claw-AP level variables were time (day of total study period, with November 13, 2013 = 1), AP number, DIM (where day of calving = 0 and 8 wk before calving = −56), BFT, BCS, BW, lesion pres-ence, and corium thickness at site 1. No explanatory variables varied at the repeated measure level (within AP), but this level was retained to assess the bottom level variance. Polynomials of all linear variables and biologically plausible interactions were tested. Dummy variables were used to partition subsets of data that poorly fitted the model where necessary.
All variables were offered to the model and the Wald test was applied to determine whether fixed effects remained in a model [i.e., a variable was significant when the coefficient was ≥1.96 × SE (P ≤ 0.05)]. Mod-els were checked by inspecting residuals at each level. Data points with high influence were removed from the model and the model was refitted to evaluate changes in model coefficients. The likelihood ratio test was used to compare subsets of models, assessing whether the additional complexity of using additional terms and higher model levels improved model fit (Dohoo et al., 2009).
RESULTS
Overview of the Data Set
A total of 827 animal assessments were performed, with data from 179, 176, 163, 157, and 152 cows at each of the 5 AP, respectively. The median number of days from AP−8 to calving was 56 (interquartile range: 35 to 64) and from calving to AP+1, AP+9, AP+17, and AP+29 was 7 (interquartile range: 5 to 10), 62 (52 to 74), 118 (107 to 130), and 202 (192 to 215). One hundred and five cows were enrolled on farm 1 and 74 on farm 2. By lactation number (1, 2, 3, and 4), 70, 44, 39, and 26 cows were enrolled and 66, 38, 27, and 21 completed the study.
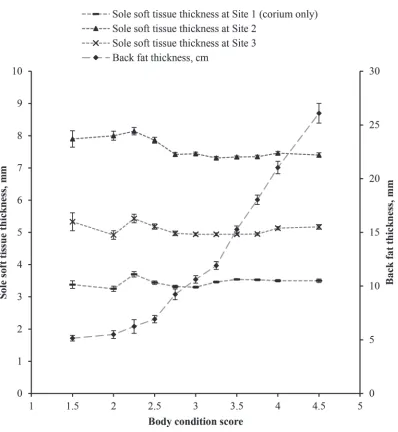
Table 2 displays the means and standard deviations of sole soft tissue thickness and BFT, at each AP. The nadir of sole soft tissue thickness both for sites 2 and 3 occurred at AP+1, and at AP+9 for sole soft tis-sue thickness at site 1 (i.e., thickness of the corium at the toe), and the nadir of BFT occurred at AP+9 and AP+17. Pearson correlation coefficients between corium thickness at site 1 and each of sole soft tissue thickness at sites 2 and 3 were 0.29 and 0.15, respec-tively, and between sole soft tissue thickness at sites 2 and 3 was 0.66. Median BCS was 3.5 (range: 1.5 to 4.5). Back fat thickness and sole soft tissue thickness at sites 1, 2, and 3 are plotted against BCS in Figure 2; BFT and BCS were positively correlated. A 1-unit change in BCS corresponded with a 10-mm change in BFT between BCS of 2.5 and 4.5, whereas the magnitude of the effect was smaller below BCS 2.5. Average BW of all cows across all AP was 647 kg (SD: 72.2).
Mixed-Effects Linear Regression Model of Sole Soft Tissue Thickness
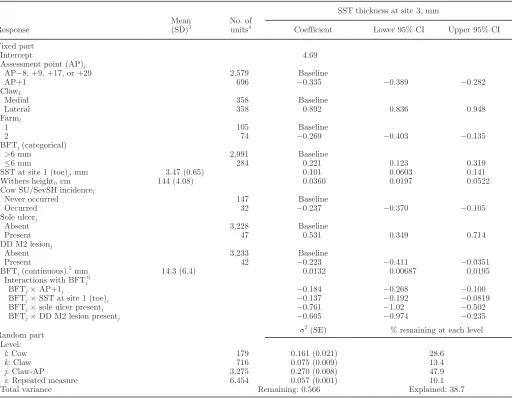
The data set consisted of 6,454 measures of sole soft tissue thickness from 3,275 assessments of 716 hind claws of 179 cows. Presented is the final model that had the outcome sole soft tissue thickness at site 3 (Table 3). An alternative model that had the outcome sole soft tissue thickness at site 2 was very similar, and where models differed is described later. The presented model (with the outcome sole soft tissue thickness at site 3, Table 3) had 4 levels and was selected because model fit was good, because this is the region of the sole ulcer (beneath the flexor tuberosity), and because large variations in sole soft tissue thickness were found with lesion presence. It was therefore considered to present the most information regarding the biology of sole soft
tissue thickness, BFT, and changes that were evident with CHDL.
The presented model estimated that sole soft tissue thickness on the lateral claw was 0.89 mm greater (CI: 0.84–0.95) than on the medial claw. Cows on farm 1 had a sole soft tissue thickness 0.27 mm greater (CI: 0.14 to 0.40) than those on farm 2. Sole soft tissue thickness at AP+1 was 0.33 mm thinner (CI: 0.28 to 0.39) than at other AP; this difference was not explained by other variables tested. Withers height and polynomial terms of time (which had a small effect size) were significant and retained in the model.
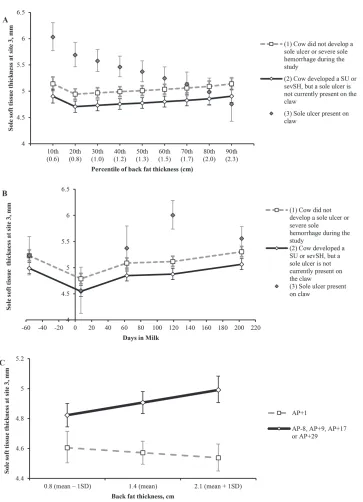
Sole soft tissue thickness was positively correlated with BFT and several interactions between BFT and other variables were significant. A 10-mm difference in BFT corresponded with a 0.13-mm difference in sole soft tissue thickness, for measures of sole soft tissue thickness at AP−8, +9, +17, and +29, based on the mean corium thickness at site 1 and when no sole ulcer or M2 digital dermatitis lesion was present. Cows that experienced a sole ulcer or a severe sole hemorrhage on any claw at any AP had sole soft tissue thickness 0.24 mm thinner (CI: 0.11 to 0.37) than other cows, except when a sole ulcer was present on a claw at an AP, when the sole soft tissues were thickened by 0.53 mm (CI: 0.35 to 0.71). Additionally, an interaction showed that the sole soft tissues were particularly thickened when a sole ulcer was present and the cow was thin. To il-lustrate this, sole soft tissue thickness is plotted against BFT as predictions from the model based on cow-level lesion incidence and claw-AP sole ulcer incidence in Figure 3A. Further, when BFT was ≤6 mm (i.e., very thin, corresponding with virtually no subcutaneous fat at this site), sole soft tissue thickness was 0.22 mm thicker (CI: 0.13 to 0.32) than when BFT was >6 mm. (This cutoff of 6 mm was selected following
visualiza-Table 2. Ultrasonographic measurement data collected at 5 assessment points during a prospective cohort study of sole soft tissue thickness
(measured at 3 sites) in dairy cows
AP1
Back fat thickness, mm (SD, no.2)
BCS Sole soft tissue thickness, mm (SD, no.3)
Median
Upper to lower
quartile corium onlySite 1:
Site 2: digital cushion
and corium4
Site 3: digital cushion
and corium5
–8 18.9 (5.7, 170) 3.5 3.5 to 4 3.71 (0.67, 674) 7.43 (1.04, 671) 5.22 (0.91, 670) +1 16.6 (5.9, 175) 3.5 3 to 3.75 3.57 (0.69, 696) 7.24 (0.98, 695) 4.68 (0.87, 696) +9 11.1 (5.0, 167) 3.25 2.75 to 3.5 3.21 (0.60, 661) 7.36 (1.08, 661) 4.89 (0.90, 660) +17 10.9 (5.3, 163) 3.25 3 to 3.5 3.35 (0.57, 641) 7.47 (1.03, 639) 5.02 (0.96, 639) +29 13.3 (5.8, 152) 3.25 3 to 3.75 3.49 (0.60, 603) 7.68 (1.02, 599) 5.20 (0.97, 597) All data 14.3 (6.4, 827) 3.5 3 to 3.75 3.47 (0.67, 3,275) 7.43 (1.06, 3,265) 4.99 (0.95, 3,262)
1Assessment point, weeks relative to calving.
2Number of cows measured; 2 repeat measures taken on each side of the cow (left and right) at each assessment point. 3Number of claws measured; 2 repeat measures taken at each site at each assessment point.
4Beneath the apex of the distal phalanx.
[image:7.612.62.577.554.670.2]tion of the raw data, using cutoffs of 6.5 or 7 mm had similar results, but with a smaller effect size. A cutoff of 5.5 mm had too few cases and was not significant.) This effect is visible at the 10th percentile of BFT in Figure 3A, where sole soft tissue was thicker than predicted by the rest of the regression line, in cows not displaying a lesion. Sole soft tissues were particularly thickened when a sole ulcer was present later in lactation (when the majority of sole ulcers occurred, 7, 4, 5, 14, and 17 sole ulcers were present at each AP, respectively), as demonstrated by a plot of an alternative model in Figure 3B.
[image:8.612.97.495.68.500.2]An interaction was also present between M2 digital dermatitis lesion presence and BFT (Table 2), and was similar to that between BFT and sole ulcer presence (not plotted). Other interactions demonstrated that BFT and sole soft tissue thickness were not correlated at AP+1 (when sole soft tissues were thinnest; plotted in Figure 3C) and that the magnitude of the correlation decreased as sole soft tissue thickness at site 1 became thicker. In the presented model, 61% of the null model variance remained unexplained. Of this unexplained variance, 48% was at the claw-AP level. The model fit was good.
Figure 2. Sole soft tissue thickness measured at 3 sites and back fat thickness plotted against BCS, for all data collected during a
In the presented model (Table 3), whereas BFT was positively correlated with sole soft tissue thickness at site 3, BCS (observed visually) was not correlated with sole soft tissue thickness at site 3. This is despite a strong positive correlation between BFT and BCS (Figure 2). In an alternative model of sole soft tissue thickness at site 3 (not shown), a polynomial term of
[image:9.612.64.577.215.613.2]DIM was significant, but the DIM term correlated with BFT and therefore was excluded from the presented model. In the final model of sole soft tissue thickness at site 2 (not shown), an interaction of BFT ≤6 mm × sole ulcer on a claw at an AP was not significant, and a significant effect of lactation was present that explained a large degree of the cow-level variance (multiparous
Table 3. A linear regression model of sole soft tissue thickness (SST) beneath the flexor tuberosity of the distal phalanx, measured during a
prospective cohort study of 179 dairy cows1,2
Response Mean (SD)3 No. of units4
SST thickness at site 3, mm
Coefficient Lower 95% CI Upper 95% CI
Fixed part
Intercept 4.69
Assessment point (AP)j
AP−8, +9, +17, or +29 2,579 Baseline
AP+1 696 −0.335 −0.389 −0.282
Clawk
Medial 358 Baseline
Lateral 358 0.892 0.836 0.948
Farml
1 105 Baseline
2 74 −0.269 −0.403 −0.135
BFTj (categorical)
>6 mm 2,991 Baseline
≤6 mm 284 0.221 0.123 0.319
SST at site 1 (toe)j, mm 3.47 (0.65) 0.101 0.0603 0.141
Withers heightl, cm 144 (4.08) 0.0360 0.0197 0.0522
Cow SU/SevSH incidencel
Never occurred 147 Baseline
Occurred 32 −0.237 −0.370 −0.105
Sole ulcerj
Absent 3,228 Baseline
Present 47 0.531 0.349 0.714
DD M2 lesionj
Absent 3,233 Baseline
Present 42 −0.223 −0.411 −0.0351
BFTj (continuous),5 mm 14.3 (6.4) 0.0132 0.00687 0.0195
Interactions with BFTj6
BFTj × AP+1j −0.184 −0.268 −0.100
BFTj × SST at site 1 (toe)j −0.137 −0.192 −0.0819
BFTj × sole ulcer presentj −0.761 −1.02 −0.502
BFTj × DD M2 lesion presentj −0.605 −0.974 −0.235
Random part σ2 (SE) % remaining at each level
Level:
l: Cow 179 0.161 (0.021) 28.6
k: Claw 716 0.075 (0.009) 13.4
j: Claw-AP 3,275 0.270 (0.008) 47.9
i: Repeated measure 6,454 0.057 (0.001) 10.1
Total variance Remaining: 0.566 Explained: 38.7
1Cows were assessed at 5 AP between 8 wk before and 29 wk after calving. Explanatory variables included continuous and categorical terms of
ultrasonographic measures of back fat thickness (BFT), cow-level occurrence of either a sole ulcer or a severe sole hemorrhage during the study period (cow SU/SevSH incidence), claw-AP level sole ulcer occurrence (sole ulcer), presence of an M2 digital dermatitis (DD) lesion, SST at site 1 (the toe), other variables shown named, and interactions between variables are shown. Subscripts i, j, k, and l denote the lowest level of the model at which a term varied. Linear terms are centered around the grand mean.
2Time (duration throughout study) was included to the fourth polynomial and had a small effect size, coefficients omitted. Terms are significant
when the 95% CI does not include 0 (Wald test, α = 0.05).
3Mean and standard deviation for continuous variables. 4Number of units in each category, for categorical variables.
5Coefficients for continuous back fat thickness measurements relate to a 10-mm difference.
animals had a thicker digital cushion at site 2, com-pared with primiparous animals, data not displayed). This alternative model explained 41% of the null vari-ance of sole soft tissue thickness at site 2, with lactation number explaining much of the cow-level variance. In the presented model (Table 3), no effect of lactation number or primiparous versus multiparous was sig-nificant (beyond a sigsig-nificant effect of withers height, which fitted the model well), but otherwise model pa-rameters were similar between the final models for sole soft tissue thickness at site 2 and at site 3.
DISCUSSION
This longitudinal study measured the thickness of the sole soft tissue beneath the distal phalanx (a combined measure of digital cushion and corium thickness) at 5 time points during the production cycle. Sole soft tissue thickness changed with ultrasonographic measures of BFT throughout lactation, yet the effect size of BFT on sole soft tissue thickness was small in comparison with previous work (Bicalho et al., 2009). Other variables that had an effect on sole soft tissue thickness included lesion occurrence, for example the sole soft tissues was thicker when a sole ulcer was present on a claw, but thinner at other AP, and cows that developed either a sole hemorrhage or sole ulcer at any point during the study had thinner sole soft tissues at all AP. The sole soft tissues were thinner when an M2 digital dermatitis lesion was present. Thickness of the corium (measured at the apex of the distal phalanx, site 1) had a positive effect on sole soft tissue thickness, likely because the outcome variable includes both the digital cushion and the corium. The sole soft tissues were thicker in taller cows, in cows on farm 1 and on the lateral claw. Addi-tionally, the sole soft tissue were thinnest immediately after calving (at AP+1, 4–10 d postcalving), which was considerably before the nadir of BFT. Addressing the null hypotheses, sole soft tissue thickness changed with BFT, with a small effect size, and many other factors also contributed to thickness of the sole soft tissues.
Sole soft tissue thickness correlated positively with BFT over time, although the observed effect sizes were not of the magnitude reported in previous studies. In work where individual cows were assessed once, Bicalho et al. (2009) reported that a 1-unit difference in BCS corresponded with a 1-mm difference in sole soft tissue thickness. In the current work, a 1-unit difference in BCS (approximately a 10-mm difference in BFT) cor-responded with approximately a 0.13-mm difference in sole soft tissue thickness. The absolute thickness also differed: in the current work, the mean sole soft tissue thickness was approximately 50% thinner than that
reported by Bicalho et al. (2009), but was very similar to measurements reported in other work (Kofler et al., 1999; Toholj et al., 2014; Cecen et al., 2015). This could suggest that the scanning site used in the current study was different to that used by Bicalho et al. (2009), who describe a scanning site more axially, whereas in this and in other works (Kofler et al., 1999; Toholj et al., 2014; Cecen et al., 2015), the scanning site was in the midline. Scanning more axially could have targeted a larger depot of fat, explaining differences in correlations with measures of body fat between the studies. While scanning in the midline in the current work found a smaller correlation between BFT and sole soft tissue thickness, this work highlights additional factors that could be important in CHDL development.
A principal finding of the study was that the nadir of sole soft tissue thickness occurred 1 wk postcalving. This could be an effect of peri-parturient hormones, such as relaxin (Tarlton et al., 2002) or estrogens. Relaxin, for example, mediates distension of the reproductive tract for parturition by activating metalloproteinases that degrade collagen and is known to have effects on other structures throughout the body (Samuel et al., 1998); if it acts upon the suspensory apparatus it could cause the distal phalanx to sit lower in the hoof around calv-ing. In previous work assessing the thickness of the sole soft tissues in a cross-sectional study, the nadir of sole soft tissue thickness was observed at approximately 120 DIM and corresponded with the nadir of BCS (Bicalho et al., 2009). This discrepancy between the 2 works could have arisen because Bicalho et al. (2009) mea-sured the sole soft tissues within 30 DIM, by which time the suspensory apparatus may have regained integrity if laxity was only temporary. Alternatively, farm manage-ment systems were very different between the current study and Bicalho et al. (2009); walking distances were not recorded but cow activity could explain some of the differences seen. Furthermore, in the current study BFT was not positively correlated with sole soft tissue thickness immediately after calving (at AP+1, Figure 3C), suggesting that thickness of the sole soft tissues is not related to measures of body fat at this time. These findings highlight that our measurement of sole soft tissue thickness reflected the position of the distal phalanx within the hoof, which was a function of both BFT and integrity of the suspensory apparatus. This could highlight the importance of the suspensory ap-paratus on the position of the distal phalanx within the hoof capsule and its importance in lesion pathogenesis.
to 10 d after calving, the soles of feet in cows without lesions were hotter if the sole soft tissues were thinner. The authors hypothesized that reduced sole soft tissue thickness was associated with trauma in the region and early signs of inflammation, before CHDL became vis-ible (Oikonomou et al., 2014b); this thinness could have been predisposed by laxity of the suspensory apparatus. Such results could suggest that vascular or inflamma-tory changes occur within the soft tissues of the sole of the foot in lesion development. Additionally, previous work has demonstrated increased new bone growth on the flexor tuberosity of the distal phalanx in cows that have suffered more lameness and CHDL throughout life, and one possible mechanism for this new bone growth is inflammation in the surrounding soft tissues with CHDL (Newsome et al., 2016). Previous work has also shown that combining the administration of nonsteroidal anti-inflammatory drugs with applying a block to the nonaffected claw improved recovery rates for lameness in acute cases of disease (Thomas et al., 2015). The fact that the sole soft tissues appear to have been inflamed when a sole ulcer was present, and the potential detrimental effects this has on the surround-ing anatomical structures such as the flexor tuberosity, highlights the importance first of prevention, and sec-ond of early detection and effective treatment of lame cows, which current evidence suggests should include the administration of nonsteroidal anti-inflammatory drugs and the application of a block to the nonlame claw.
Cows that developed a sole ulcer or a severe sole hemorrhage during the study had thinner sole soft tis-sues on all claws than other cows (except when a claw had a sole ulcer, when the sole soft tissues of that claw were thickened). This cow-level effect was not explained by the stature or milk production variables tested and could be an effect of genotype or phenotype: cows with thin digital cushions were more likely to develop lesions, possibly as a result of decreased force-dissipating ca-pacity. Additionally, it could reflect rearing differences, as the digital cushions of calves have been found to develop larger with more mechanical challenge before 6 mo of age (Gard et al., 2015). Third, it could reflect prior unrecorded CHDL, with the digital cushion thin-ning after insult (Lischer et al., 2002). Although the current study cannot confirm what caused the thinness of the sole soft tissues before lesion development, it highlights that maximizing the thickness of the digital cushion could have a beneficial effect on foot health. Two possible mechanisms for this could be to (1) select for thickness of the digital cushion in breeding programs (Oikonomou et al., 2014a), or (2) manipulate rearing systems to optimize the structure and function of the digital cushion before first calving. Altering rearing
systems could prove to be highly beneficial in reducing life time CHDL risk and is an interesting area for future research.
An interesting finding of this work is that the sole soft tissues were thinner when an M2 digital dermatitis lesion was present. It is unclear how the presence of such an infection might cause thinning of the dermis and subcutis, yet the association could be due to either unidentified causal or noncausal reasons. The presence of digital dermatitis could indicate a socially subordi-nate cohort of animals that spent longer standing, and as a result had thinner digital cushions. Alternatively, a cow’s predisposition to digital dermatitis might be a function of a physiologic state that also causes laxity in the suspensory apparatus and a thinner digital cushion. Such inter-relationships between all causes of lameness, standing time, physiologic state, and hoof anatomy clearly warrant further study.
This study was based on 2 high-yielding herds that were housed year-round and may not be representative of the dairy cow population at a whole. However, the study cows did lose significant amounts of condition during early lactation as would be expected in high-yielding cows; therefore, it was likely a suitable popula-tion in which to look for changes in thickness of the sole soft tissues with body fat change. It was difficult to fully assess associations between measures of body fat and digital cushion thickness because other variables, such as integrity of the suspensory apparatus, appeared to influence sole soft tissue thickness. Further, although ultrasonography can precisely measure the thickness of the sole soft tissues beneath the distal phalanx (Kofler et al., 1999; Bicalho et al., 2009; Cecen et al., 2015), and high specification machines as used in this study can do so with high precision, it might not to be a good indicator of adipose content within the digital cushion. Recent work has found that nonpregnant dairy cows fed a higher energy diet before slaughter had greater up-regulation of lipogenic genes within the digital cushion (Iqbal et al., 2016), but how negative energy balance or broader physiologic state interact with lipolytic path-ways and mobilization of fat from the digital cushion is still unclear.
CONCLUSIONS
This longitudinal study found that sole soft tis-sue thickness was positively correlated with repeated measures of body fat over time. However, the effect of BFT on sole soft tissue thickness was much smaller than reported in previous work and this correlation had multiple exceptions. The sole soft tissues were thinnest immediately after calving and did not correlate with BFT at this AP; this could have been an effect of hor-monal influences surrounding calving. Cows that de-veloped either a sole ulcer or a severe sole hemorrhage had thinner digital cushions, yet when a sole ulcer was present the soft tissues on that claw were thickened, which could have been a result of increased vasculariza-tion, edema, or inflammation in the underlying tissues. Measures of body fat appeared to be one component that could contribute to having a thin digital cushion, but other factors played a part, including an effect of calving and other cow-level effects. Further work should explore the extent to which thinning of the sole soft tissues, and absolute thinness, influences CHDL, and should also identify the proportion of CHDL that are a result of body condition loss, with a view to work-ing out whether managwork-ing body condition loss might reduce lameness.
ACKNOWLEDGMENTS
This work constituted part of a doctoral thesis by the first author, which contains further validation and analysis. A digital version of the thesis will be available from http://eprints.nottingham.ac.uk late in 2017. The work was funded by the Agriculture and Horticulture Development Board Dairy Division (Kenilworth, UK), a levy board, not-for-profit organization working on be-half of British dairy farmers. The authors thank Katie Holmes (School of Veterinary Medicine and Science, University of Nottingham, UK) for technical support throughout the project and the farm staff for accom-modating the study.
REFERENCES
Archer, S. C., R. Newsome, H. Dibble, C. J. Sturrock, M. G. G. Cha-gunda, C. S. Mason, and J. N. Huxley. 2015. Claw length recom-mendations for dairy cow foot trimming. Vet. Rec. https://doi. org/10.1136/vr.103197.
Barker, Z. E., J. R. Amory, J. L. Wright, R. W. Blowey, and L. E. Green. 2007. Management factors associated with impaired loco-motion in dairy cows in England and Wales. J. Dairy Sci. 90:3270– 3277. https://doi.org/10.3168/jds.2006-176.
Bicalho, R. C., V. S. Machado, and L. S. Caixeta. 2009. Lameness in dairy cattle: A debilitating disease or a disease of debilitated cattle? A cross-sectional study of lameness prevalence and thick-ness of the digital cushion. J. Dairy Sci. 92:3175–3184. https://doi. org/10.3168/jds.2008-1827.
Bicalho, R. C., and G. Oikonomou. 2013. Control and prevention of lameness associated with claw lesions in dairy cows. Livest. Sci. 156:96–105. https://doi.org/10.1016/j.livsci.2013.06.007.
Booth, C. J., L. D. Warnick, Y. T. Grohn, D. O. Maizon, C. L. Guard, and D. Janssen. 2004. Effect of lameness on culling in dairy cows. J. Dairy Sci. 87:4115–4122.
Cecen, G., H. Salci, D. S. Intas, N. Celimli, and G. U. Caliskan. 2015. Ultrasonographic and macroscopic comparison of the thick-ness of the capsule, corium, and soft tissues in bovine claws: An in vitro study. J. Vet. Sci. 16:107–112. https://doi.org/10.4142/ jvs.2015.16.1.107.
Cha, E., J. A. Hertl, D. Bar, and Y. T. Grohn. 2010. The cost of different types of lameness in dairy cows calculated by dynamic programming. Prev. Vet. Med. 97:1–8. https://doi.org/10.1016/j. prevetmed.2010.07.011.
Chapinal, N., A. K. Barrientos, M. A. von Keyserlingk, E. Galo, and D. M. Weary. 2013. Herd-level risk factors for lameness in freestall farms in the northeastern United States and California. J. Dairy Sci. 96:318–328. https://doi.org/10.3168/jds.2012-5940.
Cramer, G., K. D. Lissemore, C. L. Guard, K. E. Leslie, and D. F. Kelton. 2009. Herd-level risk factors for seven different foot lesions in Ontario Holstein cattle housed in tie stalls or free stalls. J. Dairy Sci. 92:1404–1411. https://doi.org/10.3168/jds.2008-1134. Dippel, S., M. Dolezal, C. Brenninkmeyer, J. Brinkmann, S. March,
U. Knierim, and C. Winckler. 2009. Risk factors for lameness in freestall-housed dairy cows across two breeds, farming systems, and countries. J. Dairy Sci. 92:5476–5486. https://doi.org/10.3168/ jds.2009-2288.
Dohoo, I. R., W. Martin, and H. Stryhn. 2009. Model-building strate-gies. Pages 365–390 in Veterinary Epidemiologic Research. 2nd ed. M. McPike, ed. VER Inc., Charlottetown, PEI, Canada.
Dopfer, D., A. Koopmans, F. A. Meijer, I. Szakall, Y. H. Schukken, W. Klee, R. B. Bosma, J. L. Cornelisse, A. vanAsten, and A. ter-Huurne. 1997. Histological and bacteriological evaluation of digi-tal dermatitis in cattle, with special reference to Spirochaetes and
Campylobacter faecalis. Vet. Rec. 140:620–623.
Edmonson, A. J., I. J. Lean, L. D. Weaver, T. Farver, and G. Webster. 1989. A body condition scoring chart for Holstein dairy cows. J. Dairy Sci. 72:68–78.
Foditsch, C., G. Oikonomou, V. S. Machado, M. L. Bicalho, E. K. Ganda, S. F. Lima, R. Rossi, B. L. Ribeiro, A. Kussler, and R. C. Bicalho. 2016. Lameness prevalence and risk factors in large dairy farms in upstate New York. Model development for the prediction of claw horn disruption lesions. PLoS One 11:e0146718. https:// doi.org/10.1371/journal.pone.0146718.
Gard, J. A., D. R. Taylor, D. R. Wilhite, S. P. Rodning, M. L. Schnu-elle, R. K. Sanders, R. J. Beyers, M. A. Edmondson, F. J. De-Graves, and E. van Santen. 2015. Effect of exercise and environ-mental terrain on development of the digital cushion and bony structures of the bovine foot. Am. J. Vet. Res. 76:246–252. https:// doi.org/10.2460/ajvr.76.3.246.
Green, L. E., J. N. Huxley, C. Banks, and M. J. Green. 2014. Tem-poral associations between low body condition, lameness and milk yield in a UK dairy herd. Prev. Vet. Med. 113:63–71. https://doi. org/10.1016/j.prevetmed.2013.10.009.
Hirst, W. M., R. D. Murray, W. R. Ward, and N. P. French. 2002. A mixed-effects time-to-event analysis of the relationship between first-lactation lameness and subsequent lameness in dairy cows in the UK. Prev. Vet. Med. 54:191–201.
Iqbal, Z. M., H. Akbar, A. Hosseini, E. Bichi Ruspoli Forteguerri, J. S. Osorio, and J. J. Loor. 2016. Digital cushion fatty acid compo-sition and lipid metabolism gene network expression in Holstein dairy cows fed a high-energy diet. PLoS One 11:e0159536. https:// doi.org/10.1371/journal.pone.0159536.
Kofler, J., P. Kubber, and W. Henninger. 1999. Ultrasonographic im-aging and thickness measurement of the sole horn and the underly-ing soft tissue layer in bovine claws. Vet. J. 157:322–331. Le Fevre, A. M., D. N. Logue, J. E. Offer, I. McKendrick, and G.
Leach, K. A., D. N. Logue, J. M. Randall, and S. A. Kempson. 1998. Claw lesions in dairy cattle: Methods for assessment of sole and white line lesions. Vet. J. 155:91–102.
Lim, P. Y., J. N. Huxley, J. A. Willshire, M. J. Green, A. R. Othman, and J. Kaler. 2015. Unravelling the temporal association between lameness and body condition score in dairy cattle using a multi-state modelling approach. Prev. Vet. Med. 118:370–377. https:// doi.org/10.1016/j.prevetmed.2014.12.015.
Lischer, C. J., P. Ossent, M. Räber, and H. Geyer. 2002. Suspensory structures and supporting tissues of the third phalanx of cows and their relevance to the development of typical sole ulcers (Ruster-holz ulcers). Vet. Rec. 151:694–698.
Machado, V. S., L. S. Caixeta, and R. C. Bicalho. 2011. Use of data collected at cessation of lactation to predict incidence of sole ulcers and white line disease during the subsequent lactation in dairy cows. Am. J. Vet. Res. 72:1338–1343. https://doi.org/10.2460/ ajvr.72.10.1338.
Manske, T., J. Hultgren, and C. Bergsten. 2002. The effect of claw trimming on the hoof health of Swedish dairy cattle. Prev. Vet. Med. 54:113–129.
Newsome, R., M. J. Green, N. J. Bell, M. G. G. Chagunda, C. S. Mason, C. J. Sturrock, H. R. Whay, and J. N. Huxley. 2016. Link-ing bone development on the caudal aspect of the distal phalanx with lameness during life. J. Dairy Sci. 99:4512–4525. https://doi. org/10.3168/jds.2015-10202.
Newsome, R. F., M. J. Green, N. J. Bell, C. S. Mason, H. R. Whay, and J. N. Huxley. 2017. A prospective cohort study of the digital cushion and corium. Part 2: Does thinning of the digital cushion and corium lead to lameness and claw horn disruption lesions? J. Dairy Sci. 100:xxxx–xxxx. https://doi.org/10.3168/jds.2016-12013.
Nuss, K. 2014. The role of biomechanical factors in the development of sole ulcer in dairy cattle. Pages 1–11 in Cattle Lameness Confer-ence, Worcester. The Dairy Group, Taunton, UK.
Oikonomou, G., G. Banos, V. Machado, L. Caixeta, and R. C. Bicalho. 2014a. Short communication: Genetic characterization of digital cushion thickness. J. Dairy Sci. 97:532–536.
Oikonomou, G., P. Trojacanec, E. K. Ganda, M. L. S. Bicalho, and R. C. Bicalho. 2014b. Association of digital cushion thickness with sole temperature measured with the use of infrared thermography. J. Dairy Sci. 97:4208–4215. https://doi.org/10.3168/jds.2013-7534. Räber, M., C. J. Lischer, H. Geyer, and P. Ossent. 2004. The bovine
digital cushion—A descriptive anatomical study. Vet. J. 167:258– 264.
Räber, M., M. R. L. Scheeder, P. Ossent, C. J. Lischer, and H. Geyer. 2006. The content and composition of lipids in the digital cushion of the bovine claw with respect to age and location—A preliminary report. Vet. J. 172:173–177.
Randall, L. V., M. J. Green, M. G. G. Chagunda, C. Mason, S. C. Ar-cher, L. E. Green, and J. N. Huxley. 2015. Low body condition pre-disposes cattle to lameness: An 8-year study of one dairy herd. J. Dairy Sci. 98:3766–3777. https://doi.org/10.3168/jds.2014-8863. Rasbash, J., F. Steele, W. J. Browne, and H. Goldstein. 2012. A User's
Guide to MLwiN, v2.26. Centre for Multilevel Modelling, Univer-sity of Bristol, Bristol, UK.
Reader, J. D., M. J. Green, J. Kaler, S. A. Mason, and L. E. Green. 2011. Effect of mobility score on milk yield and activity in dairy cattle. J. Dairy Sci. 94:5045–5052. https://doi.org/10.3168/ jds.2011-4415.
Samuel, C. S., J. P. Coghlan, and J. F. Bateman. 1998. Effects of relaxin, pregnancy and parturition on collagen metabolism in the rat pubic symphysis. J. Endocrinol. 159:117–125. https://doi. org/10.1677/joe.0.1590117.
Schindelin, J., I. Arganda-Carreras, E. Frise, V. Kaynig, M. Longair, T. Pietzsch, S. Preibisch, C. Rueden, S. Saalfeld, B. Schmid, J.-Y. Tinevez, D. J. White, V. Hartenstein, K. Eliceiri, P. Tomancak, and A. Cardona. 2012. Fiji: an open-source platform for biological-image analysis. Nat. Methods 9:676–682. https://doi.org/10.1038/ nmeth.2019.
Schneider, C. A., W. S. Rasband, and K. W. Eliceiri. 2012. NIH Image to ImageJ: 25 years of image analysis. Nat. Methods 9:671–675. Schröder, U. J., and R. Staufenbiel. 2006. Invited review: Methods to
determine body fat reserves in the dairy cow with special regard to ultrasonographic measurement of backfat thickness. J. Dairy Sci. 89:1–14. https://doi.org/10.3168/jds.S0022-0302(06)72064-1. Sogstad, A. M., O. Osteras, and T. Fjeldaas. 2006. Bovine claw and
limb disorders related to reproductive performance and production diseases. J. Dairy Sci. 89:2519–2528.
Sogstad, A. M., O. Osteras, T. Fjeldaas, and A. O. Refsdal. 2007. Bovine claw and limb disorders at claw trimming related to milk yield. J. Dairy Sci. 90:749–759.
Solano, L., H. W. Barkema, E. A. Pajor, S. Mason, S. J. LeBlanc, J. C. Zaffino Heyerhoff, C. G. R. Nash, D. B. Haley, E. Vasseur, D. Pellerin, J. Rushen, A. M. de Passillé, and K. Orsel. 2015. Preva-lence of lameness and associated risk factors in Canadian Holstein-Friesian cows housed in freestall barns. J. Dairy Sci. 98:6978–6991.
https://doi.org/10.3168/jds.2015-9652.
Tarlton, J. F., D. E. Holah, K. M. Evans, S. Jones, G. R. Pearson, and A. J. F. Webster. 2002. Biomechanical and histopathological changes in the support structures of bovine hooves around the time of first calving. Vet. J. 163:196–204. https://doi.org/10.1053/ tvjl.2001.0651.
Thomas, H. J., G. G. Miguel-Pacheco, N. J. Bollard, S. C. Archer, N. J. Bell, C. Mason, O. J. R. Maxwell, J. G. Remnant, P. Sleeman, H. R. Whay, and J. N. Huxley. 2015. Evaluation of treatments for claw horn lesions in dairy cows in a randomized controlled trial. J. Dairy Sci. 98:4477–4486. https://doi.org/10.3168/jds.2014-8982. Toholj, B., M. Cincović, M. Stevančević, J. Spasojevic, V. Ivetić, and
A. Potkonjak. 2014. Evaluation of ultrasonography for measuring solar soft tissue thickness as a predictor of sole ulcer formation in Holstein-Friesian dairy cows. Vet. J. https://doi.org/10.1016/j. tvjl.2013.11.005.