1
Serial Post-mortem Relaxometry in the Normal Rat Brain and
Following Stroke
Andrew J. Fagan PhD1,4, Jim. M. Mullin HNC2,4, Lindsay Gallagher HNC4, Donald M. Hadley FRCR3, I. Mhairi Macrae PhD4, Barrie Condon PhD2
1: Department of Medical Physics and Bioengineering, St. James’s Hospital, Dublin 8, Ireland. 2: Dept. Clinical Physics and Bioengineering, MRI Unit, Institute of Neurological Sciences, Glasgow
G51 4TF, UK.
3: Dept. Neuroradiology, MRI Unit, Institute of Neurological Sciences, Glasgow G51 4TF, UK. 4: 7T MRI Facility, Division of Clinical Neuroscience, Glasgow University Garscube Estate, Glasgow
G61 1QH, UK.
Corresponding Author: Dr. Andrew Fagan
Department of Medical Physics and Bioengineering, St. James’s Hospital, Dublin 8, Ireland.
Tel: +353-1-4162646 Fax: +353-1-4103478 [email protected]
Grant support:
This study was supported by a Research Development Grant from the Scottish Funding Council.
Running Title:
2
Abstract
Purpose: Investigation of MRI for non-invasive autopsy via measurements of serial changes in relaxation parameters of the rat brain during the post-mortem interval.
Materials and Methods: Post-mortem relaxometry measurements were performed before and hourly
after death for 24 hours on five control rats and five rats which underwent middle cerebral artery occlusion. Analyses were performed on representative regions of grey, white, and mixed grey/white
matter structures.
Results: Significant decreases in both T1 and T2 values were measured in all areas in the control
group within 24 hours of death. In the stroke animals, T2 differences between normal and ischaemic
striatal tissue decreased by 11±4% (p<0.01), with a complete convergence of T2 values observed
between ischaemic striatal tissue and non-ischaemic cortical tissue.
Conclusions: Lesion conspicuity and the ability to differentiate between different tissue compartments
are significantly affected by post-mortem interval, and alterations to pulse timing parameters will be necessary if the sensitivity of MRI to detect CNS diseases in post-mortem tissue is to be maintained.
Indeed in the case of stroke at least, convergence of T2 values with normal tissue post-mortem
indicates that T1 weighted images may be more sensitive to the presence of such lesions.
3
Introduction
The surgical dissection of the post-mortem corpse (autopsy) has long been recognised as a valuable medical procedure for establishing the cause of death, and the information yielded by autopsies has been invaluable to our understanding of pathology. It has also formed the foundation for medical
education and auditing (1,2). Autopsies also allow for the accurate evaluation of treatment methods, can be used to identify new and changing diseases, and have a role to play in forensic investigations
and medico-legal issues. However, there has been a marked decline in autopsy rates over the past
few decades with, for example, less than 10 % of present-day deaths autopsied in UK teaching hospitals, compared to over 30 % in the 1940’s (3). Factors contributing to this decrease include ambivalence toward the procedure by pathologists and clinicians, risks of inoculation from infected
patients, issues related to patient / family consent, and restrictions placed by religious doctrines.
The emergence of rapid, high resolution radiological imaging techniques such as x-ray computed tomography (CT) and MRI offer an alternative method of non-invasively assessing the cause of death
in situations where an autopsy is not possible. However, while the former is perhaps optimal for assessing bony structures, the soft tissue contrast afforded by MRI would make it a more optimal
modality for distinguishing subtle tissue lesions post-mortem. To date, post-mortem studies in humans have predominately involved formalin-fixed tissue, in particular focussing on imaging issues
related to maintaining gray / white matter conspicuity following the fixation process (4). However, some examples involving non-fixed tissue have recently been published. These include an
investigation of tissue decomposition via 1H spectroscopy with a view to determining the post-mortem interval (5); forensic investigations in which MRI was used to differentiate and classify the grade of
damage following gunshot injury (6); subcutaneous fatty tissue trauma (7); and the use of MRI as an alternative to conventional autopsy (8-10). In this regard, a number of papers have been published
comparing the sensitivity and specificity of MRI and conventional autopsy in the detection of specific abnormalities (for example, see (8-13)). Although close correlations were noted, in general the two
approaches have been found to be complementary, with each disclosing abnormalities missed by the other. Study numbers, however, remain small and a recent report commissioned by the UK
Department of Health has strongly recommended that more pilot studies be carried out in this area to determine whether MRI can augment or replace conventional autopsy (14).
4
spin-lattice (T1) and spin-spin (T2) relaxation values of formalin-fixed brain tissue were found todecrease in the weeks after fixing the tissue, with a convergence of T1 values in gray and white matter,
leading to a loss of contrast in T1-weighted MR images. On the other hand, Blamire et al. (16) found
that the difference in the relative density of protons in gray and white matter increased during the first weeks of fixation, which indicates that optimal gray-white matter contrast may be obtained in
formalin-fixed brain tissue using a proton density-weighted protocol. However, it is not clear how relevant these results are to fixed tissue, which is more pertinent for the application of MRI for
non-invasive autopsy. In particular, formalin fixation is known to change the microstructure of tissue and to have a differential effect on the water mobility of different tissue types (4), giving rise to the observed
T1 and T2 changes. Changes in water mobility, together with the breakdown of the tissue
infrastructure supporting the fibre and vasculature networks, may contribute differently to relaxation
changes in non-fixed tissue.
Data on non-fixed tissue are more scarce. In an early study by Gyorffywagner et al., the post-mortem changes in excised, non-fixed porcine brain tissue were investigated, with significant changes in T2 but
not T1 measured up to 90 hours post-mortem (18). However, the excised tissue was maintained at 8 ºC throughout the post-mortem interval, while the excision process was also expected to confound the
measured values. The goal of the current study was to measure post-mortem relaxation value changes in situ, utilising a more realistic temperature regime, i.e. allowing the animals’ temperature to
equilibrate to room temperature, which better reflects the typical conditions to which a body will be exposed in the hours after death.
Tissue decomposition occurring during the post-mortem interval, and its consequent effect on tissue relaxation parameters, has a dramatic effect on the image quality in MRI, to the extent that imaging
protocols may need to be altered significantly to compensate for the tissue changes, in order to ensure that potential causes of death are not overlooked or falsely reported. Quantification of such tissue
changes, which will facilitate modifications of in vivo MRI timing parameters to produce optimal ex vivo images, must therefore be performed both pre- and post-mortem, necessitating the use of animal
models. Although tissue changes occurring in different organs throughout the body will ultimately need to be measured, the present study focused on changes in the brain of both control rats and rats
exposed to an experimental stroke prior to death. The results of this study could be used to inform choice of timing parameters in the MRI protocols required to provide a non-invasive autopsy
5
Materials and Methods
Animals: All experiments were carried out under license from the Home Office and were subject to the Animals (Scientific Procedures) Act, 1986. Ten adult male Sprague-Dawley rats (bodyweights
approximately 260 g, Harlan, UK) were anaesthetised, intubated, artificially ventilated and anaesthesia maintained with 1-2 % halothane in 7:3 N2O/O2. The rats were divided into two groups of n = 5,
consisting of a ‘control’ group and a second group subjected to an experimental stroke using the
Tamura model of electrocoagulation of the proximal middle cerebral artery (MCA) (19). All of the rats were subsequently instrumented for physiological monitoring and transferred to the magnet bore for in vivo imaging, before being sacrificed by a halothane overdose of 5 %, four hours after the MCA
occlusion. The rats’ body temperature was subsequently allowed to equilibrate to the temperature within the gradient bore (25ºC).
Imaging: MR imaging experiments were carried out using a 7 T Bruker BioSpec 70/30 system (Bruker, Germany) using an actively shielded gradient set (400 mT/m maximum gradient) with a
72 mm diameter birdcage volume resonator. T2 weighted imaging was carried out in vivo (and at 48
hours after death in one animal) using a RARE sequence (TR/TE = 5000/72 ms, RARE factor 16, 117
μm in-plane resolution, 0.5 mm slice thickness with 30 slices spanning the entire brain). Relaxation
measurements were carried out before and beginning 10 minutes after death out to 24 hours (and in one animal out to 48 hrs) post-mortem. Each animal remained in the magnet for the duration of the
experiment, with measurements of both T1 and T2 carried out every hour. T1 measurements were
performed in an inversion recovery experiment using a segmented FISP readout sequence, in which a
series of 20 equi-spaced segmented images were acquired between 60 - 7200 ms after each
inversion of the magnetisation, with 8 lines of k-space for each image acquired per inversion cycle
(in-plane resolution = 312
μ
m, single coronal slice of thickness 2 mm centred at 1 mm posterior toBregma according to the Paxinos rat brain atlas (20), acquisition bandwidth = 150 kHz, TR/TE = 3/1.5 ms). The time between successive inversion pulses was set to 8000 ms, to ensure complete
recovery of the magnetization to its initial equilibrium value, resulting in an acquisition time of 22 minutes. To reduce errors in the measured T1 values deriving from the use of an imperfect
inversion pulse, adiabatic hyperbolic secant RF inversion pulses were used with a 6 ms duration and a 2.9 kHz bandwidth. A gauss pulse with 5° flip angle, duration 0.8 ms and bandwidth 3.4 kHz was used
for the excitation. T2 measurements were carried out using a multi-slice multiple spin echo technique
6
acquisition time of 15 minutes (TR/TE = 5000/12 ms, acquisition bandwidth = 70 kHz). 20equi-spaced echo-time images were acquired ranging from 12 to 240 ms, covering the T2 relaxation period.
Both T1 and T2 measurement techniques were validated using agar gel phantoms with known
relaxation properties (Eurospin Test Objects, Diagnostic Sonar Ltd., UK). Image registration of individual rat brains acquired throughout the post-mortem period was facilitated by adjusting the 1H
frequency of the MRI system every hour, while a standard stereotactic frame (consisting of bite and ear bars) built into the support cradle ensured the heads were fixed securely.
Analysis: T1 and T2 parameter fitting was carried out using the Bruker ParaVision software using
regions of interest placed over the cortex, corpus callosum, and striatum for measurements of gray,
white and mixed white/gray matter regions, respectively (Figure 1). The ParaVision software uses a region of interest based nonlinear least-squares fitting routine to perform a three-parameter fit to the
data using the standard equations I(t) = α + I0 [1 - 2exp(-t/T1)] and I(t) = α + I0 exp(-t/T2) for T1 and T2,
respectively, where I0 is the signal intensity from the equilibrium magnetization andαis a bias factor.
Error bars in the figures below represent the standard deviation of the mean fitted values from 5 rats.
The statistical significance of changes in relaxation values during the post-mortem interval was determined by comparing the mean value just before death with the equivalent value at 24 hours
post-mortem using a paired Student’s t-test analysis.
Results
T2 weighted images of the brain of a representative control rat acquired before and 48 hours after
death are presented in Figures 2a and 2b, respectively. Some degree of brain swelling within the
confines of the skull is evident (of the order of 2 %), together with a loss of signal from the ventricles and also a loss of some gray / white matter differentiation with this duration of post-mortem delay.
Histological sections of these brains, post fixed at 48 hours, revealed that ventricles had not collapsed, neuroanatomical landmarks could still be identified and gray and white matter could still be
differentiated in haematoxylin and eosin stained sections (data not shown).
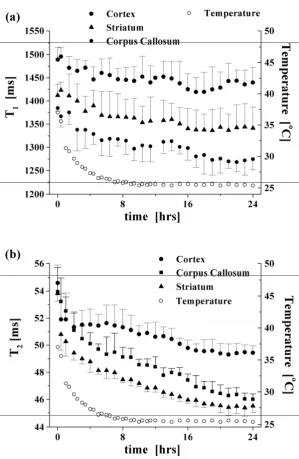
Influence of post-mortem delay on T1 and T 2 values in control brain
The behaviour of the spin-lattice and spin-spin relaxation processes as a function of time post-mortem
7
mix) in the control group are presented in Figure 3. The data represent mean values from fiveanimals at each time point in this control group. The measured T1 values, displayed in Figure 3a,
exhibit statistically significant decreases from time zero (in vivo state just before death) to 24 hours post-mortem (p < 0.01). The percentage change over this timeframe was 8, 4 and 6 % (± 2 %) for the
corpus callosum, cortex and striatum, respectively. Similarly, the measured T2 values in these regions
decreased significantly over 24 hours post-mortem (p < 0.001), with percentage changes of 15, 10, and 16 % (± 2 %), respectively (Figure 3b). Of perhaps more significance, from the point of view of
image contrast in MRI, is the differential changes in relaxation values evident between different tissue
types which occurred during the post-mortem interval (for example, a comparison of the zero and 24 hour data in Figure 3 shows that the separation of T1 and T2 values between gray and white matter
increased by 5 ± 3 % and 10 ± 2.5 %, respectively, during this period).
Comparison of temperature loss post-mortem with T2 change in gray and white matter
The decrease in core body temperature of the rats during the post-mortem interval, as measured using a rectal thermometer, is also plotted in Figure 3 beside the measured T1 and T2 values. It can
be seen from these graphs that the observed decreases in relaxation values reflect the decreasing temperature during the first 10 hours post-mortem. However, with the exception of the T1 values
measured in the cortex, the relaxation values continued to exhibit a statistically significant decrease (p < 0.05 for T1, and p < 0.01 for T2 data) after the rats’ core temperature had stabilised at
approximately 10 hours post-mortem.
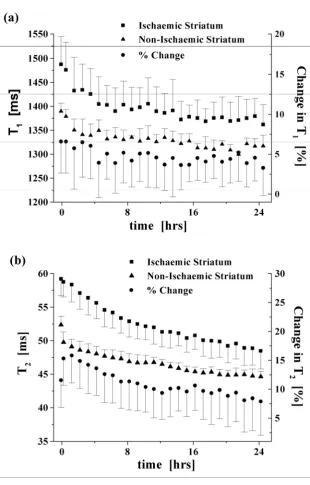
Influence of post-mortem delay on T1 and T2 values in ischaemic versus non-ischaemic brain
Proximal middle cerebral artery occlusion created a consistent pattern of ischaemic damage in the
ipsilateral striatum with more variable damage in the cortex, as indicated in diffusion-weighted images acquired 3 hours post-ischaemia in the living rat (data not shown). Regions of interest in the ipsilateral
and contralateral striatum were compared to identify differences in T1 and T2 values between
ischaemic and non-ischaemic tissue, and how this was influenced by post-mortem delay (Figure 4).
Higher T1 values were recorded in ischaemic striatum compared to non-ischaemic striatum in vivo and
post-mortem, with maximal differences recorded immediately prior to anaesthetic overdose. It can be
seen in Figure 4a that the T1 values of the ischaemic striatum exhibited a similar decrease over time
as compared to the non-ischaemic tissue (decreases of the order of 8 ± 3 % and 5 ± 1.5 %,
8
differential change (< ~ 3 %) measured over this time period. The maximum difference in T2 valuesbetween ischaemic and non-ischaemic striatum was evident 1 hour after death due to the initial rapid drop in T2 in non-ischaemic tissue (also evident in the control group, Figure 3b) which was not
reflected to the same extent in ischaemic striatum (Figure 4b). T2 values decreased significantly
(p < 0.001) in ischaemic and non-ischaemic tissue by 18 % and 15 % (± 3.5 %), respectively, over the
24 hour post-mortem period, with a differential change between these tissues of the order of 11 ± 4 %
over this period.
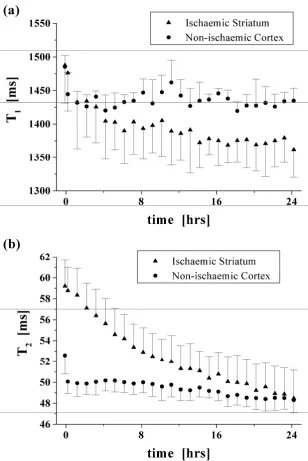
To illustrate how a significant post-mortem change in relaxation values will have a clear effect on image contrast, we present in Figure 5 data to illustrate the relaxation changes that might be expected
in ischaemic striatal tissue adjacent to non-ischaemic cortical tissue. To ensure that the data used were characteristic of normal cortex, rather than ischaemic cortex, the region of interest used for
measurements of the cortical tissue was placed on the contralateral hemisphere (region 2 in Figure 1, with the ischaemic striatal damage typically occurring in region 4); nevertheless, similar values would
be expected from non-ischaemic cortical tissue neighbouring the ischaemic striatal tissue. It is clear from Figure 5(a) that the measured T1 values for both regions are similar in vivo, but become divergent
during the post-mortem interval. T2 values, on the other hand, are clearly different in vivo but
converge with time post-mortem (Figure 5(b)); indeed, at 24 hours post-mortem, T2 contrast is
completely lost between these tissue types.
Discussion
This is the first study to report significant serial changes in the relaxation parameters of in situ brain tissue following death. Rather than finding an increase in T1 and T2 values post-mortem, as might be
expected if the tissue loses its structure and becomes more oedematous, decreases in both
parameters were actually revealed with post-mortem delay. The reason for this is not clear but it may
indicate a change of compartment of water molecules between extra- and intra-cellular compartments. A changing magnetic state of blood from dia- to paramagnetic, as O2 is released from haemoglobin
molecules in the decomposing blood, may also contribute to the observed effects. Previous studies have observed a similar decrease in T1 values associated with the coagulation of blood in excised
9
increased access of water molecules to paramagnetic relaxation centers in the blood followinghaemoglobin denaturing and cell membrane rupturing. It is interesting to note that the striatal T2
values in the control group (Figure 3b) exhibit a more pronounced decrease during the post-mortem
interval compared to the cortex and corpus callosum. Further experiments will be required to elucidate the origins of this finding.
The average body temperature of the rats dropped rapidly in the immediate hours after death,
equilibrating to the temperature within the gradient bore after approximately 10 hours. This loss of body temperature after death is an additional confounding factor which can be expected to influence
T1 relaxation values and, consequently, any clinical application of MRI post-mortem. Indeed,
temperature-induced changes in T1 relaxation values were predicted by the classic
Bloembergen-Purcell-Pound (BPP) theory (22), and have been exploited in a number of studies to map temperature changes in vivo (23,24) and in autopsied samples (25). For a simple homogenous system, the BPP
theory describes the T1 relaxivity as follows:
⎥
⎦
⎤
⎢
⎣
⎡
+
+
+
∝
2 20 2
2 0
1
1
4
8
1
2
1
c c c cT
ϖ
τ
τ
τ
ϖ
τ
where ω0is the NMR frequency and τc
is the correlation time associated with the fluctuating local field
which is inversely related to the temperature. The situation is complicated in tissue, which is a highly heterogeneous environment, leading to a more complicated dependence of T1 on both magnetic field
strength and temperature. Empirical studies carried out at relatively low field strengths used clinically (≤ 1.5 T) indicate an approximate linear temperature dependence across the physiological to room
temperature range, varying from 1% change per ºC (26) to 1.3-1.5 % change per ºC (25), with a strong dependence on the specific tissue type under investigation. However, the lack of similar data in the
rat brain at the higher field strength used in the current study renders it difficult to predict an expected decrease in T1 values associated with the temperature decrease observed during the post-mortem
period. Nevertheless, it is interesting to note that the T1 values for the corpus callosum and striatum
continued to decrease after the animals’ core temperature had stabilised (Figure 3), indicating that
temperature alone does not account for the observed decreases. This is the first time that a non-temperature related decrease in T1 values has been reported; in a previous study on excised porcine
brain tissue, no decrease was observed, although a complicated temperature regime was utilised
(involving the storage of tissue at 8ºC throughout the post-mortem interval and its reinstatement to room temperature for the relaxometry measurements) which, coupled with the excision process, may
post-10
mortem interval, and using a realistic temperature regime (i.e. allowing the body to cool to roomtemperature naturally), the current study aimed to remove such potential confounds. Further, the current study allowed us to compare relaxation changes in different brain structures, compared to the
bulk relaxometry measurements carried out previously.
In the clinical situation temperature effects will be far more variable as corpses are often refrigerated soon after death. Corpses presented for imaging fresh from the mortuary will be rising in temperature,
while those taken to the MR immediately from the ward will be decreasing in temperature. Our results indicate that at some post-mortem intervals T2 contrast may be reduced significantly between, for
example, ischaemic and ischaemic striatum, or indeed ischaemic striatum and adjacent non-ischaemic cortex, if in vivo pulse timing parameters are maintained. It may therefore be necessary to
take body temperature into account and use this to alter timing parameters to enhance diminishing contrast. Ultimately, however, if the convergence of T2 values becomes too close it may be necessary
to resort to T1 weighted imaging. In vivo T2 weighted imaging is used as a sensitive indicator of the
presence of disease as it produces good contrast between lesions and normal tissue. However, even
within 8 hours post-mortem, the significant convergence of T2 values congruent with the maintenance
or increasing differential of T1 values (Figure 5), may mean that T1 weighted imaging becomes more
sensitive for this task.
In conclusion, the results presented in this preliminary study indicate that imaging sequences
conventionally optimised for in vivo imaging cannot be seamlessly translated to imaging in the ex vivo
state, and pathologies which may be readily apparent in vivo may exhibit significantly diminished contrast post-mortem, with the associated risk that they might be overlooked during a virtual autopsy
performed via MRI, particularly where the sequences are weighted towards T2. Although the current
study focussed on the rat brain at 7 T and one particular pathology (i.e. stroke), it can nonetheless be
expected that significant effects will likewise be encountered at the lower field strengths used clinically. Indeed, the prediction of the BPP theory of an increased dependency of T1 on temperature at lower
field strengths would in itself suggest a larger decrease in T1 values compared to that observed in the
current study. Further studies are required to determine the applications and limitations of
post-mortem MRI, to extend these studies in gyrencephalic species and at lower field strength (e.g. 1.5 T), and to delineate post-mortem changes in normal versus diseased tissue throughout the body and
11
comparison of changes in normal and diseased tissue differentiation pre- and post-mortem and forthe investigation of the influence of parameters such as body temperature.
Acknowledgments
The authors would like to thank Professor David Graham for neuropathological assessment of post-fixed brain tissue.
References
1. Hill RB, Anderson RE. The recent history of the autopsy. Arch Pathol Lab Med 1996:120:702-712.
2. AMA Council on Scientific Affairs. Autopsy: a comprehensive review of current issues. Arch Pathol Lab Med 1996:129:721-726.
3. Perkins GD, McAuley DF, Davies S, Gao F. Discrepancies between clinical and postmortem diagnoses in critically ill patients: an observational study. Crit Care Med 2003:7:R129-R132.
4. Pfefferbaum A, Sullivan EV, Adalsteinsson E, Garrick T, Harper C. Postmortem MR imaging of formalin-fixed human brain. Neuroimage 2004:21:1585-1595.
5. Ith M, Bigler P, Scheurer E et al. Observation and identification of metabolites emerging during postmortem decomposition of brain tissue by means of in situ H-1-magnetic resonance
spectroscopy. Magn Reson Med 2002:48:915-920.
6. Thali MJ, Yen K, Schweitzer W et al. Virtopsy, a new imaging horizon in forensic pathology: Virtual autopsy by postmortem multislice computed tomography (MSCT) and magnetic resonance
imaging (MRI) - a feasibility study. J Forensic Sci 2003:48:386-403.
7. Yen K, Vock P, Tiefenthaler B et al. Virtopsy: Forensic traumatology of the subcutaneous fatty tissue; Multislice computed tomography (MSCT) and magnetic resonance imaging (MRI) as diagnostic tools. J Forensic Sci 2004:49:799-806.
8. Bisset RAL, Thomas NB, Turnbull IW, Lee S. Postmortem examinations using magnetic resonance imaging: four year review of a working service. BMJ 2002:324:1423-1424.
9. Patriquin L, Kassarjian A, Barish M et al. Postmortem whole-body magnetic resonance imaging as an adjunct to autopsy: Preliminary clinical experience. J Magn Reson Imaging 2001:13:277-287.
10. Ezawa H, Yoneyama R, Kandatsu S, Yoshikawa K, Tsujii H, Harigaya K. Introduction of autopsy imaging redefines the concept of autopsy: 37 cases of clinical experience. Pathol Int 2003:53:865-873.
11. Hart BL, Dudley MH, Zumwalt RE. Postmortem cranial MRI and autopsy correlation in suspected child abuse. Am J Forensic Med Pathol 1996:17:217-224.
12
13. Roberts ISD, Benbow EW, Bisset R et al. Accuracy of magnetic resonance imaging indetermining cause of sudden death in adults: comparison with conventional autopsy. Histopathology 2003:42:424-430.
14. Parker A. Less Invasive Autopsy, the Place of Magnetic Resonance Imaging, report commissioned by the Policy Research Programme of the Department of Health. 2004:
15. Tovi M, Ericsson A. Measurements of T1 and T2 Over Time in Formalin-Fixed Human Whole-Brain Specimens. Acta Radiol 1992:33:400-404.
16. Blamire AM, Rowe JG, Styles P, McDonald B. Optimising imaging parameters for post mortem MR imaging of the human brain. Acta Radiol 1999:40:593-597.
17. Schumann CM, Buonocore MH, Amaral DG. Magnetic resonance imaging of the post-mortem autistic brain. J Autism Dev Disord 2001:31:561-568.
18. Gyorffywagner Z, Englund E, Larsson EM, Brun A, Cronqvist S, Persson B. Proton Magnetic-Resonance Relaxation-Times T1 and T2 Related to Postmortem Interval - An Investigation on Porcine Brain-Tissue. Acta Radiol-Diag 1986:27:115-118.
19. Tamura A, Graham DI, Mcculloch J, Teasdale GM. Focal Cerebral-Ischemia in the Rat .1. Description of Technique and Early Neuropathological Consequences Following Middle Cerebral-Artery Occlusion. J Cereb Blood Flow Metab 1981:1:53-60.
20. Paxinos G, Watson C. The rat brain in stereotaxic coordinates, 4th edition. New York: Academic Press; 1998.
21. Graham SJ, Stanisz GJ, Kecojevic A, Bronskill MJ, Henkelman RM. Analysis of changes in MR properties of tissues after heat treatment. Magn Reson Med 1999:42:1061-1071.
22. Bloembergen N, Purcell EM, Pound RV. Relaxation effects in nuclear magnetic resonance absorption. Phys Rev 1948:73:679-721.
23. Parker DL, Smith S, Sheldon P, Crooks LE, Fussel L. Temperature distribution measurement in two dimensional NMR imaging. Med Phys 1983:10:321-325.
24. Moser E, Winklmayr E, Holzmüller P, Krssak M. Temperature and pH-dependence of proton relaxation rates in rat liver tissue. Magn Reson Imaging 1995:13:429-440.
25. Koenig SH, Brown RD, Spiller M, Lundbom N. Relaxometry of brain - why white matter appears bright in MRI. Magn Reson Med 1990:14:482-495.
13
Figures
Figure 1: An in vivo T2-weighted image to illustrate the positioning of regions of interest over the
[image:13.595.156.440.274.727.2]cortex (1, 2), corpus callosum (3) and striatum (4, 5).
Figure 2: T2 weighted images of the same brain slice acquired (a) before and (b) 48 hours after death
14
Figure 3: (a) T1 and (b) T2 relaxation time measurements as a function of time post-mortem in the
control group, contrasting changes in gray and white matter as measured using regions of interest
placed over the cortex, striatum (mixed grey and white matter) and corpus callosum. The first data point (at time = 0) represents the in vivo state. The data represents a mean of n = 5 animals, with
[image:14.595.149.449.76.536.2]15
Figure 4: Changes in (a) T1 and (b) T2 between ischaemic striatum and contralateral, non-ischaemic
striatum as a function of time post-mortem in absolute and differential terms (n = 5, with error bars representing either + or – standard deviation, for clarity). The first data point displays in vivo T1 and T2
16
Figure 5: (a) T1 and (b) T2 changes as a function of time post-mortem, illustrating the gain/loss of
contrast, respectively, between two tissue compartments: non-ischaemic cortical tissue and ischaemic striatal tissue (n = 5, with error bars representing either + or – standard deviation, for
[image:16.595.137.446.50.512.2]