Improving Sentence-level Subjectivity Classification through
Readability Measurement
Robert Remus
Dept. of Computer Science, NLP Group University of Leipzig, Germany
Abstract
We show that the quality of sentence-level subjectivity classification, i.e. the task of deciding whether a sentence is subjective or objective, can be improved by incorpo-rating hitherto unused features: readability measures. Hence we investigate in 6 dif-ferent readability formulae and propose an own. Their performance is evaluated in a 10-fold cross validation setting using ma-chine learning. Thereby, it is demonstrated that sentence-level subjectivity classifica-tion benefits from employing readability measures as features in addition to already well-known subjectivity clues.
1 Introduction
Wiebe et al. (2004) refer tosubjectivityin natural language as “aspects of language used to express opinions, evaluations, and speculations”. For ex-ample, an utterance like
“In the end, though, it is only mildly amusing when it could have been so much more.”
clearly bears an opinion, i.e. is subjective, whereas an utterance like
“The movie takes place in mexico, 2002.”
clearly does not1. Readability is usually refered
to as “the degree to which a given class of people find certain reading matter compelling and, neces-sarily, comprehensible” (cf. McLaughlin (1969)). So whereas the meaning of a sentence like
“Nanometer-sized single crystals, or single-domain ultrafine particles, are of-ten referred to as nanocrystals.”
1Both sentences are taken from (Pang and Lee, 2004)’s subjectivity data set v1.0.
is quite difficult to grasp, a sentence like “Wills and Kate get into marriage mode.”
is much easier to understand2. Why is that? The
former sentence not only exhibits a more com-plex syntactic structure than the latter, but also ex-tensively utilises domain-specific terminology that many readers would not be familiar with.
Although counter-intuitive on first sight, we pose the following hypothesis: There is a connec-tion between subjectivity and readabilityin natural language text. If so, we may assume that knowing about its readability possibly yields valuable infor-mation regarding its subjectivity.
1.1 Related Work
To our best knowledge, readability measures have not been used to assess the subjectivity of any lex-ical units so far, be it word forms, phrases, sen-tences or whole documents. However, there is Hoang et al. (2008)’s work on evaluating the qual-ityof user-created documents, and recent work on grading thehelpfulnessof reviews by (O’Mahony and Smyth, 2010), both incorporating readabil-ity measures. Close to our research is Nishikawa et al. (2010)’s study onsentiment summarisation which utilises measures both for informativeness and readability. Very recent support in favour of our hypothesis is provided by (Lahiri et al., 2011), who measure a correlation between informality and readability.
As subjectivity classification poses many inter-esting challenges and has many applications in NLP including genre detection, flame recognition and information extraction, the identification of
2The first sentence is taken from the Wikipedia article
features for subjectivity classification and the clas-sification itself has been extensively studied. Es-pecially Wiebe et al. contributed a lot to the field: Wiebe (2000) learns subjective adjectives from corpora in a semi-supervised fashion, while Wiebe et al. (2001) identify other subjectivity clues us-ing collocations. Riloff et al. (2003) and Riloff and Wiebe (2003) present ways to mine extrac-tion patterns for subjective expressions. Wiebe et al. (2004) summarise these findings and show how different features work “together in concert”. Wiebe et al. (2005) introduce a scheme for anno-tating opinions and the like in Wiebe et al. (2003)’s English-languageMulti-Perspective Question An-swering(MPQA) corpus. Wilson et al. (2004) as-sess the strength of deeply-nested opinions. Wiebe and Riloff (2005) create high-precision classifiers for distinguishing between subjective and objec-tive sentences and use them as a source for learn-ing additional subjectivity clues.
Yu and Hatzivassiloglou (2003) perform both document- and sentence-level subjectivity classi-fication using Na¨ıve Bayes classifiers and several unsupervised approaches. Pang and Lee (2004) use a graph-based formalism to first tell subjective and objective sentences apart, then perform a po-larity classification employing both Na¨ıve Bayes classifiers and Support Vector Machines.
1.2 Outline
This paper is structured as follows: In the next sec-tion, we describe our method by presenting hith-erto unused features for subjectivity classification: readability measures. In Section 3 we describe our experimental setup and evaluate its performance. Finally, we draw conclusions and point out possi-ble directions for future work in Section 4. 2 Method
Following our assumption that knowing about the readability of natural language text possibly yields valuable information regarding its subjectivity, we will try to measure readability and later exploit this information forsentence-level subjectivity classifi-cation.
According to Klare (1974)’s survey there are 3 possible solutions to “tell whether a particular piece of writing is likely to be readable to a partic-ular group of readers”: A first solution is simply to guess. A second solution are tests, manually built and refined. A third solution arereadability
measures. We will assess readability by such mea-sures for the obvious reason that some of them are automatically computable.
2.1 Readability Measures
We chose 6 different readability formulae from the large body of available readability measures. All measures we chose are automatically computable anddo notdepend on lexical resources like word lists and the like. We solely present the 6 formulae themselves. The reader interested in their underly-ing ideas, their development and the derivation of their constants and variables may be refered to the aforementioned Klare (1974), or the original work cited below.
Additionally, we propose an easy to calculate formula that embodies our own intuition for as-sessing readability.
2.1.1 Devereux Readability Index
TheDevereux Readability IndexD was introduced by Smith (1961) and is calculated as shown in Equation 1,
D= 1.56×wl+ 0.19×sl−6.49 (1) wherewlis the average word length in characters andslis the average sentence length in words. The Devereux formula was designed to cover school grades 4 to 12. Hence, the higher the value of D, the less readable the graded text according to the formula.
2.1.2 Easy Listening Formula
The Easy Listening FormulaEL was introduced by Fang (1966) and is calculated simply as shown in Equation 2,
EL=npsw (2)
wherenpswis the average number of polysyllabic words per sentence, i.e. words with more than just one syllable. The Easy Listening Formula is, as the name suggests, tailored to “listenability” rather than readability. Therefore, the higher the value of EL, the less “listenable” the graded text according to the formula.
2.1.3 Fog Index
TheFog Indexwas introduced in Gunning (1952) and reformulated by Powers et al. (1958). It is cal-culated as shown in Equation 3,
wheresl is the average sentence length in words andnosw is the average number of one-syllable words per sentence. The higher the value of FI, the less readable the graded text according to the formula.
2.1.4 FORCAST
TheFORCASTformula F was introduced in Cay-lor et al. (1973). It is calculated as shown in Equa-tion 4,
F= 20.41−0.11×nosw (4) wherenoswis the average number of one-syllable words per sentence. The higher the value of F, the less readable the graded text according to the for-mula.
2.1.5 New Reading Ease Index
The New Reading Ease Index NREI was intro-duced by Farr et al. (1951) and is calculated as shown in Equation 5,
NREI= 1.599×nosw−1.015×sl−31.517 (5) wherenoswis the average number of one-syllable words per sentence andslis the average sentence length in words. The higher the value of NREI, the less readable the graded text according to the formula.
2.1.6 SMOG
The SMOG grading S was introduced by McLaughlin (1969) and is calculated as shown in Equation 6,
S= 3 +√npsw (6) wherenpswis the number of polysyllabic words. Again, the higher the value of SMOG, the less readable the graded text according to the formula. 2.1.7 An Own Formula
Following our intuition for how to assess read-ability, we propose an easy to calculate formula, shown in Equation 7.
W=wl×sl×ntop (7) Here, wl is the average word length per sen-tence, slis the average sentence length in words and ntop is the average number of words in each sentence, that are not among the top 1,000 most frequent words of a large reference cor-pus. This list was automatically extracted from
D EL FI F NREI S W
wl × ×
sl × × × ×
nosw × × ×
npsw × ×
[image:3.612.322.516.58.138.2]ntop ×
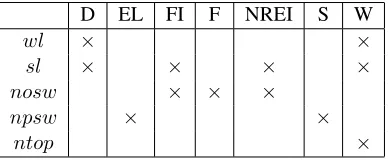
Table 1: Comparison of language characteristics captured by the presented readability formulae. wldenotes the average word length, sl the aver-age sentence length in words, nosw the average number of one-syllable words per sentence,npsw the average number of polysyllabic words per sen-tence.
an English-language newspaper corpus of Uni-versity of Leipzig’s Wortschatz3 project
consist-ing of 49,628,893 distinct sentences, 4,785,862 word types and 926,766,504 word tokens. The idea behindntopis, that high-frequency words are common to all readers, whereas medium- to low-frequency words are not necessarily. The more un-familiar words a reader encounters in a text, the less readable it is. wl and sl basically capture the same idea: both longer sentences and longer words lead to less readable text. Just as for all the other formulae, the higher the value of W, the less readable the graded text according to our formula. 2.1.8 Other Formulae
There are other well-known readability formulae we did not investigate in yet, e.g. Lorge (1939) and Lorge (1948)’sLorge formula, Flesch (1944)’s Flesch formulaand Dale and Chall (1948)’s Dale-Chall formula. These rely on lexical resources some of which are not publicly available and addi-tionally introduce stronger language dependency. 2.2 Summary
Different readability formulae capture different language characteristics, as summarised in Table 1. Not only do they differ in their encoded fea-tures, but also in their intended outcome. Whereas some aim to determine a school grade, some refer to tables for further interpretation. For those rea-sons, the readabilities calculated by the presented measures are not comparable in general, although they do have in common, that higher values sig-nalise less readable (or less listenable) text.
3http://wortschatz.informatik.
3 Evaluation
In order to evaluate whether the presented read-ability measures indeed yield possibly valuable in-formation regarding a natural language text’s jectivity or not, we perform a sentence-level sub-jectivity classification using readability formulae as features: i.e., given a sentence, extract its fea-tures and classify it as being either subjective or objective.
3.1 Experimental Setup
The evaluation data set, the features and the text classifier we used in our experiments are now briefly described.
3.1.1 Evaluation Data Set
To ensure comparability and reproducibility of our results we use Pang and Lee (2004)’s publicly availablesubjectivity data set v1.04. This
widely-used data set consists of 5,000 sentences marked as “subjective” and 5,000 sentences marked as “objective”.
3.1.2 Features
Our baseline features are subjectivity clues pro-vided by Wilson et al. (2005). Their freely avail-able English-language lexical resource encom-passes 8,221 word forms, each manually anno-tated for being either a strong or a weak subjectiv-ity clue and for its polarsubjectiv-ity being either positive, negative or neutral. We only used the 5,569strong subjectivity clues to form a solid baseline. Exam-ples of strong subjectivity clues includedisagree, loveandoverstate.
Our additional features are the readability for-mulae presented in Section 2. Although most of them were developed to capture readability of whole texts, we apply them to single sentences. Their minima, maxima, averages and standard deviances measured in the 5,000 subjective and 5,000 objective sentences are shown in Table 4. 3.1.3 Text Classifier
The actual text classification is performed by Sup-port Vector Machines (SVMs) (cf. Vapnik (1995) and Cortes and Vapnik (1995)). SVMs are known for being able to handle large feature spaces while simultaneously limiting overfitting. Because of the large number of baseline features at hand, SVMs were a natural choice. The SVMs were
4http://www.cs.cornell.edu/People/
pabo/movie-review-data/
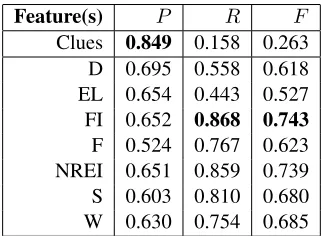
Feature(s) P R F
[image:4.612.337.498.57.175.2]Clues 0.849 0.158 0.263 D 0.695 0.558 0.618 EL 0.654 0.443 0.527 FI 0.652 0.868 0.743 F 0.524 0.767 0.623 NREI 0.651 0.859 0.739 S 0.603 0.810 0.680 W 0.630 0.754 0.685
Table 2: PrecisionP, recallRand f-scoreF of all single features.
Feature(s) P R F
EL, F, NREI 0.806 0.870 0.825 D, EL, FI, F, S 0.636 0.961 0.760 D, EL, F, NREI, W 0.806 0.910 0.845 Clues, FI, F 0.870 0.258 0.396 Clues, D, F, S 0.702 0.695 0.694 Clues, FI, F, NREI, S 0.743 0.681 0.704
Table 3: PrecisionP, recall Rand f-scoreF of the best performing feature combinations with and without (Wilson et al., 2005)’s strong subjectivity clues.
trained using an radial basis function kernel as pro-vided byLibSVM(cf. Chang and Lin (2001)).
Even though it is highly probable that some of the baseline features are either redundant, mislead-ing, or both, no feature selection (cf. for example Weston et al. (2001)) was carried out.
3.2 Results
As we use 8 features (7 readability formula and a “feature package” consisting of 5,569 strong sub-jectivity clues), there areP8
k=1 8k
= 255 possi-ble feature combinations. For each feature combi-nation a SVM was trained and tested in a 10-fold cross validation setting.
In this paper we only report on the best per-forming feature combinations regarding precision, recall and f-score plus each single feature on its own. The results of all feature combinations will be made accessible through the author’s web site5
by the time of the publication of this work. Results of single features are shown in Table 2, results for best performing feature combinations are shown in Table 3.
5http://www.asv.informatik.
[image:4.612.316.520.224.316.2]Formula Minimum Maximum Average Std.-Dev.
Subjecti ve
Objecti ve
Subjecti ve
Objecti ve
Subjecti ve
Objecti ve
Differ ence
Subjecti ve
Objecti ve
D -1.86 1.06 10.81 16.43 4.62 5.06 9.58% 1.94 2.25
EL 0.0 0.00 22.0 35.0 7.12 8.15 14.38% 3.81 4.46
FI 3.27 3.35 7.87 10.14 4.78 5.13 7.46% 0.76 0.92
F 16.36 14.71 20.32 20.32 19.16 19.0 0.87% 0.58 0.68 NREI -85.21 -111.79 -32.18 -33.09 -49.78 -53.82 8.18% 8.74 10.68
S 3.13 3.13 6.74 8.55 4.93 4.82 2.32% 0.68 0.79
[image:5.612.109.508.59.211.2]W 7.0 7.6 75.84 114.75 31.74 36.24 14.19% 10.86 14.22
Table 4: The minima, maxima, averages and standard deviances of the presented readability formulae.
3.3 Discussion
Although the presented measures may be consid-ered as rather crude approximations of readability, it is quite clear from the results shown in Table 2 and Table 3 that they provide a valuable source of information regarding the sentence-level sub-jectivity.
Whereas for “single features” the strong subjec-tivity clues perform best in regards to precision, every single readability formula significantly out-performs them in regards to both recall and f-score as shown in Table 2. The best performing read-ability measure in terms of precision is the Dev-ereux Readability Index, the Fog Index performs best in recall and f-score. Even though these re-sults look promising on their own, it is notewor-thy that a classifier that simply always chooses the same class reaches P = 0.5, R = 1.0 and F = 0.67 on the given data set.
Combinations of different readability formulae showconsiderable improvement in precision, re-call and f-score over single readability formula features as shown in Table 3. Finally, combining different readability formulae with strong subjec-tivity clues shows further improvement and out-performs using these clues alone in precision, re-call and f-score, as also shown in Table 3.
It is remarkable that FORCAST appears in ev-ery single feature combination shown in Table 3, both with and without the subjectivity clues. Noticeably Easy Listening Formula only appears in feature combinations without the subjectivity clues. Fog Index, the best performing single read-ability formula, appears only in combinations in-cluding the subjectivity clues. Our own formula does not contribute a lot – it only appears once.
Comparison
(Pang and Lee, 2004) report 92% accuracy on sentence-level subjectivity classification using Na¨ıve Bayes classifiers and 90% accuracy using SVMs on the same data set. (Wiebe et al., 2004) report 94% accuracy ondocument-level subjectiv-ity classification using thek-nearest-neighbour al-gorithm. Although these results are not directly comparable to ours, our approach seems to per-form not as good as theirs.
4 Conclusion & Future Work
We have shown that using readability formulae and their combinations as features in addition to already well-known subjectivity clues leads to sig-nificant quality improvements in sentence-level subjectivity classification. Therefore, one might argue in favour of our initial hypothesis and say that there is a connection between readability and subjectivity. We will carry out a detailed error analysis to shed light on their relationship.
Questions still remaining open include: do we need readability formulae themselves or is it suf-ficient to just use the language characteristics cap-tured by them? Are readability formulae indepen-dent from each other, and if so, to what degree? Are our results reproducible on other data sets, in other domains and even for languages other than English? If so, is there a plausible linguistic expla-nation for a correlation between subjectivity and readability? We will address these points in future work.
Acknowledgements
I’m grateful to Bo Pang and Lilian Lee, Chih-Chung Chang and Chih-Jen Lin as well as Theresa Wilson, Janyce Wiebe and Paul Hoffmann for making their data sets, their software and their lex-ical resources publicly available. Special thanks go to the anonymous reviewers whose useful com-ments and suggestions considerably improved the original paper.
References
John S. Caylor, Thomas G. Sticht, Lynn C. Fox, and J. Patrick Ford. 1973. Methodologies for Determin-ing ReadDetermin-ing Requirements of Military Occupational Specialties. Technical Report 73-5, HUMRO West-ern Division.
Chih-Chung Chang and Chih-Jen Lin, 2001. LIB-SVM: a Library for Support Vector Machines. Software available athttp://www.csie.ntu. edu.tw/˜cjlin/libsvm.
Corinna Cortes and Vladimir Vapnik. 1995. Support-vector Networks. Machine Learning, 20(3):273– 297.
Edgar Dale and Jeanne S. Chall. 1948. A Formula for Predicting Eeadability. Educational Research Bul-letin, pages 11–28.
Irving E. Fang. 1966. The “Easy Listening For-mula”. Journal of Broadcasting & Electronic Me-dia, 11(1):63–68.
James N. Farr, James J. Jenkins, and Donald G. Pa-terson. 1951. Simplification of Flesch Reading Ease Formula. Journal of Applied Psychology, 35(5):333–337.
Rudolf Flesch. 1944. Marks of Readable Style: A Study in Adult Education. The Teachers College Record, 45(6):422–423.
Robert Gunning. 1952. The Technique of Clear Writ-ing. McGraw-Hill New York.
Linh Hoang, Jung-Tae Lee, Young-In Song, and Hae-Chang Rim. 2008. A Model for Evaluating the Quality of User-created Documents. InProceedings of the 4th Asia Information Retrieval Conference on Information Retrieval Technology, pages 496–501.
George R. Klare. 1974. Assessing Readability. Read-ing Research Quarterly, 10(1):62–102.
Shibamouli Lahiri, Prasenjit Mitra, and Xiaofei Lu. 2011. Informality Judgment at Sentence Level and Experiments with Formality Score. pages 446–457.
Irving Lorge. 1939. Predicting Reading Difficulty of Selections for Children. Elementary English Re-view, 16(6):229–33.
Irving Lorge. 1948. The Lorge and Flesch Readabil-ity Formulae: a Correction. School and Society, 67:141–142.
G. Harry McLaughlin. 1969. SMOG Grading: A New Readability Formula. Journal of Reading, 12(8):639–646.
Hitoshi Nishikawa, Takaaki Hasegawa, Yoshihiro Mat-suo, and Genichiro Kikui. 2010. Optimizing Infor-mativeness and Readability for Sentiment Summa-rization. InProceedings of the 48th Annual Meet-ing of the Association for Computational LMeet-inguistics (ACL), pages 325–330.
Michael P. O’Mahony and Barry Smyth. 2010. The Readability of Helpful Product Reviews. In Pro-ceedings of the 23rd International Florida Artificial Intelligence Research Society Conference (FLAIRS).
Bo Pang and Lillian Lee. 2004. A Sentimental Edu-cation: Sentiment Analysis using Subjectivity Sum-marization Based on Minimum Cuts. In Proceed-ings of the 42nd Annual Meeting of the Association for Computational Linguistics (ACL).
Richard D. Powers, W.A. Sumner, and Bryant E. Kearl. 1958. A Recalculation of Four Adult Readabil-ity Formulas. Journal of Educational Psychology, 49(2):99–105.
Ellen Riloff and Janyce Wiebe. 2003. Learning Ex-traction Patterns for Subjective Expressions. In Pro-ceedings of the 8th Conference on Empirical Meth-ods in Natural Language Processing (EMNLP), pages 105–112.
Ellen Riloff, Janyce Wiebe, and Theresa Wilson. 2003. Learning Subjective Nouns Using Extraction Pat-tern Bootstrapping. InProceedings of the 7th Con-ference on Natural Language Learning at HLT-NAACL, pages 25–32.
Edgar A. Smith. 1961. Devereux Readability Index.
The Journal of Educational Research, 54(8):298– 303.
Vladimir Vapnik. 1995. The Nature of Statistical Learning. Springer New York, NY.
Jason Weston, Sayan Mukherjee, Olivier Chapelle, Massimiliano Pontil, Tomaso Poggio, and Vladimir Vapnik. 2001. Feature Selection For SVMs. Ad-vances in Neural Information Processing Systems, pages 668–674.
Janyce Wiebe and Ellen Riloff. 2005. Creating Subjec-tive and ObjecSubjec-tive Sentence Classifiers from Unan-notated Texts. InProceedings of the Sixth Interna-tional Conference on Intelligent Text Processing and Computational Linguistics (CICLing), pages 486– 497.
Janyce Wiebe, Theresa Wilson, and Matthew Bell. 2001. Identifying Collocations for Recognizing Opinions. InProceedings of the ACL Workshop on Collocation: Computational Extraction, Analysis, and Exploitation, pages 24–31.
Janyce Wiebe, Eric Breck, Chris Buckley, Claire Cardie, Paul Davis, Bruce Fraser, Diane Litman, David Pierce, Ellen Riloff, Theresa Wilson, David Day, and Mark Maybury. 2003. Recognizing and Organizing Opinions Expressed in the World Press. InWorking Notes – New Directions in Question An-swering (AAAI Spring Symposium Series).
Janyce Wiebe, Theresa Wilson, Rebecca Bruce, Matthew Bell, and Melanie Martin. 2004. Learn-ing Subjective Language. Computational Linguis-tics, 30(3):277–308.
Janyce Wiebe, Theresa Wilson, and Claire Cardie. 2005. Annotating Expressions of Opinions and Emotions in Language. Language Resources and Evaluation, 1(2):165–210.
Janyce Wiebe. 2000. Learning Subjective Adjectives from Corpora. InProceedings of the National Con-ference on Artificial Intelligence, pages 735–741. Theresa Wilson, Janyce Wiebe, and Rebecca Hwa.
2004. Just How Mad Are You? Finding Strong and Weak Opinion Clauses. InProceedings of the Na-tional Conference on Artificial Intelligence, pages 761–769.
Theresa Wilson, Janyce Wiebe, and Paul Hoffmann. 2005. Recognizing Contextual Polarity in Phrase-level Sentiment Analysis. In Proceedings of the Conference on Human Language Technology (HLT) and Empirical Methods in Natural Language Pro-cessing (EMNLP), pages 347–354.