The SDL Language Weaver Systems in the WMT12 Quality Estimation
Shared Task
Radu Soricut Nguyen Bach Ziyuan Wang
SDL Language Weaver 6060 Center Drive, Suite 101
Los Angeles, CA, USA
{rsoricut,nbach,zwang}@sdl.com
Abstract
We present in this paper the system sub-missions of the SDL Language Weaver team in the WMT 2012 Quality Estimation shared-task. Our MT quality-prediction sys-tems use machine learning techniques (M5P regression-tree and SVM-regression models) and a feature-selection algorithm that has been designed to directly optimize towards the of-ficial metrics used in this shared-task. The resulting submissions placed 1st (the M5P model) and 2nd (the SVM model), respec-tively, on both the Ranking task and the Scor-ing task, out of 11 participatScor-ing teams.
1 Introduction
The WMT 2012 Quality Estimation shared-task fo-cused on automatic methods for estimating machine translation output quality at run-time (sentence-level estimation). Different from MT evaluation met-rics, quality prediction (QP) systems do not rely on reference translations and are generally built us-ing machine learnus-ing techniques to estimate quality scores (Specia et al., 2009; Soricut and Echihabi, 2010; Bach et al., 2011; Specia, 2011).
Some interesting uses of sentence-level MT qual-ity prediction are the following: decide whether a given translation is good enough for publishing as-is (Soricut and Echihabi, 2010), or inform monolin-gual (target-language) readers whether or not they can rely on a translation; filter out sentences that are not good enough for post-editing by professional translators (Specia, 2011); select the best translation
among options from multiple MT systems (Soricut and Narsale, 2012), etc.
This shared-task focused on estimating the qual-ity of English to Spanish automatic translations. The training set distributed for the shared task comprised of 1, 832 English sentences taken from the news do-main and their Spanish translations. The translations were produced by the Moses SMT system (Koehn et al., 2007) trained on Europarl data. Translations also had a quality score derived from an average of three human judgements of Post-Editing effort using a 1-5 scale (1 for worse-quality/most-effort, and 1-5 for best-quality/least-effort). Submissions were evalu-ated using a blind official test set of 422 sentences produced in the same fashion as the training set. Two sub-tasks were considered: (i) scoring transla-tions using the 1-5 quality scores (Scoring), and (ii) ranking translations from best to worse (Ranking). The official metrics used for the Ranking task were DeltaAvg (measuring how valuable a proposed rank-ing is from the perspective of extrinsic values asso-ciated with the test entries, in this case post-editing effort on a 1-5 scale; for instance, a DeltaAvg of 0.5 means that the top-ranked quantiles have +0.5 bet-ter quality on average compared to the entire set), as well as the Spearman ranking correlation. For the Scoring task the metrics were Mean-Absolute-Error (MAE) and Root Mean Squared Error (RMSE). The interested reader is referred to (Callison-Burch et al., 2012) for detailed descriptions of both the data and the evaluation metrics used in the shared-task.
The SDL Language Weaver team participated with two submissions based on M5P and SVM re-gression models in both the Ranking and the Scoring
tasks. The models were trained and used to predict Post-Editing–effort scores. These scores were used as-such for the Scoring task, and also used to gener-ate sentence rankings for the Ranking task by simply (reverse) sorting the predicted scores. The submis-sions of the SDL Language Weaver team placed 1st (the M5P model) and 2nd (the SVM model) on both the Ranking task (out of 17 entries) and the Scoring task (out of 19 entries).
2 The Feature Set
Both SDLLW system submissions were created starting from 3 distinct sets of features: the baseline feature set (here called BFs), the internal features available in the decoder logs of Moses (here called MFs), and an additional set of features that we de-veloped internally (called LFs). We are presenting each of these sets in what follows.
2.1 The Baseline Features
The WMT Quality Estimation shared-task defined a set of 17 features to be used as “baseline” fea-tures. In addition to that, all participants had access to software that extracted the corresponding feature values from the inputs and necessary resources (such as the SMT-system’s training data, henceforth called SMTsrc and SMTtrg). For completeness, we are providing here a brief description of these 17 base-line features (BFs):
BF1 number of tokens in the source sentence
BF2 number of tokens in the target sentence
BF3 average source token length
BF4 LM probability of source sentence
BF5 LM probability of the target sentence
BF6 average number of occurrences of the target word within the target translation
BF7 average number of translations per source word in the sentence (as given by IBM 1 table thresh-olded so thatP rob(t|s)>0.2)
BF8 average number of translations per source word in the sentence (as given by IBM 1 table thresh-olded so that P rob(t|s) > 0.01) weighted
by the inverse frequency of each word in the source corpus
BF9 percentage of unigrams in quartile 1 of fre-quency (lower frefre-quency words) in SMTsrc
BF10 percentage of unigrams in quartile 4 of fre-quency (higher frefre-quency words) in SMTsrc
BF11 percentage of bigrams in quartile 1 of fre-quency of source words in SMTsrc
BF12 percentage of bigrams in quartile 4 of fre-quency of source words in SMTsrc
BF13 percentage of trigrams in quartile 1 of fre-quency of source words in SMTsrc
BF14 percentage of trigrams in quartile 4 of fre-quency of source words in SMTsrc
BF15 percentage of unigrams in the source sentence seen in SMTsrc
BF16 number of punctuation marks in source sen-tence
BF17 number of punctuation marks in target sentence
These features, together with the other ones we present here, are entered into a feature-selection component that decides which feature set to use for optimum performance (Section 3.2).
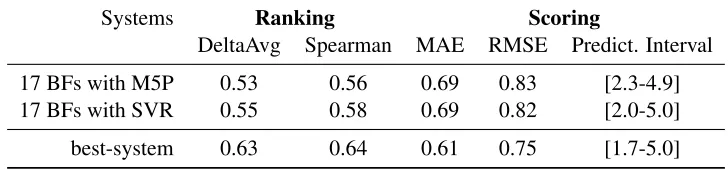
In Table 1, we are presenting the performance on the official test set of M5P and SVM-regression (SVR) models using only the BF features. The M5P model is trained using the Weka package 1 and the default settings for M5P decision-trees (weka.classifiers.trees.M5P). The SVR model is trained using the LIBSVM toolkit 2. The follow-ing options are used: “-s 3” (-SVR) and “-t 2” (ra-dial basis function). The following parameters were optimized via 5-fold cross-validation on the train-ing data: “-c cost”, the parameterC of-SVR; “-g gamma”, theγparameter of the kernel function; “-p epsilon”, thefor the loss-function of-SVR.
1
http://www.cs.waikato.ac.nz/ml/weka/
Systems Ranking Scoring
DeltaAvg Spearman MAE RMSE Predict. Interval
17 BFs with M5P 0.53 0.56 0.69 0.83 [2.3-4.9] 17 BFs with SVR 0.55 0.58 0.69 0.82 [2.0-5.0]
[image:3.612.123.487.56.141.2]best-system 0.63 0.64 0.61 0.75 [1.7-5.0]
Table 1: Performance of the Baseline Features using M5P and SVR models on the test set.
The results in Table 1 are compared against the “best-system” submission, in order to offer a com-parison point. The “17 BFs with SVM” system ac-tually participated as an entry in the shared-task, rep-resenting the current state-of-the-art in MT quality-prediction. This system has been ranked 6th (out of 17 entries) in the Ranking task, and 8th (out of 19 entries) in the Scoring task.
2.2 The Decoder Features
The current Quality Estimation task has been de-fined as a glass-box task. That is, the prediction component has access to everything related to the internal workings of the MT system for which the quality prediction is made. As such, we have cho-sen to use the internal scores of the Moses3decoder (available to all the participants in the shared-task) as a distinct set of features. These features are the following:
MF1 Distortion cost
MF2 Word penalty cost
MF3 Language-model cost
MF4 Cost of the phrase-probability of source given targetΦ(s|t)
MF5 Cost of the word-probability of source given targetΦlex(s|t)
MF6 Cost of the phrase-probability of target given sourceΦ(t|s)
MF7 Cost of the word-probability of target given sourceΦlex(t|s)
MF8 Phrase penalty cost
3http://www.statmt.org/moses/
These features are then entered into a feature-selection component that decides which feature set to use for achieving optimal performance.
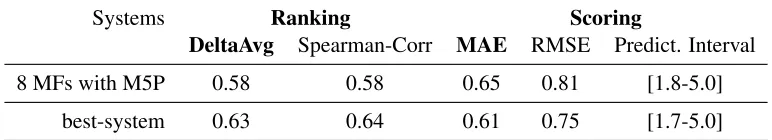
The results in Table 2 present the performance on the test set of the Moses features (with an M5P model), presented against the “best-system” sub-mission. These numbers indicate that the Moses-internal features, by themselves, are fueling a QP system that surpasses the performance of the strong “baseline” system. We note here that the “8 MFs with M5P” system would have been ranked 4th (out of 17 entries) in the Ranking task, and 5th (out of 19 entries) in the Scoring task.
2.3 Language Weaver Features
In addition to the features presented until this point, we have created and tested additional features that helped our systems achieve improved performance. In addition to the SMT training corpus, these fea-tures also use the SMT tuning dev set (henceforth called Devsrc and Devtrg). These features are the following:
LF1 number of out-of-vocabulary tokens in the source sentence
LF2 LM perplexity for the source sentence
LF3 LM perplexity for the target sentence
LF4 geometric mean (λ-smoothed) of 1-to-4–gram precision scores (i.e., BLEU score without brevity-penalty) of source sentence against the sentences of SMTsrcused as “references”
Systems Ranking Scoring
DeltaAvg Spearman-Corr MAE RMSE Predict. Interval
8 MFs with M5P 0.58 0.58 0.65 0.81 [1.8-5.0]
[image:4.612.113.499.56.126.2]best-system 0.63 0.64 0.61 0.75 [1.7-5.0]
Table 2: Performance of the Moses-based Features with an M5P model on the test set.
LF6 geometric mean (λ-smoothed) of 1-to-4–gram precision scores of source sentence against the top BLEU-scoring quartile of Devsrc
LF7 geometric mean (λ-smoothed) of 1-to-4–gram precision scores of target translation against the top BLEU-scoring quartile of Devtrg
LF8 geometric mean (λ-smoothed) of 1-to-4–gram precision scores of source sentence against the bottom BLEU-scoring quartile of Devsrc
LF9 geometric mean (λ-smoothed) of 1-to-4–gram precision scores of target translation against the bottom BLEU-scoring quartile Devtrg
LF10 geometric mean (λ-smoothed) of 1-to-4–gram precision scores of target translation against a pseudo-reference produced by a second MT Eng-Spa system
LF11 count of one-to-one (O2O) word alignments between source and target translation
LF12 ratio of O2O alignments over source sentence
LF13 ratio of O2O alignments over target translation
LF14 count of O2O alignments with Part-of-Speech– agreement
LF15 ratio of O2O alignments with Part-of-Speech– agreement over O2O alignments
LF16 ratio of O2O alignments with Part-of-Speech– agreement over source
LF17 ratio of O2O alignments with Part-of-Speech– agreement over target
Most of these features have been shown to help Quality Prediction performance, see (Soricut and Echihabi, 2010) and (Bach et al., 2011). Some of
them are inspired from word-based confidence esti-mation, in which the alignment consensus between the source words and target-translation words are informative indicators for gauging the quality of a translation hypothesis. The one-to-one (O2O) word alignments are obtained from the decoding logs of Moses. We use the TreeTagger to obtain Spanish POS tags4 and a maximum-entropy POS tagger for
English. Since Spanish and English POS tag sets are different, we normalize their fine-grained POS tag sets into a coarser tag set by mapping the orig-inal POS tags into more general linguistic concepts such as noun, verb, adjective, adverb, preposition, determiner, number, and punctuation.
3 The Models
3.1 The M5P Prediction Model
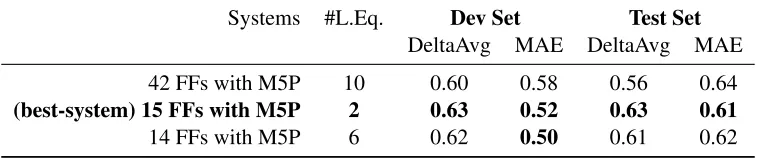
Regression-trees built using the M5P algo-rithm (Wang and Witten, 1997) have been previ-ously shown to give good QP performance (Soricut and Echihabi, 2010). For these models, the num-ber of linear equations used can provide a good indication whether the model overfits the training data. In Table 3, we compare the performance of several M5P models: one trained on all 42 features presented in Section 2, and two others trained on only 15 and 14 features, respectively (selected using the method described in Section 3.2). We also present the number of linear equations (L.Eq.) used by each model. Aside from the number of features they employ, these models were trained under identical conditions: default parameters of the Weka implementation, and 1527 training instances (305 instances were held-out for the feature-selection step, from the total 1832 labeled instances available for the shared-task).
As the numbers in Table 3 clearly show, the set of
Systems #L.Eq. Dev Set Test Set
DeltaAvg MAE DeltaAvg MAE
42 FFs with M5P 10 0.60 0.58 0.56 0.64
(best-system) 15 FFs with M5P 2 0.63 0.52 0.63 0.61
[image:5.612.117.496.56.135.2]14 FFs with M5P 6 0.62 0.50 0.61 0.62
Table 3: M5P-model performance for different feature-function sets (15-FFs∈42-FFs; 14-FFs∈42-FFs).
feature-functions that an M5P model is trained with matters considerably. On both our development set and the official test set, the 15-FF M5P model out-performs the 42-FF model (even if 15-FF∈42-FF). The 42-FF model would have been ranked 5th (out of 17 entries) in the Ranking task, and also 5th (out of 19 entries) in the Scoring task. In comparison, the 15-FF model (feature set optimized for best perfor-mance under the DeltaAvg metric) was our official M5P submission (SDLLW M5PBestDeltaAvg), and ranked 1st in the Ranking task and also 1st in the Scoring task. The 14-FF model (also a subset of the 42-FF set, optimized for best performance under the MAE metric) was not part of our submission, but would have been ranked 2nd on both the Ranking and Scoring tasks.
The number of linear equations used (see #L.Eq. in Table 3) is indicative for our results. When using 42 FFs, the M5P model seems to overfit the train-ing data (10 linear equations). In contrast, the model trained on a subset of 15 features has only 2 linear equations. This latter model is less prone to overfit-ting, and performs well given unseen test data. The same number for the 14-FF model indicates slight overfit on the training and dev data: with 6 equa-tions, this model has the best MAE numbers on the Dev set, but slightly worse MAE numbers on the Test score compared to the 15-FF model.
3.2 Feature Selection
As we already pointed out, some of the features of the entire 42-FF set are highly overlapping and cap-ture roughly the same amount of information. To achieve maximum performance given this set, we applied a computationally-intensive feature-selection method. We have used the two official metrics, DeltaAvg and MAE, and a development set of 305 instances to perform an extensive
feature-selection procedure that directly optimizes the two official metrics using M5P regression-trees.
The overall space that needs to be explored for 42 features is huge, on the order of242possible com-binations. We performed the search in this space in several steps. In a first step, we eliminated the obvi-ously overlapping features (e.g., BF5 and MF3 are both LM costs of the target translation), and also excluded the POS-based features (LF14-LF17, see Section 2.3). This step reduced the overall num-ber of features to 24, and therefore left us with an order of 224 possible combinations. Next, we ex-haustively searched all these combinations by build-ing and evaluatbuild-ing M5P models. This operation is computationally-intensive and takes approxima-tively 60 hours on a cluster of 800 machines. At the conclusion of this step, we ranked the results and considered the top 64 combinations. The perfor-mance of these top combinations was very similar, and a set of 15 features was selected as the superset of active feature-functions present in most of the top 64 combinations.
DeltaAvg optim. BF1 BF3 BF4 BF6 BF12 BF13 BF14 MF3 MF4 MF6 LF1 LF10 LF14 LF15 LF16 MAE optim. BF1 BF3 BF4 BF6 BF12
BF14 BF16 MF3 MF4 MF6 LF1 LF10 LF14 LF17
Table 4: Feature selection results.
Dev Set Test Set
SVR Model (C;γ;) #S.V. DeltaAvg MAE DeltaAvg MAE
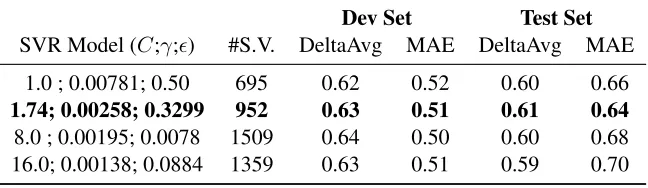
1.0 ; 0.00781; 0.50 695 0.62 0.52 0.60 0.66
1.74; 0.00258; 0.3299 952 0.63 0.51 0.61 0.64
[image:6.612.145.469.56.150.2]8.0 ; 0.00195; 0.0078 1509 0.64 0.50 0.60 0.68 16.0; 0.00138; 0.0884 1359 0.63 0.51 0.59 0.70
Table 5: SVR-model performance for dev and test sets.
over the set of all the new possible combinations. In the end, we selected the winning feature-function combination as our final feature-function sets: 15 features for DeltaAvg optimization and 14 features for MAE optimization. They are given in Table 4, using the feature id-s given in Section 2. The perfor-mance of these two feature-function sets using M5P models can be found in Table 3.
3.3 The SVM Prediction Model
The second submission of our team consists of rank-ings and scores produced by a system using an -SVM regression model (-SVR) and a subset of 19 features. This model is trained on 1,527 training examples by the LIBSVM package using radial ba-sis function (RBF) kernel. We have found that the feature-set obtained by the feature-selection opti-mization for M5P models described in Section 3.2 does not achieve the same performance for SVR models on our development set. Therefore, we have performed our SVR experiments using a hand-selected set of features: 9 features from the BF fam-ily (BF1 BF3 BF4 BF6 BF10 BF11 BF12 BF14 BF16); all 8 features from the MF family; and 2 fea-tures from the LF family (LF1 LF10).
We optimize the three hyper parametersC,γ, and of the SVR method using a grid-search method and measure their performance on our development set of 305 instances. TheCparameter is a penalty fac-tor: ifCis too high, we have a high penalty for non-separable points and may store many support vec-tors and therefore overfit the training data; ifC is too low, we may end up with a model that is poorly fit. Theparameter determines the level of accuracy of the approximated function; however, getting too close to zero may again overfit the training data. The γ parameter relates to the RBF kernel: large γ
val-ues give the model steeper and more flexible kernel functions, while small gamma values give the model smoother functions. In general,C, , and γ are all sensitive parameters and instantiate -SVR models that may behave very differently.
In order to cope with the overfitting issue given a small amount of training data and grid search op-timization, we train our models with 10-fold cross validation and restart the tuning process several times using different starting points and step sizes. We select the best model parameters based on a cou-ple of indicators: the performance on the develop-ment set and the number of support vectors of the model. In Table5 we present the performance of dif-ferent model parameters on both the development set and the official test set. Our second submis-sion (SDLLW SVM), which placed 2nd in both the Ranking and the Scoring tasks, is the entry in bold font. It was chosen based on good performance on the Dev set and also a setting of the (C, γ, ) pa-rameters that provides a number of support vectors that is neither too high nor too low. As a contrastive point, the model on the row below it uses 1,509 sup-port vectors extracted from 1,527 training vectors, which represents a clear case of overfitting. Indeed, the performance of this model is marginally better on the Dev set, but ends up underperforming on the Test data.
4 Conclusions
Moses-internal features, by themselves, can fuel a QP-system that surpasses the performance of the strong “baseline” system used in this shared task to represent state-of-the-art performance in MT qual-ity prediction. This is a surprising finding, consid-ering that these decoder-internal features have been primarily designed to gauge differences in transla-tion quality when starting from the same source sen-tence. In contrast, for quality-prediction tasks like ranking one needs to gauge differences in quality of translations of different source sentences.
The second aspect relates to the importance of feature selection. Given the availability and good scalability of Machine Learning toolkits today, it is tempting to throw as much features as possible at this problem and let the built-in mechanisms of these learning algorithms deal with issues relating to feature overlapping, training-data overfitting, etc. However, these learning algorithms have their own limitations in these regards, and, in conjunction with the limited availability of the labeled data, can easily produce models that are underperforming on blind tests. There is a need for careful engineering of the models and evaluation of the resulting perfor-mance in order to achieve optimal perforperfor-mance us-ing the current state-of-the-art supervised learnus-ing techniques.
References
Nguyen Bach, Fei Huang, and Yaser Al-Onaizan. 2011. Goodness: A method for measuring machine transla-tion confidence. InProceedings of the ACL/HLT, Port-land, Oregon, USA.
Chris Callison-Burch, Philipp Koehn, Christof Monz, Matt Post, Radu Soricut, and Lucia Specia. 2012. Findings of the 2012 Workshop on Statistical Machine Translation. InProceedings of the Seventh Workshop on Statistical Machine Translation, Montreal, Canada, June. Association for Computational Linguistics. Philipp Koehn, Hieu Hoang, Alexandra Birch, Chris
Callison-Burch, Marcello Federico, Nicola Bertoldi, Brooke Cowan, Wade Shen, Christine Moran, Richard Zens, Chris Dyer, Ondrej Bojar, Alexandra Con-stantin, and Evan Herbst. 2007. Moses: Open source toolkit for statistical machine translation. In Proceed-ings of the 45th Annual Meeting of the Association for Computational Linguistics Companion Volume Pro-ceedings of the Demo and Poster Sessions.
Radu Soricut and Abdessamad Echihabi. 2010.
Trustrank: Inducing trust in automatic translations via ranking. InProceedings of ACL.
Radu Soricut and Sushant Narsale. 2012. Combining quality prediction and system selection for improved automatic translation output. In Proceedings of the Seventh Workshop on Statistical Machine Translation, Montreal, Canada, June. Association for Computa-tional Linguistics.
Lucia Specia, Nicola Cancedda, Marc Dymetman, Mar-cho Turchi, and Nello Cristianini. 2009. Estimating the sentence-level quality of machine translation. In Proceedings of EAMT.
Lucia Specia. 2011. Exploiting objective annotations for measuring translation post-editing effort. In Proceed-ings of EAMT.