Reappraising the Long-term Course and Outcome of Psychotic
Disorders:
The ÆSOP-10 Study
Craig Morgan, PhD*,1,2, Julia Lappin, MRCPsych2,3, Margaret Heslin, MSc4, Kim Donoghue,
PhD5, Ben Lomas, MRCPsych6, Ulrich Reininghaus, PhD1, Adanna Onyejiaka1, Tim
Croudace, PhD7, Peter B Jones, FRCPsych8, Robin M Murray, FRS2,3, Paul Fearon, MRCPsych9, Gillian A Doody, MRCPsych6, and Paola Dazzan, MRCPsych2,3
1Centre for Epidemiology and Public Health, Health Service and Population Research
Department, Institute of Psychiatry, King’s College, London, UK 2National Institute for Health
Research (NIHR) Mental Health Biomedical Research Centre at South London and Maudsley
NHS Foundation Trust and King’s College London 3Psychosis Studies Department, Institute of
Psychiatry, King’s College, London, UK 4Centre for Economics of Mental and Physical Health,
Health Service and Population Research Department, Institute of Psychiatry, King’s College,
London, UK 5Addictions Department, Institute of Psychiatry, King’s College, London, UK 6Division
of Psychiatry, University of Nottingham, Nottingham, UK 7Department of Health Sciences,
University of York, York, UK 8Department of Psychiatry, University of Cambridge, Cambridge, UK
9Department of Psychiatry, Trinity College, Dublin, Ireland
Abstract
Background—Studies of the long-term course and outcome of psychoses tend to focus on cohorts of prevalent cases. Such studies bias samples toward those with poor outcomes, which may distort our understanding of prognosis. Long-term follow-up studies of epidemiologically robust first-episode samples are rare.
Method—ÆSOP-10 is a ten-year follow-up of 557 individuals with a first-episode of psychosis initially identified in two areas in the UK (south-east London and Nottingham). Detailed information was collated on course and outcome in three domains (clinical, social, service use) from case records, informants and follow-up interviews.
Results—At follow-up: 37 (7%) cases had died, 29 (6%) had emigrated, and 8 (2%) were excluded. Of the remaining 458, 412 (90%) were traced and some information on follow-up was collated for 387 (85%). Most cases (265, 77%) experienced at least one period of sustained remission; at follow-up, 141 (46%) had been symptom free for two or more years. A majority (208, 72%) of cases had been employed for less than 25% of the follow-up. The median number of hospital admissions, including at first presentation, was 2 (IQR 1-4); a majority (299, 88%) were
*Correspondence to: Dr Craig Morgan, Centre for Epidemiology and Public Health, Institute of Psychiatry, King’s College London. Author Manuscript
Psychol Med. Author manuscript; available in PMC 2014 October 01.
Published in final edited form as:
Psychol Med. 2014 October ; 44(13): 2713–2726. doi:10.1017/S0033291714000282.
Europe PMC Funders Author Manuscripts
admitted a least once and a minority (21, 6%) had 10 or more admissions. Overall, outcomes were worse for those with a non-affective diagnosis, for men and for those from London.
Conclusions—Sustained periods of symptom remission are usual following first presentation to mental health services for psychosis, including for those with a non-affective disorder; almost half recover.
INTRODUCTION
Studies of the long-term course and outcome of psychosis have tended to focus on those with a diagnosis of schizophrenia (or non-affective psychosis) and to follow cohorts of prevalent cases (Hegarty et al., 1994). Such designs bias samples toward those with poor outcomes (Cohen and Cohen, 1984, van Os et al., 1997) and distort our understanding of long-term prognosis.
Studies of unselected samples of incident cases of all psychoses provide the optimum basis for investigating the variability and determinants of course and outcome over the long-term. With the introduction of specialist services for those with a first-episode of psychosis in many countries, a new wave of cohorts has been established. Many of these have already reported on short- (1 to 2 years) to medium- (5 years) term outcomes (e.g., Craig et al., 2004, Gafoor et al., 2010, Larsen et al., 2006, Larsen et al., 2011, Malla et al., 2008, Nordentoft et al., 2010, Norman et al., 2011). However, only a small number have reported longer term outcomes (e.g., Hegelstad et al., 2012). There are, moreover, still limitations to these cohorts and their capacity to provide generalisable information about the long-term trajectories of psychosis. Some comprise individuals recruited into clinical trials; the extent to which those who take part are representative of those with a first-episode is unclear. In addition, many restrict inclusion to those with non-affective psychoses or to narrow age groups (e.g., 16 to 35 years). Studies of unselected samples of incident cases with all psychotic disorders remain rare.
Long-term follow-up studies of first-episode psychosis
To gain some traction on existing findings from long-term (defined here pragmatically as 8 years or more to enhance comparability with our data) follow-up studies of first-episode psychosis, we conducted a review of studies since 1980 drawing, in part, from prior
systematic reviews (Hegarty et al., 1994, Jaaskelainen et al., 2008, Menezes et al., 2006, van Os et al., 1997).
Supplementary Table 1 summarises the methods and main findings on course and outcome from the 13 studies (16 papers) that we identified. There was considerable heterogeneity in reported outcomes. For example, estimates of proportions in remission or recovered (variously defined) at follow-up ranged from 20% (Ciompi, 1980) to 78% (Thara et al., 1994). This variability extended to social outcomes. The proportions in paid work at follow-up, for instance, ranged from 19% (White et al., 2009) to around 40% (Harrison et al., 2001, Harrison and Mason, 2007). What is perhaps most striking is how methodologically diverse these studies are, with little consistency in inclusion criteria, in length of follow-up, and in definitions and measures of course and outcome. For example, there was notable variation in
Europe PMC Funders Author Manuscripts
how remission and recovery were operationalised. In some studies remission was defined as total absence of symptoms (e.g., Thara et al., 1994) and in others as symptoms below a certain threshold (e.g., Crumlish et al., 2009); the time period for achieving remission also varied from 1 month (e.g., Crumlish et al., 2009) to 6 months (e.g., Kurihara et al., 2011). There were similar inconsistencies in how recovery – a concept implying more sustained improvement over time – was defined and operationalised. What is more, only three studies were of first-episode cases of all psychoses (Harris et al., 2005, Harrison et al., 2001, Harrison and Mason, 2007, Hill et al., 2012). In sum, our knowledge of the long-term course and outcome of psychosis is limited both by the methodological heterogeneity of existing studies and by a paucity of epidemiologically robust studies of first-episode cohorts.
ÆSOP-10
In this context, the ÆSOP-10 study – a ten-year follow-up of a large epidemiologically characterised sample of first-episode cases of all psychoses – has the potential to provide novel insights into the nature and determinants of long-term trajectories and outcomes. In this lead paper from the study, we provide a detailed account of the procedures and methods employed in ÆSOP-10, and report primary findings on course and outcome across three domains: clinical, social, and service use (hospital admissions).
METHOD
ÆSOP-10 is a follow-up at approximately ten-years of a cohort of 557 individuals with a first-episode of psychosis initially identified in the south-east London and Nottingham centres of the ÆSOP study (Kirkbride et al., 2006). At baseline a team of researchers screened all in-patient (daily) and out-patient (weekly) mental health services in the catchment areas to identify eligible cases. The sample of 557 comprises all incident cases identified (532) and additional cases identified on a more ad-hoc basis to supplement the brain imaging component of the baseline study (25). In this paper we focus on the 532 incident cases.
Ethics
Full ethical approval for all aspects of the follow-up was provided by the local research ethics committees in south-east London and Nottingham. All researchers had substantive or honorary contracts with either the South London and Maudsley NHS Foundation Trust or the Nottingham Healthcare NHS Trust, the primary participating service providers.
Tracing and Re-contact Procedures
Our procedures for tracing cases were in line with those used in previous long-term follow-up studies (e.g., Harrison et al., 2001).
At approximately ten-years after inclusion in the baseline study, we sought to trace, contact and interview all cases. When identified and recruited originally, detailed re-contact information was collected for all cases. We began by establishing whether cases were currently in contact with mental health services. For those who were, we sought to make contact and invite them to participate via their clinical teams. For those who were not,
Europe PMC Funders Author Manuscripts
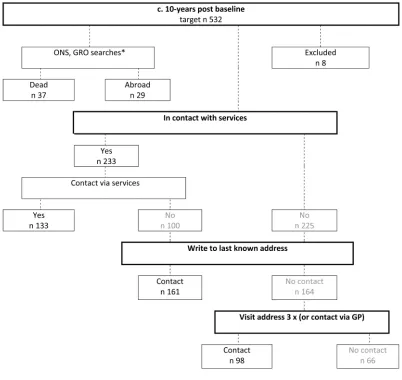
we sent letters to their last known address inviting them to participate. Non-responders were sent a further letter two weeks later and, if necessary, researchers made a maximum of three visits to the address (morning, afternoon and evening) to make initial contact. For those who had moved address (and for whom we had general practitioner [GP] contact details) we sought to make contact and invite them to participate via their GP (see Figure 1). All deaths and emigrations up to and including those that occurred on 12 December 2012 were identified by a case-tracing procedure with the Office for National Statistics (ONS) for England and Wales and the General Register Office (GRO) for Scotland using name, sex, date of birth, and last known address.
Data (1) Baseline
At baseline, information was collated on clinical presentation and basic sociodemographic characteristics, and assessments were completed with cases on a range of putative
biological, psychological and social risk factors (Morgan et al., 2006). Baseline ICD-10 and DSM-IV diagnoses were determined, using data collected with the Schedules for Clinical Assessment in Neuropsychiatry (SCAN) (WHO, 1992), on the basis of consensus meetings involving one of the principal investigators and other members of the research team.
Data (2) Follow-up
(1) Clinical Course and Outcome—At follow-up, extensive information was collated across three course and outcome domains (clinical, social, and service use) from clinical records and, where possible, from follow-up interviews with cases and treating clinicians using an extended version of the WHO Life Chart (Sartorius et al., 1996; also Burns et al., 1999, Harrison et al., 2001). The extended version adapted the original Life Chart to include more items on substance use, medication, and service contacts and to include a timeline (following Wiersma et al., 1998) to document, month by month where possible, presence of psychotic symptoms and contacts with mental health services. In interviews with cases we used significant anchor dates to orientate subjects and assist recall and, as appropriate, interviews were structured around key events, such as hospital admissions. Using all available information, researchers painstakingly reconstructed case histories over the follow-up period. The primary course and outcome parameters and variables derived from the Life Chart are detailed in Supplementary Table 2.
In addition, information on current symptoms at follow-up (i.e., preceding month) was collected using the SCAN (WHO, 1992).
(2) Remission—In line with Andreasen et al. (2005), we defined remission as absence of overt psychotic symptoms (operationalised as a score of 2 or 3 on Rating Scale 2 in the SCAN; 0 = absence, 1 = symptom occurred, but fleeting, 2 = symptom definitely present, 3 = symptom present more or less continuously) for a period of at least 6 months. We defined symptom recovery as sustained remission for 2 or more years.
(3) Consensus Ratings and Diagnosis—We adopted a consensus approach to Life Chart clinical ratings and lifetime diagnoses. At weekly meetings involving principal investigators, researchers presented detailed summaries of the clinical symptomatology and
Europe PMC Funders Author Manuscripts
course and outcome for each case based on information collated from clinical records and interviews with cases and other informants. These formed the bases for consensus ratings of: a) variables in the Life Chart relating to the occurrence and nature of psychotic episodes and substance use during the follow-up period; and b) lifetime ICD-10 and DSM-IV diagnoses. A conservative approach was adopted such that positive ratings of, for example, presence or absence of psychotic symptoms were only made if there was definite evidence.
(4) Social—Information on sociodemographic markers of social function and integration across a number of domains (i.e. housing, employment, relationships, education and social networks) during and at follow-up was collected using the Life Chart. In this paper we present illustrative data on employment and relationship status.
(5) Mental Health Service Use—Information on the nature and types of contacts with specialist mental health services and prescription of and compliance with anti-psychotic medication throughout the follow-up was collated using the Life Chart, which was expanded to include a timeline to document, month by month, contacts with services and to include more detail on each hospital admission and community contact (i.e. dates of admission or contact, mode of contact, source of referral, etc.).
Analysis
We described primary outcomes using frequencies and percentages and means or medians and standard deviations or inter quartile ranges. Comparisons by gender, baseline diagnosis (non-affective vs. affective) and study centre were made using chi-square tests, t-tests, ANOVAs and rank sum tests and, for time to first remission, using Kaplan-Meier survival curves and log rank tests, and, for number of admissions, using Poisson regression. Analyses were conducted using STATA Version 11.
RESULTS
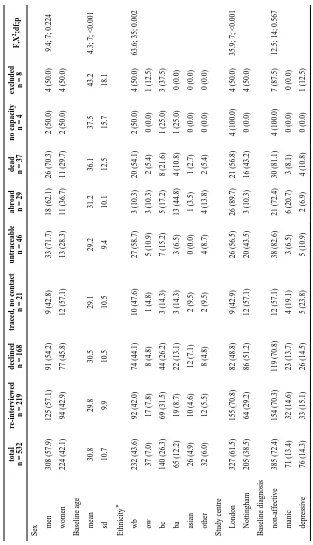
At follow-up, of the 532 incident cases initially identified, 37 (7.0%) had died: a mortality rate of 739 per 100,000 person years; standardised mortality ratio: 3.59 (2.60-4.96). Twenty-nine (5.5%) had emigrated and 8 (1.5%) were excluded on the basis of information not available at baseline. Of the 458 remaining, 412 (90.0% of 458) were successfully traced. Of these, 219 (53.2%) were re-interviewed, 4 (1.0%) lacked capacity (due to dementia or head trauma), and 189 (45.8%) could not be contacted or declined re-interview (Figure 1). Those who had died tended to be older and were more likely to be men; those who had emigrated were more likely to be of black African ethnicity and, because of this, from London; those who were not traceable were more likely to be men and have a diagnosis of a non-affective psychosis (Table 1).
Core Analytic Sample
After removing those who had died, emigrated or been excluded, useable information on clinical course and outcome across one or more of our three domains was available on 387 (84.5% of 458) cases for at least 8 years of follow-up (our core analytic sample), a combined
Europe PMC Funders Author Manuscripts
total of 4,141 years of follow-up (mean length of follow-up 10.7 years, s.d. 1.2, range 8.1-13.7).
When we compared cases with some information for 8 years or more with those without, there was no evidence of systematic differences by age, gender, ethnicity, duration of untreated psychosis, baseline employment, baseline diagnosis, mode of initial contact with mental health services, or study centre (Supplementary Table 3). There was some evidence that those on whom we did not get some information were more likely to have had an acute onset. When we considered source of information (case interview vs. no case
re-interview) among those with data for at least 8 years, the only differences were in relation to length of follow-up (slightly shorter for re-interview group) and study centre (cases in London more likely to have been re-interviewed) (Supplementary Table 4).
Long-term Course and Outcome
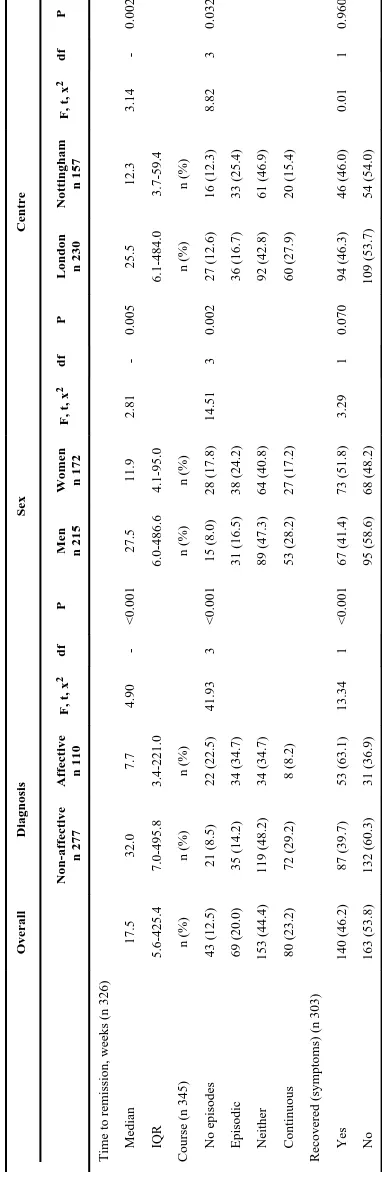
(1) Clinical—In our core sample, there was marked variability in clinical course (Table 2). Eighty cases (23% of 345, missing 42) did not experience a remission of psychotic
symptoms of six months or more at any point during the follow-up (i.e. continuous). Of these, symptoms were rated as severe in 23 (29% of 80; 7% of 345) and negative symptoms were a marked feature of the clinical picture in 37 (46% of 80; 11% of 345). At the other end of the spectrum, 43 (13% of 345) had a remission of symptoms within six months of first contact and remained symptom free for the duration of the follow-up; a further 69 (20% of 345) did have further episodes after initial remission, but none lasting more than six months (i.e., episodic). The remaining cases (153, 44% of 345) formed an intermediate group that had had at least one remission of six months or longer and at least one episode of six months or longer (i.e., neither continuous nor episodic). In total, 265 (77%) had at least one remission during the follow-up period, with a median time to first remission of 18 weeks (inter-quartile range: 6-425). At follow-up, 213 (65% of 326, missing 61) were not experiencing psychotic symptoms and 140 (46% of 303 on whom complete data were available, missing 84) had been free of psychotic symptoms for the preceding two years or more (i.e., met criteria for symptom recovery). It is notable that, among cases for whom we had reliable information (n 228; 75% of 303 with data on recovery), 56% of those who were recovered (57 of 101) had been prescribed anti-psychotic medication in the two-years prior to follow-up, compared with 86% (109 of 127) of those not recovered (χ2 24.6, df 1, p
<0.001). (Note: all cases were, at some point, prescribed anti-psychotic medication.) Across all indicators, those with an initial diagnosis of a non-affective psychosis, men and London cases were more likely to experience a worse clinical course and outcome (Table 2 and Supplementary Figure 1).
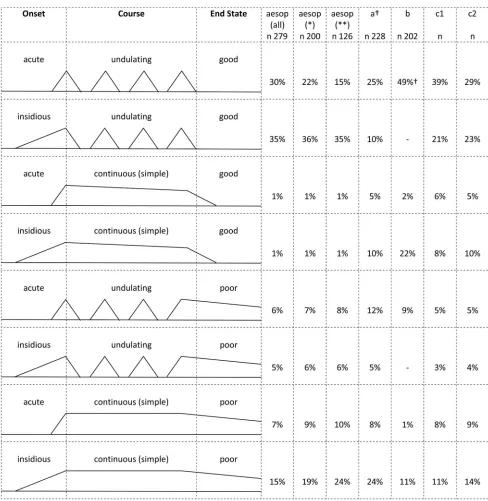
(2) Clinical Course Types—Combining data on overall course type and clinical status at follow-up (i.e., in episode or not) with information on mode of onset, we were able to categorise cases according to the course types originally specified by Bleuler (1978). Figure 2 illustrates these and presents the frequencies and percentages for our sample (by diagnosis) alongside those reported by Bleuler (1978), Ciompi (1980) and Harrison et al (2001). In all studies, an undulating course (i.e., episodic and neither continuous nor episodic) with good outcome was the most common (percentages in each study range from 35% to 65%); a
Europe PMC Funders Author Manuscripts
chronic course with poor outcome was much less common (percentages in each study range from 12% to 32%).
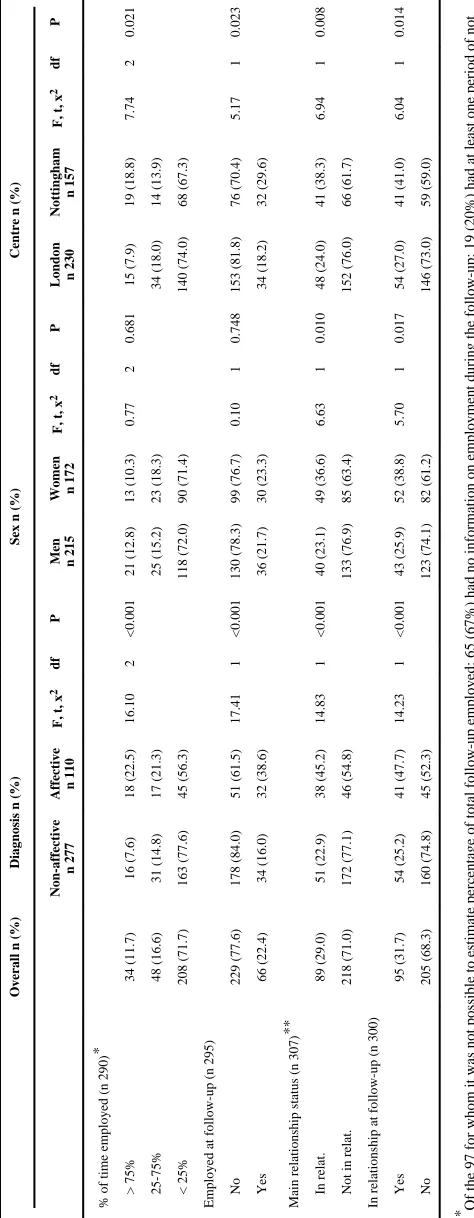
(3) Social—Using employment and relationship status as illustrative indicators of social outcomes, there was strong evidence that the marked social exclusion present among cases at baseline (e.g., 28% of cases employed vs. 55% of controls; 71% of cases not in a relationship vs. 39% of controls (Morgan et al., 2008)) persisted through the follow-up period. For example, only a small minority of cases in our core sample had been in paid work for over 75% of the follow-up period (34 of 290; 12%). A slightly larger proportion had been employed for between 25% and 75% of the follow-up (48; 17%). The
overwhelming majority, however, had been employed for less than 25% of the time (208, 72%). These low levels of employment were evident at follow-up, with only 66 (22%) being in paid work ten years after initial presentation to mental health services. The proportions of the general populations in paid employment around the time of follow-up in each of the areas from which cases were recruited were: Lambeth, south-east London: 67%; Southwark, south-east London: 62%; and Nottingham: 49% (http://www.nomisweb.co.uk/census/2011/ key_statistics). With regard to relationship status, a majority of cases were single for most of the follow-up (218, 71%) and at follow-up (205, 68%). Unfortunately, comparable data for general populations on relationship status are not available. Those with a baseline diagnosis of non-affective psychosis and London cases were more likely to experience poor outcomes in these domains (Table 3). Further, these findings suggest that social exclusion emerges before or early after onset and persists over the long-term. Of those cases in our core follow-up sample who were not employed at baseline, only 15% (34 of 223) were in employment at follow-up. Similarly, of those not in a relationship at baseline, only 16% (33 of 210) were in a relationship at follow-up.
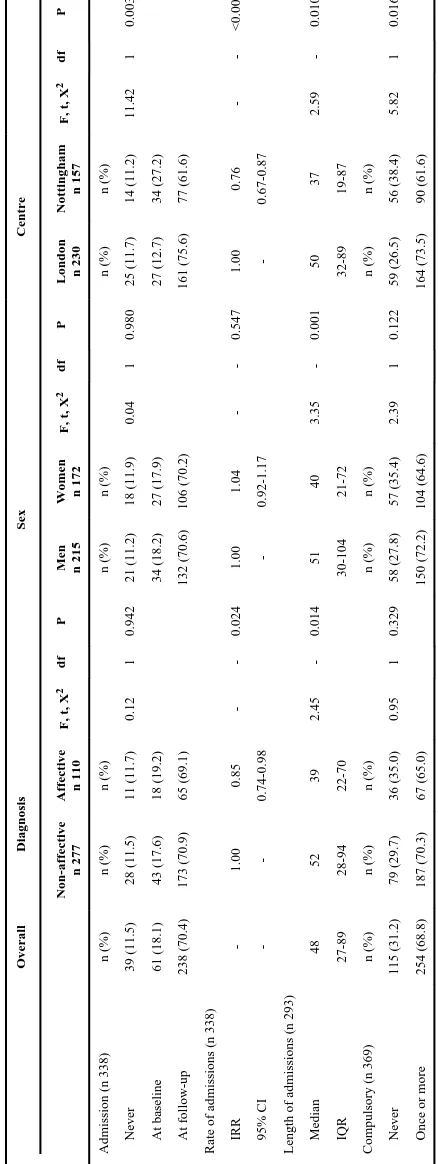
(4) Service Use: Hospital Admissions—Only 39 cases (12% of 338 on whom information was available) were never admitted to hospital at any point, 61 (18%) were admitted at initial presentation only and 238 (70%) were admitted at least once during the follow-up. Including first presentation, the median number of admissions was 2 (IQR 1-4, maximum n of admissions 20), with a small number of cases having 10 or more admissions (21, 6%). Considered differently, the admission rate was 0.31 (95% CI 0.29-0.33) per year of follow-up or approximately 1 admission every 3 years. The median length of admission was 48 days (IQR 27-89) (n in analysis 293), and the median proportion of the follow-up spent in hospital was 2.5% (IQR 0.7-8.0) or around 14 weeks over an average of 520 weeks (10 years) of follow-up (n in analysis 327). The rate and length of admission tended to be less for those with an affective disorder and for those in Nottingham; the length, but not rate, of admission tended to be less for women (Table 4). Further, 254 (69%) were compulsorily admitted to hospital either at first presentation or at some point during the follow-up (n in analysis 369), with compulsory admissions being more common in London (Table 4).
Discussion
Our follow-up provides novel data on the long-term course and outcome of all psychoses in a large unselected sample of incident cases. We found notable heterogeneity in clinical course and outcome. Only a minority of cases experienced continuous symptoms, with no
Europe PMC Funders Author Manuscripts
periods of sustained remission, and less than half of these were rated as experiencing severe or negative symptoms. In contrast, almost half had been free of clinically significant psychotic symptoms for the two years prior to follow-up. This mirrors the findings for hospital admissions: high rates and long periods of admissions for a minority and low rates and relatively short admissions for a majority. For social outcomes, the picture was reversed: poor outcomes for a majority and good (or better) outcomes for a minority. Interpretation of the proportions with good outcomes, however, should be considered alongside the high mortality rate we found in this sample (see also Saha et al. (2007).
Methodological Issues
In general, long-term follow-up studies face the twin problems of selection and information bias arising from, respectively, loss to follow-up and missing or inaccurate data.
In an attempt to minimise attrition, we were exhaustive in our efforts to trace cases and to establish deaths and emigrations. We were able to determine the whereabouts or status of over 90% of the cohort. When we compared those with some information available on course and outcome for 8 years or more with those without, there was (with the exception of mode of onset) no strong evidence of systematic bias. This does not rule out selection bias, but it does suggest attrition is unlikely to have seriously affected our findings.
Perhaps more problematic is the potential for information bias. We made use of all possible sources of information to complete the Life Chart, and clinical ratings were made by consensus after careful consideration of all available information. The extent and quality of information we had for each case, however, inevitably varied. The impact of this is difficult to assess. When we compared course and outcome variables by source of information, there was evidence that those for whom we did not have re-interview data experienced a shorter time to first remission and were less likely to have a continuous course of disorder
(Supplementary Table 5). We were very careful to only make ratings of presence or absence of symptoms on the basis of clear and definite information and it may indeed be that those who we did not re-interview did have better clinical outcomes. However, it is also possible that this apparent difference stems from uneven availability of information. Patients do not always disclose symptoms to clinicians and clinicians do not always accurately record what patients say. Consequently, it is possible that periods of remission were over-estimated for those who we were not able to re-interview. Furthermore, completeness of information was inevitably less for those we did not re-interview. This urges caution in interpreting our results. For example, we found that clinical course and outcome were better in the Nottingham sample; at the same time, cases in Nottingham were less likely to be re-interviewed. Not only this, across all cases in our core analytic sample completeness of data was patchy, due to incomplete case records and limited recall over what was, on average, a ten-year period.
Long-term Course and Outcome of Psychoses
As indicated from our review, there is a dearth of long-term follow-up studies of incident cases of all psychoses, and differences in both study methods and location mean
comparisons must be tentative.
Europe PMC Funders Author Manuscripts
This noted, within the context of marked heterogeneity in clinical course and outcome, our estimate that around 23% of all cases (rising to around 30% for non-affective psychoses) experienced a continuous course is notably lower than that found in the WHO International Study of Schizophrenia (ISoS) (i.e., 33% for all psychoses at 15 years), the only other follow-up of an incidence cohort of all psychoses that reports on overall course that we are aware of (Harrison et al., 2001). In a more direct comparison, our estimate of the proportion with a continuous course for Nottingham (15%) is also lower than for the Nottingham centre in the ISoS (24%) (Harrison and Mason, 2007). As noted, the lower rate of re-interview in Nottingham may bias estimates toward good outcome in our Nottingham sample, but this has to be set against the overall tendency for those with an acute onset (and therefore possibly better outcomes) to be lost to follow-up. We will further examine site differences in future publications.
Considered the other way around, 12% (9% for non-affective) of our sample recovered within 6 months of contact with services and did not have a further episode, 20% (14% for non-affective) never had an episode lasting more than 6 months, and around 50% (40% for non-affective) had not experienced symptoms in the 2 years prior to follow-up. Because of differences in the assessment of course and recovery in previous studies, direct comparisons are difficult. For example, only two first-episode studies from Europe have reported on the proportion who, following remission of first-episode, remained symptom free; the reported proportions were in line with ours (7%, Moller et al., 2010; 12%, Wiersma et al., 1998). In the studies we reviewed, estimates of proportions recovered, variously defined, ranged from 20% (Ciompi, 1980) to 61% (Harrison and Mason, 2007), the higher estimates being from studies of incident cases of all psychoses (e.g., Harrison et al., 2001) and from studies that defined recovery cross-sectionally (i.e., did not require absence of symptoms for 2 or more years) (Thara et al., 1994). This noted, our finding that around 40% of those with a non-affective disorder were symptomatically recovered is very similar to what Robinson et al. (2004) found over a five year follow-up period in their study of 118 first-episode
schizophrenia cases (47%) initially recruited to a study of the application of a medication algorithm in clinical practice. This is striking and together with our findings suggests that roughly half of those who develop a psychosis will eventually recover symptomatically, suggesting much previous outcome research in schizophrenia and psychosis has provided overly pessimistic views of clinical course and outcome. In so far as diagnosis should provide information about prognosis, non-affective disorders do generally follow less favourable trajectories than affective disorders (Harrow et al., 2005); but there is still considerable variability within these diagnostic groups.
Perhaps unsurprisingly, our findings on hospital admissions mirror those on clinical course and outcome, i.e. a high number of admissions and long in-patient stays for a minority and infrequent and relatively short admissions for most. There are very little comparable data in previous studies. White et al. (2009) did find a similar polarisation of service use, with most of their sample over a ten-year period having a small number of admissions and a minority (18%) having more than 10. We found that only 6% of our sample had more than 10 admissions.
Europe PMC Funders Author Manuscripts
In contrast, using employment and relationship status as markers, social outcomes were poor for a majority of cases. At follow-up, only 22% were employed (compared with between 49% and 67% in the areas from which cases were originally recruited). This is broadly in line with previous studies. White et al. (2009), for example, found that 48% of their sample of 109 first admission cases followed at ten-years had never worked and only 19% were employed at follow-up. In their ten-year follow-up of participants in the TIPS trial of early detection, Hegelstad et al. (2012) found that only 11% of the detection as usual group and 28% of the early detection group were in full-time employment. Of course, comparing across contexts is problematic because employment levels are affected by local socio-economic factors. Nonetheless, other studies that have used different measures and markers similarly suggest generally poor social outcomes (Supplementary Table 1). Perhaps most notably, our findings suggest poor social outcomes reflect a persistence of social exclusion evident at first presentation, with only small proportions of those out of work (or single) moving into employment (or a relationship) by the 10 year end point (around 15%).
Conclusion
In the analyses presented in this paper, we purposefully considered clinical and social markers of course and outcome separately. In doing so, a discrepancy was evident: symptom remission and recovery is more common than social (re)integration following a first-episode of psychosis. This points to a significant challenge for mental health services: improving social outcomes. It does so, however, without obscuring the finding that sustained symptom remission is possible for many with a psychotic disorder – a positive finding that goes against the still common view that non-affective psychotic disorders, especially schizophrenia, are chronic and deteriorating. This finding has important clinical
implications; several recent reports have pointed out that psychiatrists who hold an overly pessimistic view of the outcome of psychosis can transmit this view to their patients, thereby rendering it a self-fulfilling prophecy (UK Schizophrenia Commission
<www.schizophreniacommission.org.uk>; Zipursky et al., 2013). The focus of forthcoming analyses of ÆSOP-10 data will be to identify tractable predictors of both clinical and social outcomes that can be targeted to improve long-term trajectories of psychoses.
Supplementary Material
Refer to Web version on PubMed Central for supplementary material.
Acknowledgments
Funding: This work was supported by UK Medical Research Council (Ref: G0500817) and the Department of
Health via the National Institute for Health Research (NIHR) Specialist Biomedical Research Centre for Mental Health award to South London and Maudsley NHS Foundation Trust (SLaM) and the Institute of Psychiatry at King’s College London. Robin Murray: honoraria received from Janssen, Astra-Zeneca, Lilly, BMS and Roche. Robin Murray is an editor of Psychological Medicine.
References
Andreasen NC, Carpenter WT Jr. Kane JM, Lasser RA, Marder SR, Weinberger DR. Remission in schizophrenia: proposed criteria and rationale for consensus. American Journal of Psychiatry. 2005; 162:441–9. [PubMed: 15741458]
Europe PMC Funders Author Manuscripts
Bleuler, M. The Schizophrenia Disorders: Long-Term Patient and Family Studies. Yale University Press; New Haven and London: 1978.
Burns T, Creed F, Fahy T, Thompson S, Tyrer P, White I, UK 700 Group. Intensive versus standard case management for severe psychotic illness: a randomised trial. Lancet. 1999; 353:2185–9. [PubMed: 10392982]
Ciompi L. Catamnestic long-term study on the course of life and aging of schizophrenics. Schizophrenia Bulletin. 1980; 6:606–18. [PubMed: 7444392]
Cohen P, Cohen J. The clinician’s illusion. Archives of General Psychiatry. 1984; 41:1178–82. [PubMed: 6334503]
Craig TK, Garety P, Power P, Rahaman N, Colbert S, Fornells-Ambrojo M, Dunn G. The Lambeth Early Onset (LEO) Team: randomised controlled trial of the effectiveness of specialised care for early psychosis. British Medical Journal. 2004; 329:1067. [PubMed: 15485934]
Crumlish N, Whitty P, Clarke M, Browne S, Kamali M, Gervin M, McTigue O, Kinsella A, Waddington JL, Larkin C, O’Callaghan E. Beyond the critical period: longitudinal study of 8-year outcome in first-episode non-affective psychosis. British Journal of Psychiatry. 2009; 194:18–24. [PubMed: 19118320]
Gafoor R, Nitsch D, McCrone P, Craig TKJ, Garety PA, Power P, McGuire P. Effect of early intervention on 5-year outcome in non-affective psychosis. British Journal of Psychiatry. 2010; 196:372–376. [PubMed: 20435962]
Harris MG, Henry LP, Harrigan SM, Purcell R, Schwartz OS, Farrelly SE, Prosser AL, Jackson HJ, McGorry PD. The relationship between duration of untreated psychosis and outcome: an eight-year prospective study. Schizophrenia Research. 2005; 79:85–93. [PubMed: 16005612]
Harrison G, Hopper K, Craig T, Laska E, Siegel C, Wanderling J, Dube KC, Ganev K, Giel R, an der Heiden W, Holmberg SK, Janca A, Lee PW, Leon CA, Malhotra S, Marsella AJ, Nakane Y, Sartorius N, Shen Y, Skoda C, Thara R, Tsirkin SJ, Varma VK, Walsh D, Wiersma D. Recovery from psychotic illness: a 15- and 25-year international follow-up study. British Journal of Psychiatry. 2001; 178:506–17. [PubMed: 11388966]
Harrison, G.; Mason, P. Nottingham, UK. In: Hopper, K.; Harrison, G.; Janca, A.; Sartorius, N., editors. Recovery from Schizophrenia: An International Perspective. Oxford University Press; Oxford: 2007. p. 177-188.
Harrow M, Grossman LS, Jobe TH, Herbener ES. Do patients with schizophrenia ever show periods of recovery? A 15-year multi-follow-up study. Schizophrenia Bulletin. 2005; 31:723–34. [PubMed: 16020553]
Hegarty JD, Baldessarini RJ, Tohen M, Waternaux C, Oepen G. One hundred years of schizophrenia: a meta-analysis of the outcome literature. American Journal of Psychiatry. 1994; 151:1409–16. [PubMed: 8092334]
Hegelstad, W. t. V.; Larsen, TK.; Auestad, B.; Evensen, J.; Haahr, U.; Joa, I.; Johannesen, JO.; Langeveld, J.; Melle, I.; Opjordsmoen, S.; Rossberg, JI.; Rund, BR.; Simonsen, E.; Sundet, K.; Vaglum, P.; Friis, S.; McGlashan, T. Long-Term Follow-Up of the TIPS Early Detection in Psychosis Study: Effects on 10-Year Outcome. American Journal of Psychiatry. 2012; 169:374– 380. [PubMed: 22407080]
Hill M, Crumlish N, Clarke M, Whitty P, Owens E, Renwick L, Browne S, Macklin EA, Kinsella A, Larkin C, Waddington JL, O’Callaghan E. Prospective relationship of duration of untreated psychosis to psychopathology and functional outcome over 12 years. Schizophrenia Research. 2012; 141:215–21. [PubMed: 23006501]
Jaaskelainen E, Miettunen J, Veijola J, McGrath JJ, Murray GK, Jones PB, Isohanni M. Associations between early development and outcome in schizophrenia - A 35-year follow-up of the Northern Finland 1966 Birth Cohort. Schizophrenia Research. 2008; 99:29–37. [PubMed: 18180143] Kirkbride J, Fearon P, Morgan C, Dazzan P, Morgan K, Tarrant J, Lloyd T, Holloway J, Hutchinson
G, Leff J, Mallett R, Harrison G, Murray R, Jones P. Heterogeneity in incidence rates of schizophrenia and other psychotic syndromes: Findings from the 3-center ÆSOP study. Archives of General Psychiatry. 2006; 63:250–258. [PubMed: 16520429]
Kurihara T, Kato M, Reverger R, Tirta IG. Seventeen-year clinical outcome of schizophrenia in Bali. European Psychiatry. 2011; 26:333–8. [PubMed: 21696927]
Europe PMC Funders Author Manuscripts
Larsen TK, Melle I, Auestad B, Friis S, Haahr U, Johannessen JO, Opjordsmoen S, Rund BR, Simonsen E, Vaglum P, McGlashan T. Early detection of first-episode psychosis: The effect on 1-year outcome. Schizophrenia Bulletin. 2006; 32:758–764. [PubMed: 16809640]
Larsen TK, Melle I, Auestad B, Haahr U, Joa I, Johannessen JO, Opjordsmoen S, Rund BR, Rossberg JI, Simonsen E, Vaglum P, Friis S, McGlashan T. Early detection of psychosis: positive effects on 5-year outcome. Psychological Medicine. 2011; 41:1461–1469. [PubMed: 20942996]
Malla A, Norman R, Bechard-Evans L, Schmitz N, Manchanda R, Cassidy C. Factors influencing relapse during a 2-year follow-up of first-episode psychosis in a specialized early intervention service. Psychological Medicine. 2008; 38:1585–1593. [PubMed: 18205969]
Menezes NM, Arenovich T, Zipursky RB. A systematic review of longitudinal outcome studies of first-episode psychosis. Psychological Medicine. 2006; 36:1349–1362. [PubMed: 16756689] Modestin J, Huber A, Satirli E, Malti T, Hell D. Long-term course of schizophrenic illness: Bleuler’s
study reconsidered. American Journal of Psychiatry. 2003; 160:2202–8. [PubMed: 14638591] Moller HJ, Jager M, Riedel M, Obermeier M, Strauss A, Bottlender R. The Munich 15-year follow-up
study (MUFUSSAD) on first-hospitalized patients with schizophrenic or affective disorders: comparison of psychopathological and psychosocial course and outcome and prediction of chronicity. European Arcivhives of Psychiatry and Clinical Neuroscience. 2010; 260:367–84. Moller HJ, Jager M, Riedel M, Obermeier M, Strauss A, Bottlender R. The Munich 15-year follow-up
study (MUFUSSAD) on first-hospitalized patients with schizophrenic or affective disorders: assessing courses, types and time stability of diagnostic classification. European Psychiatry. 2011; 26:231–43. [PubMed: 20621452]
Morgan C, Dazzan P, Morgan K, Jones P, Harrison G, Leff J, Murray R, Fearon P. First episode psychosis and ethnicity: initial findings from the ÆSOP study. World Psychiatry. 2006; 5:40–6. [PubMed: 16757995]
Nordentoft M, Ohlenschlaeger J, Thorup A, Petersen L, Jeppesen P, Bertelsen M.
Deinstitutionalization revisited: a 5-year follow-up of a randomized clinical trial of hospital-based rehabilitation versus specialized assertive intervention (OPUS) versus standard treatment for patients with first-episode schizophrenia spectrum disorders. Psychological Medicine. 2010; 40:1619–1626. [PubMed: 20059798]
Norman RM, Manchanda R, Windell D, Harricharan R, Northcott S, Hassall L. The role of treatment delay in predicting 5-year outcomes in an early intervention program. Psychological Medicine. 2012; 42:223–233. [PubMed: 21767442]
Robinson DG, Woerner MG, McMeniman M, Mendelowitz A, Bilder RM. Symptomatic and functional recovery from a first episode of schizophrenia or schizoaffective disorder. American Journal of Psychiatry. 2004; 161:473–9. [PubMed: 14992973]
Saha S, Chant D, McGrath J. A systematic review of mortality in schizophrenia: is the differential mortality gap widening over time? Archives of General Psychiatry. 2007; 64:1123–1131. [PubMed: 17909124]
Sartorius N, Gulbinat W, Harrison G, Laska E, Siegel C. Long-term follow-up of schizophrenia in 16 countries. A description of the International Study of Schizophrenia conducted by the World Health Organization. Social Psychiatry and Psychiatric Epidemiology. 1996; 31:249–58. [PubMed: 8909114]
Thara R, Henrietta M, Joseph A, Rajkumar S, Eaton WW. Ten-year course of schizophrenia--the Madras longitudinal study. Acta Psychiatrica Scandinavica. 1994; 90:329–36. [PubMed: 7872036] van Os J, Wright P, Murray R. Follow-up studies of schizophrenia I: Natural history and
non-psychopathological predictors of outcome. European Psychiatry. 1997; 12(Suppl 5):327s–41s. [PubMed: 19698588]
White C, Stirling J, Hopkins R, Morris J, Montague L, Tantam D, Lewis S. Predictors of 10-year outcome of first-episode psychosis. Psychological Medicine. 2009; 39:1447–1456. [PubMed: 19187566]
WHO. Schedules for Clinical Assessment in Neuropsychiatry. World Health Organisation; Geneva: 1992.
Europe PMC Funders Author Manuscripts
Wiersma D, Nienhuis FJ, Slooff CJ, Giel R. Natural course of schizophrenic disorders: a 15-year followup of a Dutch incidence cohort. Schizophrenia Bulletin. 1998; 24:75–85. [PubMed: 9502547]
Zipursky RB, Reilly TJ, Murrat RM. The myth of schizophrenia as a progressive brain disease. Schizophrenia Bulletin. 2013; 39:1363–1372. [PubMed: 23172002]
Europe PMC Funders Author Manuscripts
Figure 1. Flow chart documenting how cases were traced and administrative outcomes.
* ONS, Office of National Statistics for England and Wales; GRO, General Register Office for Scotland
Europe PMC Funders Author Manuscripts
Figure 2. Frequency of course types, schematised following (a) Bleuler, (b) Ciompi, and (c) Harrison et al.
* non-affective psychoses only; ** schizophrenia only a (Bleuler, 1978) (schizophrenia)
b (Ciompi, 1980) (schizophrenia) c1 (Harrison et al., 2001) (all psychoses) c2 (Harrison et al., 2001) (schizophrenia)
† Modestin et al (Modestin et al., 2003) re-evaluated cases in Bleuler’s study, using operationalised criteria based on current standards and DSM-IV and ICD-10 criteria, and
Europe PMC Funders Author Manuscripts
found that the proportions of cases with undulating and continuous courses did not vary much from those reported by Bleuler (e.g., 58% with undulating course in original study vs. 48-49% in re-evaluation).
Europe PMC Funders Author Manuscripts
Europe PMC Funders Author Manuscripts
[image:17.612.92.405.137.682.2]Europe PMC Funders Author Manuscripts
Table 1
Baseline demographic characteristics and diagnosis by administrative outcome.
total
n = 532
re-interviewed
n = 219
declined n = 168
traced, no contact
n = 21
untraceable
n = 46
abroad n = 29 dead n = 37
no capacity
n = 4
excluded n = 8
F,X 2;df;p Sex men 308 (57.9) 125 (57.1) 91 (54.2) 9 (42.8) 33 (71.7) 18 (62.1) 26 (70.3) 2 (50.0) 4 (50.0)
9.4; 7; 0.224
women 224 (42.1) 94 (42.9) 77 (45.8) 12 (57.1) 13 (28.3) 11 (36.7) 11 (29.7) 2 (50.0) 4 (50.0) Baseline age mean 30.8 29.8 30.5 29.1 29.2 31.2 36.1 37.5 43.2
4.3; 7; <0.001
sd 10.7 9.9 10.5 10.5 9.4 10.1 12.5 15.7 18.1 Ethnicity * wb 232 (43.6) 92 (42.0) 74 (44.1) 10 (47.6) 27 (58.7) 3 (10.3) 20 (54.1) 2 (50.0) 4 (50.0)
63.6; 35; 0.002
ow 37 (7.0) 17 (7.8) 8 (4.8) 1 (4.8) 5 (10.9) 3 (10.3) 2 (5.4) 0 (0.0) 1 (12.5) bc 140 (26.3) 69 (31.5) 44 (26.2) 3 (14.3) 7 (15.2) 5 (17.2) 8 (21.6) 1 (25.0) 3 (37.5) ba 65 (12.2) 19 (8.7) 22 (13.1) 3 (14.3) 3 (6.5) 13 (44.8) 4 (10.8) 1 (25.0) 0 (0.0) asian 26 (4.9) 10 (4.6) 12 (7.1) 2 (9.5) 0 (0.0) 1 (3.5) 1 (2.7) 0 (0.0) 0 (0.0) other 32 (6.0) 12 (5.5) 8 (4.8) 2 (9.5) 4 (8.7) 4 (13.8) 2 (5.4) 0 (0.0) 0 (0.0) Study centre London 327 (61.5) 155 (70.8) 82 (48.8) 9 (42.9) 26 (56.5) 26 (89.7) 21 (56.8) 4 (100.0) 4 (50.0)
35.9; 7; <0.001
Nottingham 205 (38.5) 64 (29.2) 86 (51.2) 12 (57.1) 20 (43.5) 3 (10.3) 16 (43.2) 0 (0.0) 4 (50.0) Baseline diagnosis non-affective 385 (72.4) 154 (70.3) 119 (70.8) 12 (57.1) 38 (82.6) 21 (72.4) 30 (81.1) 4 (100.0) 7 (87.5)
12.5; 14; 0.567
manic 71 (13.4) 32 (14.6) 23 (13.7) 4 (19.1) 3 (6.5) 6 (20.7) 3 (8.1) 0 (0.0) 0 (0.0) depressive 76 (14.3) 33 (15.1) 26 (14.5) 5 (23.8) 5 (10.9) 2 (6.9) 4 (10.8) 0 (0.0) 1 (12.5)
Europe PMC Funders Author Manuscripts
[image:18.612.93.284.92.682.2]Europe PMC Funders Author Manuscripts
Table 2
Clinical course and outcome.
Overall Diagnosis Sex Centre Non-affective n 277
Affective n 110
F, t, x
2
df
P
Men n 215 Women n 172
F, t, x
2
df
P
London n 230
Nottingham
n 157
F, t, x
2
df
P
Time to remission, weeks (n 326)
Median 17.5 32.0 7.7 4.90 -<0.001 27.5 11.9 2.81 -0.005 25.5 12.3 3.14 -0.002 IQR 5.6-425.4 7.0-495.8 3.4-221.0 6.0-486.6 4.1-95.0 6.1-484.0 3.7-59.4
Course (n 345)
n (%) n (%) n (%) n (%) n (%) n (%) n (%) No episodes 43 (12.5) 21 (8.5) 22 (22.5) 41.93 3 <0.001 15 (8.0) 28 (17.8) 14.51 3 0.002 27 (12.6) 16 (12.3) 8.82 3 0.032 Episodic 69 (20.0) 35 (14.2) 34 (34.7) 31 (16.5) 38 (24.2) 36 (16.7) 33 (25.4) Neither 153 (44.4) 119 (48.2) 34 (34.7) 89 (47.3) 64 (40.8) 92 (42.8) 61 (46.9) Continuous 80 (23.2) 72 (29.2) 8 (8.2) 53 (28.2) 27 (17.2) 60 (27.9) 20 (15.4)
Recovered (symptoms) (n 303)
Europe PMC Funders Author Manuscripts
[image:19.612.96.333.69.678.2]Europe PMC Funders Author Manuscripts
Table 3
Markers of social course and outcome.
Overall n (%)
Diagnosis n (%)
Sex n (%)
Centre n (%)
Non-affective
n 277
Affective n 110
F, t, x
2
df
P
Men n 215 Women n 172
F, t, x
2
df
P
London n 230
Nottingham
n 157
F, t, x
2
df
P
% of time employed (n 290)
* > 75% 34 (11.7) 16 (7.6) 18 (22.5) 16.10 2 <0.001 21 (12.8) 13 (10.3) 0.77 2 0.681 15 (7.9) 19 (18.8) 7.74 2 0.021 25-75% 48 (16.6) 31 (14.8) 17 (21.3) 25 (15.2) 23 (18.3) 34 (18.0) 14 (13.9) < 25% 208 (71.7) 163 (77.6) 45 (56.3) 118 (72.0) 90 (71.4) 140 (74.0) 68 (67.3)
Employed at follow-up (n 295)
No 229 (77.6) 178 (84.0) 51 (61.5) 17.41 1 <0.001 130 (78.3) 99 (76.7) 0.10 1 0.748 153 (81.8) 76 (70.4) 5.17 1 0.023 Yes 66 (22.4) 34 (16.0) 32 (38.6) 36 (21.7) 30 (23.3) 34 (18.2) 32 (29.6)
Main relationship status (n 307)
** In relat. 89 (29.0) 51 (22.9) 38 (45.2) 14.83 1 <0.001 40 (23.1) 49 (36.6) 6.63 1 0.010 48 (24.0) 41 (38.3) 6.94 1 0.008
Not in relat.
218 (71.0) 172 (77.1) 46 (54.8) 133 (76.9) 85 (63.4) 152 (76.0) 66 (61.7)
In relationship at follow-up (n 300)
Yes 95 (31.7) 54 (25.2) 41 (47.7) 14.23 1 <0.001 43 (25.9) 52 (38.8) 5.70 1 0.017 54 (27.0) 41 (41.0) 6.04 1 0.014 No 205 (68.3) 160 (74.8) 45 (52.3) 123 (74.1) 82 (61.2) 146 (73.0) 59 (59.0)
* Of the 97 for whom it was not possible to estimate percentage of total follow-up employed: 65 (67%) had no information on employment during the follow-up; 19 (20%) had at least one period of not being employed; 12 (12%) had at least one period of being employed; and 1 (1%) had at least one period of not being employed and one period of being employed **
Of the 80 for whom it was not possible to determine main relationship status during the follow-up: 63 (79%) had no information on relationship status during the follow-up; 7 (9%) had been in a
Europe PMC Funders Author Manuscripts
[image:20.612.93.312.96.678.2]Europe PMC Funders Author Manuscripts
Table 4 Hospital admissions. Overall Diagnosis Sex Centre Non-affective n 277
Affective n 110
F, t, X
2
df
P
Men n 215 Women n 172
F, t, X
2
df
P
London n 230
Nottingham
n 157
F, t, X
2
df
P
Admission (n 338)
n (%) n (%) n (%) n (%) n (%) n (%) n (%) Never 39 (11.5) 28 (11.5) 11 (11.7) 0.12 1 0.942 21 (11.2) 18 (11.9) 0.04 1 0.980 25 (11.7) 14 (11.2) 11.42 1 0.003 At baseline 61 (18.1) 43 (17.6) 18 (19.2) 34 (18.2) 27 (17.9) 27 (12.7) 34 (27.2) At follow-up 238 (70.4) 173 (70.9) 65 (69.1) 132 (70.6) 106 (70.2) 161 (75.6) 77 (61.6)
Rate of admissions (n 338)
IRR -1.00 0.85 -0.024 1.00 1.04 -0.547 1.00 0.76 -<0.001 95% CI -0.74-0.98 -0.92-1.17 -0.67-0.87
Length of admissions (n 293)
Median 48 52 39 2.45 -0.014 51 40 3.35 -0.001 50 37 2.59 -0.010 IQR 27-89 28-94 22-70 30-104 21-72 32-89 19-87
Compulsory (n 369)
n (%) n (%) n (%) n (%) n (%) n (%) n (%) Never 115 (31.2) 79 (29.7) 36 (35.0) 0.95 1 0.329 58 (27.8) 57 (35.4) 2.39 1 0.122 59 (26.5) 56 (38.4) 5.82 1 0.016
Once or more