Reappraisal of soil extrusion for
geomechanical characterisation
Brendan C. O’KellyPhD, FTCD, CEng, CEnv, MICEAssociate Professor, Department of Civil, Structural and Environmental Engineering, Trinity College Dublin, Dublin, Ireland (bokelly@tcd.ie) (Orcid:0000-0002-1343-4428)
Reverse extrusion has been promoted over the past four decades for remoulded undrained shear strength (su) measurement and consistency-limit determinations. The technique employs a uniaxial-compression test machine to set the die travelling against the confined soil specimen (billet) at a constant displacement rate (v), with the soil extruded through the die orifice under a steady-state extrusion pressure (pe). This paper presents thefirst comprehensive literature review of this topic, including a reassessment of extensive data sets presented for many hundreds of fine-grained soils covering an extremely wide plasticity range. Specifically, the paper critically examines (a) the soil billet’s assumed undrained condition and hence the constancy of thepe/su ratio value, which is central to su determinations using this approach; (b) the dependence of the steady-statepevalue on both the billet’s area reduction ratio (R) andv; (c) the role of soil remoulding toughness; and (d) the pitfalls of various data analysis and interpolation techniques employed. The author concludes that, depending on mineralogy and gradation, localised billet consolidation may occur for the slow displacement rates employed and high pevalues required, particularly for stiffer soils, such that the present extrusion approach is generally not recommended forsumeasurement or Atterberg-limit determinations.
Notation
Af die orifice area
Ao bore cross-sectional area of the extrusion chamber
a,a0 regression coefficients for semi- and bi-logarithmic correlations, respectively
b,b0 regression exponents for semi- and bi-logarithmic correlations, respectively
c extrusion coefficient
Df die orifice diameter
Do bore diameter of the extrusion chamber
d,d0 extrusion coefficients
F applied force
Fe force causing extrusion
IL liquidity index
IP plasticity index
IRE new consistency index parameter
KRE reverse-extrusion factor
k shear yield stress
L initial billet length
n number of experimental measurements (data points) PL25 water content forsuvalue 25 times greater than that
mobilised at the fall-cone liquid limit
pe extrusion pressure
pe(LL) steady-state extrusion pressure for the liquid limit
pe(PL) steady-state extrusion pressure for the plastic limit water content
pe(SL) steady-state extrusion pressure for the shrinkage limit water content
R extrusion ratio
R2 coefficient of determination
RE25 water content corresponding to the steady-state extrusion pressure value of 25 ×pe(LL)
re extrusion rate
su saturated remoulded undrained shear strength
su(LL) saturated remoulded undrained shear strength at the liquid limit
su(PL) saturated remoulded undrained shear strength at the plastic limit
T remoulding toughness
Tmax maximum remoulding toughness
t elapsed time
v die displacement rate
w water content
wL water content at the liquid limit
wL(cup) water content at the Casagrande liquid limit
wL(FC) water content at the fall-cone liquid limit
wn natural water content of undisturbed test specimens
wP water content at the standard plastic limit
wS water content at the shrinkage limit
wST water content at the stiffness transition
wT water content at the toughness limit
Soil extrusion fundamentals and experimental
approaches
Extrusion as a mechanical process involves the reduction of a billet’s cross-sectional area by forcing it to flow through a die orifice under pressure. The concept of extrusion has been applied to soil for brick manufacturing since the mid-nineteenth century (Whyte, 1982) and more recently for the rheological characterisation of various materials, such as food and ceramics (Cheyne et al., 2005; Göhlert and Uebel, 2009). The extrusion technique was first introduced for soil characterisation by Timár (1974) and subsequently promoted for determinations of undrained shear strength (Kayabali, 2011a; Kayabali and Ozdemir, 2013; Kayabali and Tufenkci, 2010a; Kayabali et al., 2015a, 2015b; Whyte, 1982) and Atterberg limits (Kayabali, 2011a, 2011b, 2012, 2013; Kayabali and Tufenkci, 2007, 2010a, 2010b; Kayabali et al., 2015c, 2016; Medhat and Whyte, 1986; Verástegui-Flores and Di Emidio, 2014, 2015). Extrusion has also been employed for three-dimensional clay printing, which allows the construction of physical heterogeneous models (Pua et al., 2018), as well as its promotion for possible effective-stress shear strength parameter determinations (Kayabaliet al., 2015d).
Timár (1974) employed the direct-extrusion (DE) approach, whereby the soil test specimen (billet) is forced along a
cylindrical chamber and extruded through a contoured orifice (Figure 1(a)). The materialflowing through the orifice has a round bar shape, with a cross-section identical to that of the orifice. However, the method of data interpretation is complicated for DE due to the influence of the frictional resistance generated as the billet is forced along the chamber length to the die, with the value of the pressure causing extrusion (pe: Equation 1) progressively reducing for the shortening billet (Figure 1(b)).
p
e¼
F
eA
o1.
where Fe is the applied compressive force causing extrusion to occur and Ao is the extrusion chamber’s bore cross-sectional area.
Hence, investigations of soil extrusion after that of Timár (1974) generally adopted the indirect- or reverse-extrusion (RE) approach (Figure 2(a)). For this set-up, the billet is rigidly contained while the die advances towards it at a certain velocity, such that compared with the DE approach, the required value of pe is significantly lower and attains a steady-state condition for the RE
Cylindrical chamber Ram
Fe pe
Billet
Die
Soil worm
(a)
Ram travel
Extrusion pressure
Billet compression zone
Extrusion Short billetL/D o < 0·7
[image:2.595.227.531.444.751.2](b)
Figure 1.DE: (a) schematic diagram of the experimental set-up;
(b) characteristic extrusion pressure plotted against ram
displacement trace (adopted from Kayabali and Tufenkci (2010a))
‘Dead‘ material zone
Soil worm C
B
B A
Fe/2
Fe/2
F
(a)
Die travel
Extrusion pr
essur
e
Compression Extrusion Short billet
Steady-state pe
(b)
Figure 2.RE: (a) schematic diagram of the experimental set-up;
(b) characteristic extrusion pressure plotted against die
[image:2.595.41.293.455.750.2]approach –that is, since no relative motion occurs between the billet and chamber wall for RE (resulting in much lower mobilisation of interface frictional resistance overall), the value of peremains approximately steady with increasing die displacement after the initial billet compression phase (Figure 2(b)). To maintain this steady-state condition, the soil billet must have a sufficient length, with an initial billet length of 1Do to 1·5Do typically employed, where Do is the bore diameter of the extrusion chamber. The soil material yields when it enters the shear zone (fan), located in front of the ‘dead’ material zone localised between the chamber wall and die face. The initial approximately linear increasing portion of the extrusion pressure against die displacement plot signifies the work required in compressing the placed soil billet to reduce its air void content to practically zero. A small clearance (gap) between the die rim and chamber wall prevents metal friction between them, and the die orifice is also usually chamfered (e.g. see the die orifice shown in Figure 2(a)), so as to reduce the contact friction produced between the die and extruding soil worm to negligible levels.
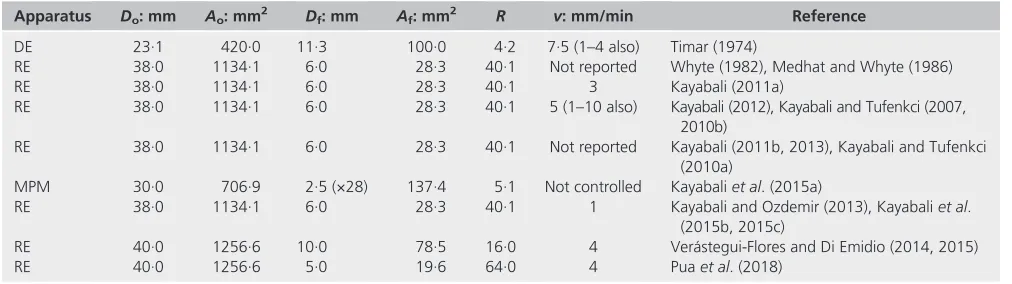
Some principal physical dimensions of existing soil-extrusion apparatus and associated displacement rate (v) values employed, as reported in the literature, are summarised in Table 1. A 6·0 mm dia. orifice was used in the investigations by Whyte (1982) and subsequently in the many investigations by Kayabali and co-workers, since a standard thread-rolling plastic-limit (PL) test can be quickly performed on the extruded 6 mm dia. soil worm to confirm the soil’s consistency, if necessary.
Figure 3(a) presents the RE set-up employed in the studies by Verástegui-Flores and Di Emidio (2014, 2015), which is typical of other soil RE apparatus configurations. Using a uniaxial-compression test machine to provide the desired loading condition (Figure 3(b)), the die is set to travel against the confined soil specimen at a constant displacement ratev(i.e. displacement rate controlled), generally in the range 1–5 mm/min and typical of unconfined compression testing, while the die displacement and corresponding extrusion force are both recorded.
When the soil reaches the shear (plastic) zone within the extrusion chamber (zone labelled B in Figure 2(a)), it distorts and extrudes by way of the die orifice as a soil worm, with the value of the applied compressive force (and the value ofpecomputed using Equation 1) assumed to relate to the undrained condition. As such, the soil’s resistance capacity is conventionally understood as controlled by its saturated remoulded undrained shear strength,su, the value of which is principally dependent for a given test soil on its water content (w) and to a lesser extent on the strain rate. The nature of the soil flow and redundant deformation defining the extent of the dead material zone within the soil billet are dependent on the apparatus extrusion ratio (R: Equation 2) and the die configuration (i.e. shape and geometrical layout of the die orifice(s)). Greater values ofpeare mobilised for higherRvalues since the associated energy for soil extrusion increases.
R
¼
A
o=
A
f 2.whereAoandAfare the bore cross-sectional area of the extrusion cylinder and the die orifice area, respectively.
The dependence of the extrusion pressure on extrusion ratio and die displacement rate was investigated experimentally by Verástegui-Flores and Di Emidio (2014). They performed RE testing of a kaolin material at its fall-cone (FC) liquid limit (LL) water content (wL(FC)) value, measuring the steady-state pevalue mobilised forR= 4, 16 and 64, with set values ofv= 2, 4, 6 and 8 mm/min (Figure 4). As expected, they found that greater steady-state values ofpewere mobilised for higher Rand vvalues. This dependency will be examined in greater detail later in the paper.
The extrusion rate (re: Equation 3), which is a function of the extrusion ratio, typically ranges 40–200 mm/min based on the reported RE soil testing set-ups summarised in Table 1.
r
e¼
vR
[image:3.595.56.562.637.779.2]3.
Table 1.Various apparatus configurations employed for soil-extrusion testing
Apparatus Do: mm Ao: mm2 Df: mm Af: mm2 R v: mm/min Reference
DE 23·1 420·0 11·3 100·0 4·2 7·5 (1–4 also) Timar (1974)
RE 38·0 1134·1 6·0 28·3 40·1 Not reported Whyte (1982), Medhat and Whyte (1986)
RE 38·0 1134·1 6·0 28·3 40·1 3 Kayabali (2011a)
RE 38·0 1134·1 6·0 28·3 40·1 5 (1–10 also) Kayabali (2012), Kayabali and Tufenkci (2007,
2010b)
RE 38·0 1134·1 6·0 28·3 40·1 Not reported Kayabali (2011b, 2013), Kayabali and Tufenkci
(2010a)
MPM 30·0 706·9 2·5 (×28) 137·4 5·1 Not controlled Kayabaliet al. (2015a)
RE 38·0 1134·1 6·0 28·3 40·1 1 Kayabali and Ozdemir (2013), Kayabaliet al.
(2015b, 2015c)
RE 40·0 1256·6 10·0 78·5 16·0 4 Verástegui-Flores and Di Emidio (2014, 2015)
RE 40·0 1256·6 5·0 19·6 64·0 4 Puaet al. (2018)
Af, die orifice area;Ao, bore cross-sectional area of the extrusion chamber; DE, direct extrusion; Df, die orifice diameter;Do, bore diameter of the extrusion
The geometrical layout of the die can be reconfigured to reduce the size of the dead material zone but still maintaining the sameRvalue,
by using a die with multiple equally spaced smaller orifices rather than the customary single central orifice. This modification was adopted for the mud-press machine (MPM) extrusion device developed by Kayabaliet al. (2015a, 2016) and which is described later in this section. Based on the presented pe against die displacement traces and reportedvvalues in the papers by Kayabali and Tufenkci (2007) and Kayabali and Ozdemir (2013), the steady-state pe condition (i.e. soil worm extrudes at a steady rate) is achieved within~1–4 min from the start of the RE test.
An alternative soil-extrusion approach using an MPM device (see Figure 5(a)) was proposed in the papers by Kayabaliet al. (2015a, 2016) – that is, a miniature DE machine which extrudes the soil billet contained in a 30 mm dia. chamber by way of 28 equally spaced 2·5 mm dia. orifices (i.e. R = 5·1). In this instance, the applied loading is rendered by way of a manually operated mechanical press device, with the value ofFeincreasing steadily and quickly, becoming constant as soil worms extrude from the chamber orifices, as evident from theflat portions of the applied force against time traces in Figure 5(b). In other words, the extrusion velocity is not controlled for this experimental set-up, being dependent on the consistency of the test soil, the MPM’sRvalue and the applied force causing extrusion. Based on the extrusion force against time traces presented by Kayabaliet al. (2015a) and reproduced as Figure 5(b) in this paper, the steady-state extrusion condition is achieved very quickly, typically within~3 s–that is, compared with the RE testing
Soil specimen
Do = 40mm
Do
Df L = 50mm
Steel chamber
Steel die
(a) (b)
Side opening for access to extruded soil worm
F
100
mm
[image:4.595.119.460.141.436.2]35mm
Figure 3.RE testing: (a) schematic diagram of typical extrusion apparatus (adapted from Verástegui-Flores and Di Emidio (2014));
(b) extrusion apparatusfitted in a uniaxial-compression test machine (adopted from Kayabali and Ozdemir (2013))
v: mm/min
0 2 4 6 8 10 12
0 10 20 30 40 50
Steady-state
pe
: kPa
R = 64
R = 16
R = 4
Figure 4.Dependence of the steady-state extrusion pressure on
the extrusion ratio and die displacement rate for pure kaolin clay material prepared at itswL(FC)value (adopted from
[image:4.595.40.278.496.696.2]described earlier, the MPM device is portable and the test itself is significantly faster (completed within 1 min).
Undrained shear strength measurement
The RE approach has been used for undrained shear strength determinations on remoulded, compacted and undisturbed fi ne-grained soils (Kayabali, 2011a; Kayabali and Ozdemir, 2013; Kayabali and Tufenkci, 2010a; Kayabali et al., 2015a, 2015b; Whyte, 1982). Implicit in this approach are that, for given apparatusRand vvalues, the soil billet remains in an undrained condition during the course of the RE testing and, furthermore, the steady-statepe/suratio value is constant among differentfi ne-grained soils– that is, if partial drainage (consolidation) of the soil billet were to occur, its shear strength value would increase, mobilising a higher steady-state pe value, such that the steady-state pe/suratio value would increase accordingly. Both of these assumptions are examined in greater detail later in the paper.
In preparing remoulded RE test specimens (e.g. for consistency-limit determinations), excessive compactive effort should not be applied in forming the soil billet inside the extrusion chamber, with the static compaction method preferred. Otherwise, the billet’s compaction-induced overconsolidated state (O’Kelly, 2017; O’Kelly et al., 2019) would require higher applied extrusion pressures. Compared with specimens in the remoulded state, undisturbed test specimens invariably mobilise higher undrained shear strength in axial compression on account of their inherent fabrics (O’Kelly, 2006) and also possibly overconsolidated state, such that they too generally require higher extrusion pressures.
As described earlier, pe = fn(R, v, su), such that the steady-state extrusion pressure can be expressed in terms of the soil undrained shear strength for RE testing with givenRandvvalues, as follows
p
e¼
K
REs
u4.
where KRE is the RE factor that accounts for the apparatus extrusion ratio, die displacement rate and also apparatus friction and inhomogeneous billet deformation.
Alternatively, knowing the value of the steady-statepe/suratio for specific experimentalRandvvalues, the undrained shear strength value can be simply determined from the measured steady-state extrusion pressure value. As described earlier, implicit in these calculations is that the soil billet remains in a truly undrained condition throughout the RE testing.
Calibration of the RE device is performed experimentally, with its pertinent value of KRE for specific R and vvalues producing a one-to-one correspondence between the correlations for measured pairs of steady-state extrusion pressure and undrained shear strength values determined for the reference test material prepared at various water contents. In principle, this approach is the same as that presented in the papers by O’Kelly (2014a, 2018) for the calibration of an FC device using unconsolidated-undrained (UU) triaxial-compression data obtained for test specimens prepared at various water contents. The described approach is particularly versatile since the RE device calibration can be performed for pertinent confinement pressure and shearing rate values that are (a)
t: s 0
0
4 8 12
20 40 60 80
F
: kgf
w = 45·2%
48·7%
52·3%
58·7%
65·4%
[image:5.595.70.544.138.375.2](b)
Figure 5.MPM for DE soil testing: (a) photograph of the device, with two 30 mm dia. extrusion chambers included in the foreground;
controlled in performing the triaxial-compression tests. The MPM device can be calibrated in the same manner, but, because the extrusion velocity is not constant (depending on the MPM R value, soil undrained shear strength and maximum manually applied extrusion force), the MPM-derived strength values should be regarded as approximations only.
Steady-statepe/suratio
Provided that the soil billet remains in a truly undrained condition, following directly from Equation 4, one would expect for a given RE die configuration and setR andvvalues that the experimental steady-state pe/su ratio would have the same value for various fine-grained soils investigated. In this section, the author investigates this central assumption of the RE approach for su measurement, making use of deduced steady-state pe and measured su values presented in the paper by Kayabali and Ozdemir (2013), which is the only published research that reports suand associated steady-statepevalues at the same water contents for variousfine-grained soils.
Specifically, Kayabali and Ozdemir (2013) reported pairs ofsuand steady-statepevalues corresponding to the PL water contents (i.e. su(PL)and pe(PL), respectively) for 60 remouldedfine-grained soils (i.e.n= 60, wherenis the number of samples). They also reported pairs of undrained shear strength and steady-statepevalues for 75 undisturbed natural clay soils with various natural water content (wn) values. The steady-state pevalues were determined from RE testing for R and v values of 40·1 and 1 mm/min, respectively. Undrained shear strength was determined from unconfined compression testing of 38 mm dia. test specimens, with the remoulded specimens prepared by static compaction at the steady-state pe values corresponding to their PL water content (wP) values. Their reported tabulated data are plotted as thepe(PL)/su(PL) ratio against both wP and plasticity index (IP) and also as the steady-state pe/su ratio against wn in Figures 6(a)–6(c). Consistency-limit values were reported by Kayabali and Ozdemir (2013) for the 60 remoulded soils, such that these could be categorised in the present investigation as either clay or silt materials according to the standard plasticity chart.
As evident from Figure 6, the value of the steady-statepe/suratio for the set Rand vvalues varied widely for both the remoulded and undisturbedfine-grained soil specimens, with mean values of pe(PL)/su(PL)= 13·9 (standard deviation,s = 3·2 forn = 60) and steady-statepe/su = 14·9 (s= 4·7 forn= 75), respectively. The marginally higher pe/su ratio value for the undisturbed test specimens is most likely explained by the effects of their inherent fabrics and strength anisotropy, considering the different shearing mechanisms occurring in extrusion compared with uniaxial compression. Further, the regression linesfitted to thepe(PL)/su(PL) ratio values for the 60 remoulded specimens indicated an overall reducing trend with increasing wP (Figure 6(a)) and also with increasing plasticity (Figure 6(b)), more so for the clay soils than the silt soils investigated. Assuming that thesumeasurements are sound, these observations point to a fundamental issue with
extrusion testing that is soil dependent. As the constancy of the steady-statepe/suratio value is central to the REsumeasurement approach, this aspect merits further in-depth investigation and is fully addressed later in the paper.
pe/surelationships withRandv
For extrusion of metals, the relationship between the steady-state peand Rhas been shown to be wellfitted by Equation 5, which takes account of apparatus friction and inhomogeneous billet deformation.
p
ek
¼
c
þ
d
ln
R
5.
wherecanddare extrusion coefficients andkis the yield stress in shear.
Among thefirst soil-extrusion investigations, based on RE testing of twofine-grained soils, Whyte (1982) and Medhat and Whyte (1986) tentatively proposed two correlations of the form given by Equation 5 to relate the steady-state pe with the soil resistance capacity–that is, with thesuparameter replacing thekparameter in Equation 5. This relationship was further investigated by Kayabali (2011a), considering deduced pe(PL) values and an assumedsu(PL)= 160 kPa for 60 remouldedfine-grained soils. The deduced values of the coefficients c and d reported in these investigations are listed in Table 2. However, since the value of su(PL) is not unique, potentially varying over a very wide range between different soils (Haigh et al., 2013; Nagarajet al., 2012; O’Kelly, 2013a), the c and d coefficient values reported for the Kayabali (2011a) data set can at best be regarded as mean approximations. Further, none of these investigations considered the dependence of the steady-state pe/su ratio value on the die displacement rate in the case of soil-extrusion testing.
In order to investigate the relationship betweenR,vand the steady-statepe/su ratio the author has reinterpreted the data presented in Figure 4 for RE testing of kaolin specimens prepared at their FC LL water content (wL(FC)) values, as determined using the British Standard (BS) 30°–80 g FC in accordance with BS 1377-2:1990 (BSI, 1990). Knowing that the corresponding saturated remoulded undrained shear strength (i.e. su(LL)) value is ~1·7 kPa (O’Kelly et al., 2018), steady-state pe/su ratio values have been computed from the steady-statepedata values in Figure 4 and are replotted in Figure 7. Also, included in Figure 7 are
■ reportedpe/su–Rcorrelations in the papers by Whyte (1982) and Medhat and Whyte (1986)
■ representative correlation deduced by the author as part of the present investigation for the 60 remouldedfine-grained soils investigated in the paper by Kayabali (2011a)
0 10 20 30
0 20 40 60
pe(PL)
/
su(PL)
wP: % Clay soils
Silt soils
Silt soil trend line Clay soil
trend line
(a)
0 10 20 30
0 20 40 60
IP: %
Clay soils Silt soils
Silt soil trend line
Clay soil trend line pe(PL)
/
su(PL)
(b)
0 10 20 30
0 20 40 60
pe
/
su
wn: %
[image:7.595.111.504.137.539.2](c)
Figure 6.Steady-state extrusion pressure to undrained shear strength ratio: (a) and (b) show variation inpe(PL)/su(PL)with PL water content
and plasticity index, respectively, for various remoulded soils; (c) variation inpe/suwith natural water content for various undisturbed soils
(produced from tabulated data presented by Kayabali and Ozdemir (2013))
Table 2.Deduced values of coefficientscanddin Equation 5 for RE testing of remouldedfine-grained soils
Coefficient
v: mm/min Reference Comment
c d
1·6 4·3 Not reported Whyte (1982) One low-plasticity soil investigated (wL(cup)=
32·5%,wP= 16·5%)
0·5 5·8 Not reported Medhat and Whyte (1986) Flixton Clay material
2·87(s=0·94) 3·93(s=1·16) 3 Kayabali (2011a) Sixty differentfine-grained soils and assuming su(PL)= 160 kPa
0·098 4·508 2 Verástegui-Flores and Di Emidio (2014) Kaolin clay at its BSwL(FC)value
−0·098 5·118 4
−0·441 5·781 6
0·147 5·781 8
Data entries in italics were computed as part of the present investigation from data reported in these studies
[image:7.595.58.539.653.777.2]■ steady-state extrusion pressure for the LL water content (pe(LL)= 23·6 kPa (Verástegui-Flores and Di Emidio, 2015)) expressed as a ratio of FCsu(LL)(1·7 kPa) for setRandvvalues of 16 and 4 mm/min, respectively–that is,pe(LL)/su(LL)= 15·5.
As evident from Figure 7(a), even for the relatively narrowvdata range 1–8 mm/min available, the value of the steady-state pe/su ratio is strongly dependent on the values of bothvand logarithm R, with its dependency on the former appearing to increase with increasingR.
Note that the deduced (reported) coefficient c values listed in Table 2 are generally very small. In other words, for RE testing
and assuming no apparatus friction effect, one would expect a steady-state pe value of zero for the quasi-static extrusion of a zero-shear-resistance material, so that Equation 5 would take the form of pe/su = d0lnR, which is analogous to stress equals a modulus coefficient times strain, with the true strain of the soil billet given by lnR.
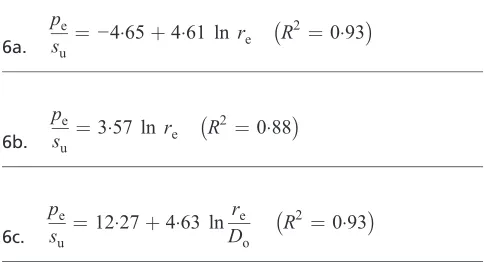
To account for die displacement rate, the steady-state pe/su data are plotted against extrusion rate re (= vR (mm/min)) in Figure 7(b) and also againstre/Doin Figure 7(c), with their
best-fit regression lines given by Equations 6a–6c. Equation 6b is the result of the steady-state pe/su–lnre regression analysis for the particular case with the value of coefficientcset as zero.
0 5 10 15 20 25 30
1 10 100
pe
/
su
R
Present investigation, 2 mm/min: y = 4·508 ln(x) + 0·098
Present investigation, 4 mm/min: y = 5·118 ln(x) – 0·098
Present investigation, 6 mm/min: y = 5·781 ln(x) – 0·441
Present investigation, 8 mm/min: y = 5·781 ln(x) + 0·147
Whyte (1982) Medhat and Whyte (1986) Kayabali (2011a), 3 mm/min Kayabali and Ozdemir (2013), 1 mm/min
(a)
0 5 10 15 20 25 30
1 10 100 1000
pe
/
su
pe /su = 4·61 lnre – 4·65
R² = 0·93
re: mm/min Present investigation, 2 mm/min Present investigation, 4 mm/min Present investigation, 6 mm/min Present investigation, 8 mm/min Kayabali (2011a), 3 mm/min Kayabali and Ozdemir (2013), 1 mm/min Verástegui-Flores and Di Emidio (2015), 4 mm/min Log. (all data)
(b)
0 5 10 15 20 25 30
0·1 1 10 100
pe
/
su
pe /su = 4·63 ln(re /Do) + 12·27
R² = 0·93
re /Do: min–1 Present investigation, 2 mm/min Present investigation, 4 mm/min Present investigation, 6 mm/min Present investigation, 8 mm/min Kayabali (2011a), 3 mm/min Kayabali and Ozdemir (2013), 1 mm/min Verástegui-Flores and Di Emidio (2015), 4 mm/min
[image:8.595.112.467.134.594.2](c) Verástegui-Flores and Di Emidio (2015), 4 mm/min
p
es
u¼
−
4
×
65
þ
4
×
61
ln
r
eR
2
¼
0
×
93
6a.p
es
u¼
3
×
57
ln
r
eR
2
¼
0
×
88
6b.p
es
u¼
12
×
27
þ
4
×
63
ln
r
eD
oR
2
¼
0
×
93
6c.
The extrusion rate (re) is the velocity of the soil worm. When normalised by a characteristic dimension, here taken as the bore diameter of the extrusion chamber, the re/Doratio (min−1) gives the strain rate. Since the compiled data set considers only twoDo values (i.e. 38 and 40 mm), Equation 6c is only tentatively proposed, although if steady-statepe/su data were available for a wideDorange, it is suggested that this form of relationship would provide superior fitting for the enlarged data set. Further, this form of relationship would allow valid comparisons of sumeasurements obtained using different RE apparatus employing variousRandvvalue combinations.
The strain-rate range 0·2–12·8 min−1 for soil extrusion (see Figure 7(c)) is comparable with that usually employed for UU triaxial-compression testing but substantially lower than the shear strain rate of the order of 170 min−1 typical of the range of penetration depths measured in practice for the BS FC LL test (Koumoto and Houlsby, 2001; Sivakumaret al., 2015). The very high strain rates for the FC test specimen are such that it undergoes undrained shearing for all practical purposes and triaxial specimens are fully enclosed by a sealing membrane to ensure a fully undrained condition. In contrast, the combination of relatively high confinement pressure acting on the soil billet and slow strain rate can potentially allow some consolidation to occur with drainage by way of the die orifice. This potential major shortcoming of the soil-extrusion approach, one that has received almost no attention in the published literature, is explored in detail later in the paper.
Atterberg-limit determinations
Sincefirst introduced in soil mechanics approximately 45 years ago, the extrusion approach has been promoted for LL and PL determinations by a handful of research groups on the premise that, for given apparatusRand vvalues, thewLand wP values are associated with unique values of pe(LL) and pe(PL), respectively. Furthermore, Kayabali (2012, 2013) proposed that the RE approach could also be used for shrinkage-limit (SL) determinations, claiming that the SL water content (wS) value was also associated with a unique steady-state extrusion pressure (i.e.pe(SL)) value. Implicit in these approaches are that the steady-state pe/su ratio value is constant among different fine-grained soils and the soil billet remains in a truly undrained condition throughout the RE test. Further, and, importantly, the
determination of the consistency limits using the RE approach relies on them having strength-based definitions, and, while this holds true for wL(FC)(O’Kellyet al., 2018), it is definitively not the case for the standardwPand wS(Barnes and O’Kelly, 2011; Haighet al., 2013; Nagarajet al., 2012; O’Kelly, 2013a; O’Kelly et al., 2018; Sivakumar et al., 2016). In other words, as elaborated in the following sections, it should not be unexpected if the experimental values of both pe(PL) and pe(SL) for various
fine-grained soils were to vary over wide ranges.
Experimental approaches employed for the determination of RE pressures corresponding to consistency limits
Two approaches have been employed in previous RE investigations for the determination of the values of pe(LL) and pe(PL) associated with a given experimental set-up. In their investigations, Kayabali and co-workers employed regression and extrapolation of the steady-state pe–w correlation obtained for a minimum of five specimens of the test soil prepared at various water contents within its liquidity index (IL) range 0–0·5. As reported by Kayabali et al. (2015b), the values of water content that they investigated were limited to this ILrange because they found that RE testing became very difficult to conduct forIL > 0·5, presumably because their experimental set-up did not have the required sensitivity for the pe values mobilised by a lower-shear-strength material. Typical die force–displacement traces for high-plasticity soil are shown in Figure 8(a), from which data pairs of steady-state pe and corresponding water content values were obtained and plotted in a semi-logarithmic chart (Figure 8(b)). The values of the y-intercept, a (i.e. for w = 0), and gradient −b were then determined for the best-fit correlation line (Equation 7) from regression analysis. Knowing the soil-dependent a and b values, the pe(LL) and pe(PL) values were computed by data extrapolation for the particular soil investigated on inputting, in turn, its conventionally measured wL and wP values in Equation 7. As discussed later in the paper, the same approach was used in the papers by Kayabali (2012, 2013) for the determination of the steady-statepe values corresponding to the wSvalues measured for variousfi ne-grained soils.
p
e¼
ae
−bw7.
A different experimental approach was adopted in the papers by Verástegui-Flores and Di Emidio (2014, 2015). The value of pe(LL) was obtained from repeat RE tests performed on the reference kaolin clay material prepared at its wL(FC) value. The pe(PL) value was determined for the reference bentonite clay material from extrapolation of its best-fit steady-state pe–w correlation to its measured thread-rollingwPvalue, when analysed in a bi-logarithmic chart (Equation 8).
p
e¼
a
0w
−b0 [image:9.595.56.298.143.274.2]wherea0 and b0 are the y-intercept and gradient, respectively, of the best-fit correlation line in a bi-logarithmic chart.
Recommended RE approaches for consistency-limit determinations
LL determination
From the author’s perspective, the value of pe(LL)would be best determined from RE testing of reference fine-grained soil prepared at its measuredwL(FC) value –that is, since thewL(FC) value is strength based, with the BS FC LL (BS 1377-2:1990 (BSI, 1990)) condition corresponding tosu(LL)≈ 1·7 kPa, the RE approach is valid for wL(FC) determinations provided that the steady-state pe/su ratio remains constant, having the same value for different fine-grained soils. As explained earlier, this assumption is inherently dependent on the soil billet remaining in a truly undrained condition throughout the RE test.
The aforementioned approach was employed in the investigation by Verástegui-Flores and Di Emidio (2014), who reported a steady-statepe(LL)value of 23·6 kPa for RE of a pure kaolin clay material prepared at its wL(FC) value, as determined from three repeat RE tests with R = 16 and using v = 4 mm/min. As expected, good agreement was reported between the derived RE LL water content and the BS-measured wL(FC) value for various artificialfine-grained soil mixtures composed of different percentages of kaolin and bentonite materials, thereby covering an extremely wide range of plasticity.
Should RE testing prove problematic at the LL water content owing to the soil’s very low undrained shear strength, the RE tests can instead be performed on the reference soil material for various lower water contents that produce values of steady-statepewithin the approximate range 10–50 kPa. The value of pe(LL) is then determined from the steady-state pe–w regression correlation as
the extrapolated extrusion pressure value corresponding to the measured wL(FC) value. Once the pertinent value of pe(LL) has been established for the particular experimental RE set-up, the latter (extrapolation) approach can be employed for subsequent LL determinations on otherfine-grained soils.
With a suitably largeRvalue, it is probable that the MPM device used in combination with a rapid water content sensor device (e.g. see the papers by Caldwell et al. (2018) and Dettmann and Bechtold (2018)) could be used to obtain quick estimates of the steady-statepe–wcorrelation for a given test soil. Hence, having previously established the MPMpe(LL)value, the value ofwL(FC) could be estimated from extrapolation of the obtained correlation. This aspect may merit further research.
PL determination
A significant shortcoming of the extrusion approach (and other strength-based methods, including FC (e.g. see the paper by O’Kellyet al. (2018)) is that it cannot demonstrate the significant change in behaviour, from ductile to brittle, obtained for rolling out of soil threads at water contents each side of the PL. The approach employed in previous RE investigations of soil consistency relied on correlations with the thread-rolling PL method to configure the RE apparatus set-up accordingly. As described earlier in the paper, when considering various fine-grained soils, however, any agreement between measured thread-rolling PL and RE-derived PL values is purely coincidental. In other words, the RE approach cannot consistently provide reliable wP values for different soils investigated, and, as such, the author recommends that the RE approach not be used for PL determinations.
A new parameter, RE25, termed the extrusion pressure parameter (analogous to the FC PL25parameter first proposed in the paper by O’Kelly et al. (2018)), is introduced at this stage and is
Die travel: mm
F
: kN
3
2
1
1 0
0 2 3 4 5 6
w = 21·7%
22·8%
23·6%
25·4% 27·8%
29·6% 31·5% 33·4% 35·6% 37·1%
(a)
20 25 30 35 40
w: % 100
1000 10000
pe
: kPa
y = 64 154e–0·153x R2 = 0·9982
[image:10.595.53.531.139.334.2](b)
Figure 8.RE of high-plasticity soil (wL(FC)= 61%;wP= 24%) forR= 40·1 andv= 1 mm/min: (a) die force–displacement traces for various
defined as the water content value corresponding to a steady-state pe value 25 times greater than the pe(LL) value – that is, corresponding to su ≈ 42·5 kPa. Like PL25, the water content corresponding to this new extrusion pressure parameter bears no relationship with the standard PL water content, any equivalence in their values for a given soil being purely coincidental. The extrusion pressure range considered is limited to a 25-fold increase (i.e. encompassing soft to medium-stiffness clays), since
fine-grained soils are invariably in a plastic state over the associated water content range (O’Kelly et al., 2018) – that is, widening the range of steady-state pe values considered in this analysis any further would incur the increasing probability of soil materials occurring in a brittle state near the associated lower-bound water content value.
Using the newly introduced RE25 parameter allows significantly better correlations to be achieved between the steady-statepe(and hence undrained shear strength) value and a new consistency index (IRE: Equation 9) parameter than can be obtained with the conventional liquidity index parameter.
I
RE¼
log
w
L FCð Þ−
log
w
log
w
L FCð Þ−
log
RE
25 9.withIRE being defined in logarithmic form since compared with the semi-logarithmic form, the bi-logarithmic steady-state pe(su) againstwcorrelation for a given soil material generally provides a regression coefficient value closer to unity.
Rearranging Equation 9 and assumingsu(LL)= 1·7 kPa forIRE= 0, the value of saturated remoulded undrained shear strength for water content values in the range wL(FC) < w < RE25 can be approximated in the proposed framework as (O’Kellyet al., 2018)
s
u¼
10
14IREþ023 10.RE pressure values reported for consistency
limits
WithR = 40·1 andv= 3–5 mm/min, respective mean values for pe(LL)and pe(PL)of approximately 20 and 2000 kPa for n= 120 (Kayabali, 2011a) and 100 (Kayabali, 2012), 30 and 2250 kPa for n= 20 (Kayabali and Tufenkci, 2007), 35 and 3000 kPa forn= 31 (Kayabali and Tufenkci, 2010b) and 40 and 3100 kPa forn= 30 (Kayabali and Tufenkci, 2010a) have been determined experimentally for different groups of fine-grained soils. Using the same RE apparatus (R = 40·1) but for a slower die displacement rate of 1 mm/min, Kayabali et al. (2015c) reported respective mean values forpe(LL) andpe(PL)of approximately 15 and 2300 kPa forn= 70, with the lowerpe(LL)value deduced for this experimental set-up consistent with the earlier presented theory that requires overall lower values of steady-state pe for a slower die displacement rate.
Compared with pe(PL), the mean pe(LL) range 20–40 kPa deduced in the various studies by Kayabali and co-workers for R = 40·1 and v = 3–5 mm/min was much narrower. This is largely explained by the compatibility of the RE, FC LL and to a less extent the Casagrande LL measurement approaches, in that they are all essentially strength based, whereas the standard PL is not a strength-based phenomenon but a demarcation between ductile (or plastic) and brittle behaviour (Barnes and O’Kelly, 2011; Haigh et al., 2013; O’Kelly, 2013a; O’Kelly et al., 2018; Sivakumaret al., 2016).
Using an RE set-up withR= 16·0 andv= 4 mm/min, Verástegui-Flores and Di Emidio (2014, 2015) reported repeatable pe(LL) = 23·6 kPa andpe(PL)= 558·3 kPa (linked to the water contents at the BS FC LL (BS 1377-2:1990 (BSI, 1990)) and standard thread-rolling PL) for various soil samples prepared by mixing kaolin and bentonite clays in different proportions. These pe(LL) and pe(PL) values are significantly lower than the mean values ofpe(LL)and pe(PL) ranging approximately 20–40 and 2000–3100 kPa, respectively, reported in the earlier-mentioned studies by Kayabali and co-workers, who investigated R= 40·1 andv= 3–5 mm/min. Again, this is consistent with the presented theory that requires overall lower values of steady-statepefor a lowerRvalue.
As expected, good agreement between the derived RE LL and BS-measuredwL(FC)values was reported by Verástegui-Flores and Di Emidio (2014) but not for the Casagrande-cup measured values (i.e. wL(cup)), with strong divergence occurring between wL(cup) and BS wL(FC) for increasing bentonite content in the tested soil materials (Figure 9).
The systematic bias producing wL(cup) > wL(FC) for high-LL materials is well documented (e.g. see the papers by Haigh (2012), O’Kelly (2019) and Vardanegaet al. (2018)). Specifically, BS wL(FC) corresponds to an su(LL) value of ~1·7 kPa (O’Kelly et al., 2018), whereas wL(cup) corresponds to a specific strength (i.e. ratio of su to soil density) value of~1 m2/s2 (Haigh, 2012). The latter equates to a relatively narrow Casagrande su(LL) range of ~1–3 kPa (O’Kelly, 2019), reducing approximately linearly in value with increasing water content at the LL, when plotted in a semi-logarithmic chart (Youssef et al., 1965). As such, strong divergence between wL(FC) and wL(cup) values occurs for increasing LL beyond 120% water content (O’Kelly, 2013a; O’Kelly et al., 2018; Škopek and Ter-Stepanian, 1975; Wasti, 1987). Hence, along with differences in die displacement rates employed (v= 1–5 mm/min), the disparity inwLvalues obtained for a given soil tested using the Casagrande-cup and FC LL methods may partly explain inconsistencies in the mean pe(LL) values associated with BSwL(FC)andwL(cup)for a given extrusion ratio value.
displacement rate. As explained earlier, while this statement holds true for wL(FC), it has been definitively established that the value of su(PL) is not unique but can vary over a wide range in considering different fine-grained soils (Haigh et al., 2013; Nagaraj et al., 2012; O’Kelly, 2013a). A major factor explaining the very wide mean pe(PL) range 2000–3100 kPa reported by Kayabali and co-workers for their RE set-up with R = 40·1 and using v = 3–5 mm/min is, therefore, the expected variation in su(PL) values for different fine-grained soils. Other contributing factors include differences in die displacement rates employed and also the fact that different methods were adopted for PL determinations, with Kayabali and Tufenkci (2010a, 2010b) employing the standard thread-rolling method, whereas Kayabali (2012) and Kayabali et al. (2015b, 2015c) employed the PL rolling device described in ASTM D 4318-17e1 (ASTM, 2017). Specifically, PLs obtained using this rolling device generally underestimate the standard thread-rolling PLs (Bobrowski and
Griekspoor, 1992), most likely because the paper covering the two rolling plates tends to cause inhomogeneity of the soil thread, the outside becoming drier than its centre, during the rolling-out procedure (O’Kelly et al., 2018). As such, compared with standard thread-rolling, values of su(PL) and hence pe(PL) for a givenfine-grained soil would be expected to be higher overall for PLs obtained using the rolling device.
As mentioned earlier, the RE approach has also been proposed for the determination of the values ofwSforfine-grained soils. For instance, with R = 40·1, pe(SL) values of 12 000 kPa for v= 5 mm/min (n= 100 (Kayabali, 2012)) and 15 000 kPa (n= 120 (Kayabali, 2013)) were reported as providing reasonably good estimates of the values of wS, as determined using the mercury method in accordance with ASTM D 427-98 (ASTM, 1998). As such, the RE approach may appear as an attractive proposition for SL determination. However, since the SL is the transition water content below which no further reduction in the soil volume occurs (i.e. not a strength-based definition), the RE approach cannot consistently provide reliable wS values. Consequently, the author does not recommend the RE approach for SL determination.
Relationships between measured consistency
limits and deduced RE pressure values
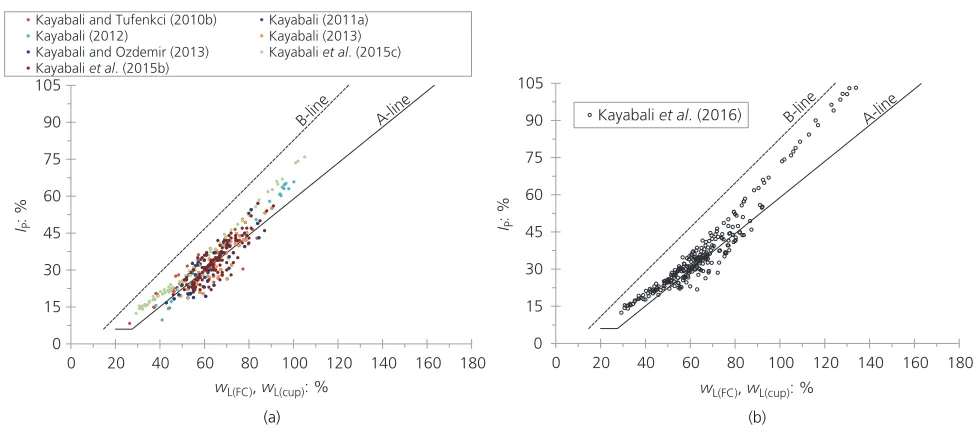
In this section, the extensive data sets presented in the papers by Kayabali (2011a, 2012, 2013), Kayabali and Ozdemir (2013), Kayabali and Tufenkci (2007, 2010b) and Kayabaliet al. (2015b, 2015c), which together report original pairs of pe(LL) and pe(PL) values deduced for the consistency limits of 457 different fi ne-grained soils, are combined and reassessed as part of the present investigation. These data sets relate to an RE apparatus with an Rvalue of 40·1 and employed die displacement rates of 1 (Kayabali and Ozdemir, 2013; Kayabali et al., 2015b, 2015c), 3 (Kayabali, 2011a) and 5 mm/min (Kayabali, 2012; Kayabali and Tufenkci, 2007, 2010b) to investigate a very wide range of soil plasticity; wL= 26·4–105·0%,wP= 15·4–46·9% and IP= 8·3–75·9% (see Table 3 and Figure 10). Using this large data set, potential relationships between reported consistency limits and their steady-statepevalues are investigated, including the effects of changes in soil plasticity categories (levels) and die displacement rate. Further, the pe(LL) and pe(PL)values deduced for the consistency Bentonite content: %
0 0
20 40 60 80 100
100 200 300 400
Consistency limits: %
PLs LLs
wL(cup)
wL(FC) Standard PL
[image:12.595.41.278.138.339.2]‘PL‘ from FC method after Feng (2004) Reverse extrusion
Figure 9.Good agreement between BS FC LL, standard PL and
corresponding values deduced using RE apparatus withR= 16·0 and usingv= 4 mm/min,pe(LL)= 23·6 kPa andpe(PL)= 558·3 kPa
[image:12.595.45.538.678.800.2]for artificialfine-grained soil samples containing various bentonite contents (adopted from Verástegui-Flores and Di Emidio (2014))
Table 3.Atterberg-limit ranges for various RE soil investigations performed by Kayabali and co-workers
Reference n wL: % wP: % IP: %
Kayabali and Tufenkci (2007) 20 29·5–82·6 16·7–35·0 10·8–47·6
Kayabali and Tufenkci (2010b) 31 26·4–83·6 16·7–46·9 8·3–46·5
Kayabali (2011a) 120 42·9–90·3 21·9–43·8 16·7–55·1
Kayabali (2012) 100 38·2–100·2 22·6–39·0 9·7–65·8
Kayabali (2013) 120 42·9–90·3 21·9–43·8 16·7–55·1
Kayabali and Ozdemir (2013) 60 42·9–84·5 21·9–41·4 16·7–54·5
Kayabaliet al. (2015a) 60 29·3–117·0 15·4–29·1 12·4–90·0
Kayabaliet al. (2015b) 120 46·0–91·0 22·0–44·0 20·0–57·0
Kayabaliet al. (2015c) 70 29·3–105·0 15·4–29·1 12·4–75·9
limits of another 275 different fine-grained soils using the MPM device approach and reported in the paper by Kayabali et al. (2016) are separately reassessed as part of the present investigation for the same purposes.
As already mentioned, different methods were adopted in these studies for the determination of the consistency limits –that is, the Casagrande-cup or BS FC methods for LL determinations and standard thread-rolling or rolling-device methods for PL determinations. Multiple repeat tests were performed in these studies towards ensuring good reliability of reported LL and PL values. For instance, thewL(FC) andwPvalues reported for each soil sample investigated in the paper by Kayabali and Tufenkci (2010b) are the computed mean of 15 or 22 pairs of LL and PL test results obtained for each soil sample by various experienced operators in eight different soil mechanics laboratories. However, the nuances of the experimental methods themselves and their derived results must be considered when interpreting the various data trends for the combined data sets.
RE pressure corresponding to LL
Considering the entire combined RE data sets forv= 1–5 mm/min, pe(LL) had a mean value of 22·3 kPa (s = 16·0 kPa) and demonstrated general overall strong trends of reducing exponentially from approximately 90 to 2 kPa for increasing wLfrom 35 to 95% (Figure 11(a)) and also for increasingIP(Figure 11(b)). The effects of adopting different LL determination methods were unexpected and counterintuitive. For a given RE set-up, since wL(FC)corresponds to a particular referencesuvalue, the associated pe(LL)values should, in theory, remain approximately constant for different LL water content values. However, this was not the case; instead, they exhibited a strong exponentially reducing trend with increasingwL(FC), as evident for the Kayabaliet al. (2015b, 2015c)
data sets presented in Figure 11(a). Further, the Kayabali et al. (2015c) data set was obtained for the lowest die displacement rate investigated (1 mm/min) and generally plotted as a lower bound for the entire combined data set, indicating a significant extrusion (strain) rate effect. Also unexpected was the values of pe(LL) corresponding to the wL(cup) values for the Kayabali (2012) and Kayabali and Tufenkci (2010b) data sets generally plotting above the Kayabali et al. (2015c) data set–that is,wL(cup) >wL(FC) for higher LL water contents implies lower values of pe(LL)expected for wL(cup). The relationship between pe(LL) and wP was also investigated, but no consistent overall trend was apparent.
RE pressure corresponding to PL
Considering the entire combined data sets for v = 1–5 mm/min, pe(PL)had a mean value of 2240 kPa (s= 839 kPa), with 900 and 5300 kPa appearing as approximate tentative lower- and upper-bound values (Figure 12). Apart from the Kayabali and Tufenkci (2007, 2010b) data sets, the overall trend suggests that the values of pe(PL) appear to reduce exponentially from approximately 4000 to 1100 kPa whenwPincreases from 17 to 37% (Figure 12(a)). The apparent opposing trend of increasingpe(PL)values with increasing wPobserved for the Kayabali and Tufenkci (2007, 2010b) data sets may be related to the fact that they were determined for the highest die displacement rate ofv= 5 mm/min investigated–that is, overall higher steady-statepevalues could be anticipated on account of the greater strain-rate effect compared with, for instance, the Kayabali et al. (2015c) data set obtained for v= 1 mm/min, which clearly exhibited a decreasing trend with increasing value ofwP.
In relation to the plasticity index, the overall trend considering the entire combined data sets is that the value of pe(PL) marginally increases with increasingIP(Figure 12(b))–that is, apart from the Kayabaliet al. (2015c) data set, which again may be explained by 0
15 30 45 60 75 90 105
0 20 40 60 80
B-line A-line
100 120 140 160 180 IP
: %
wL(FC), wL(cup): %
Kayabali and Tufenkci (2010b) Kayabali (2011a)
Kayabali (2012) Kayabali (2013)
Kayabali and Ozdemir (2013) Kayabali et al. (2015c)
Kayabali et al. (2015b)
(a)
0 15 30 45 60 75 90 105
0 20 40 60 80 100 120 140 160 180 Kayabali et al. (2016) B-line A-line
IP
: %
wL(FC), wL(cup): %
[image:13.595.62.549.139.356.2](b)
the lower die displacement rate employed for that investigation. When the entire combined data sets were plotted in a bi-logarithmic chart, the value of pe(PL) was found to increase approximately with increasing pe(LL) according to a power-law relationship (see Figure 12(c)). The relationship between pe(PL) and wL was also investigated, although no consistent overall trend was apparent.
Ratio of RE pressures at consistency limits
The ratio of steady-state extrusion pressures corresponding to the consistency limits (i.e.pe(PL)/pe(LL)) had a mean value of 204 but with an extremely wide range, showing a general strong trend of increasing exponentially from approximately 30 to 2000 whenwL increases from 35 to 100% (Figure 13(a)) and also when IP increases from 10 to 75% (Figure 13(b)). In relation to PL, regression of the entire combined data sets indicated that the pe(PL)/pe(LL) ratio reduces approximately exponentially in value with increasing wP, although the Kayabali and Tufenkci (2007, 2010b) and Kayabali et al. (2015c) data sets tended to suggest that the opposite occurs.
DE testing using the MPM device
As evident from Figure 14, the same general trends in terms of the steady-state DE pressures for the consistency limits are found from reanalysis of the Kayabali et al. (2016) data set obtained using the MPM device with R = 5·1 – that is, a significant approximately exponential decrease in the value of pe(LL) occurs for increasingwL(FC), whereas the value ofpe(PL)does not exhibit this trend with increasing IP (appearing independent of one another for IP > ~50%), such that the value of the pe(PL)/pe(LL) ratio exhibits a general strong exponentially increasing trend for increasing IP. Referring to Figure 14, the ranges of the MPM pe(LL)andpe(PL)values are different from those presented for RE
testing in Figures 11–13 since the die configurations and values of theRandvparameters were significantly different between these two experimental approaches.
Discussion
The regression correlations included in Figures 11 and 12 would suggest that the values of the steady-state RE pressures corresponding to the consistency limits are not unique but instead are strongly dependent on the soil plasticity, with the values of pe(PL) and, in particular, pe(LL) both reducing exponentially for increasing values ofwPand wL, respectively (Figures 11(a) and 12(a)). However, there are a number of major anomalies between these suggested behaviours and the actual soil behaviour.
In relation to LL, within the limits of experimental error and following directly from Equation 4, the value of pe(LL) should remain constant for increasing value of wL(FC), since the associated su(LL) value remains approximately constant – for example, at~1·7 kPa in the case of the BS FC LL. However, the pe(LL)-against-wL(FC)data set from Kayabaliet al. (2015c) presented in Figure 11(a) clearly shows that their deduced values of pe(LL) substantially decrease for increasing value ofwL(FC), with values ofpe(LL) as low as 0·8–2 kPa for wL(FC)> 80%. In other words, the trend in the Kayabaliet al. (2015c) data set would imply that, for givenRandvvalues, the value ofpe(LL)corresponding to the wL(FC)is not uniquely related to the soilsu(LL)value, but it is also significantly dependent on its plasticity characteristics. If this statement were true, the non-uniqueness in the value of pe(LL) associated with wL(FC) would invalidate the extrusion approach for LL determination and undrained shear strength measurement. Further, for increasing values of wL(cup), it is well documented that the associated values ofsu(LL)decrease exponentially over a
0·1 1 10 100 1000
0 20 40 60 80 100 120
Kayabali and Tufenkci (2007) Kayabali (2013)
Kayabali and Tufenkci (2010b) Kayabali and Ozdemir (2013) Kayabali (2011a) Kayabali et al. (2015c) Kayabali (2012) Kayabali et al. (2015b)
pe(LL)
: kPa
(a)
wL(FC), wL(cup): %
0·1 1 10 100 1000
0 10 20 30 40 50 60 70 80 90
Kayabali and Tufenkci (2007) Kayabali (2013)
Kayabali and Tufenkci (2010b) Kayabali and Ozdemir (2013) Kayabali (2011a) Kayabali et al. (2015c) Kayabali (2012) Kayabali et al. (2015b)
pe(LL)
: kPa
IP: % (b)
pe(LL) = 96·0e–0·053IP
[image:14.595.52.532.141.364.2]R2 = 0·50
Figure 11.Steady-state extrusion pressure at LL deduced forR= 40·1 andv= 1–5 mm/min plotted against (a) water content at LL and
relatively narrow range of ~1–3 kPa (O’Kelly, 2019; Youssef et al., 1965). Hence, with pe(LL) solely dependent on the soil billet’ssuvalue for givenRandvvalues according to Equation 4, the value of pe(LL) would also be expected to exhibit a proportionate exponential decrease with increasing value of wL(cup). However, as evident in Figure 11(a), an approximate two-orders-of-magnitude decrease in the value ofpe(LL)(reducing from approximately 90 to 2 kPa) occurred for increasing wL(cup) from 35 to 95%. Clearly, such an enormous reduction in the value of pe(LL) cannot be reconciled with the more modest reduction occurring in the value of Casagrandesu(LL)for increasingwL(cup). Taken together, these observations indicate a major issue with the values ofpe(LL)reported by Kayabali and co-workers, particularly for wL>~60% and IP>~35%, as tentatively deduced from the general pattern of the data spread evident in Figures 11 and 13.
In relation to PL, consistent with the general overall trend expected for su(PL) with increasing soil plasticity, one would anticipate that the values ofpe(PL)and thepe(PL)/pe(LL)ratio would decrease overall with increasing value of IP. However, the data trends in Figures 12(b) and 13(b) seem to suggest that this was not the case, with the values of pe(PL) and particularly the pe(PL)/pe(LL) ratio increasing exponentially with increasing IPfor the various fine-grained soils investigated. For instance, the value of the pe(PL)/pe(LL) ratio increased from approximately 30 to 2000 for increasingIPfrom 10 to 75%. Further, with Equation 4 implying that the steady-statepe is analogous tosu, this approximately 67-fold increase in the value of the pe(PL)/pe(LL) ratio (and hence the su(PL)/su(LL) ratio) for increasing IPof fine-grained soil is simply not credible– see the discussion on typical strength gain over plastic range presented in the paper by O’Kelly (2013a). Based on all of the aforementioned 100
1000 10000
0 10 20 30 40 50 60
Kayabali and Tufenkci (2007) Kayabali (2013)
Kayabali and Tufenkci (2010b) Kayabali and Ozdemir (2013)
Kayabali (2011a) Kayabali et al. (2015c)
Kayabali (2012) Kayabali et al. (2015b)
pe(PL)
: kPa
wP: %
(a)
100 1000 10000
0 10 20 30 40 50 60 70 80 90
Kayabali and Tufenkci (2007) Kayabali (2013)
Kayabali and Tufenkci (2010b) Kayabali and Ozdemir (2013)
Kayabali (2011a) Kayabali et al. (2015c)
Kayabali (2012) Kayabali et al. (2015b)
pe(PL)
: kPa
IP: %
(b)
pe(PL) = 1874e0·0029IP
100 1000 10000
0·1 1 10 100
Kayabali and Tufenkci (2007) Kayabali (2013)
Kayabali and Tufenkci (2010b) Kayabali and Ozdemir (2013)
Kayabali (2011a) Kayabali et al. (2015c)
Kayabali (2012) Kayabali et al. (2015b)
pe(PL)
: kPa
pe(LL): kPa
pe(PL) = 1817pe(LL)
(c)
[image:15.595.65.543.133.564.2]0·0427
Figure 12.Steady-state extrusion pressure at PL deduced forR= 40·1 andv= 1–5 mm/min plotted against (a) water content at PL,
observations, it is evident that other influencing factors are at play, with three significant ones identified by the author investigated in the following sections –that is, it is the author’s contention that inconsistencies in the reported pe(LL) and pe(PL) values and their inferred correlations with the consistency limits largely occur for the following reasons.
■ Some consolidation of the soil billet may occur under the compressive force applied by the slowly advancing die, particularly for stiffer soils that require very high extrusion pressures and particularly those with higher hydraulic conductivity values. In these instances, the value of shear strength mobilised in the billet’s yielding zone would correspond to a partially drained condition (i.e. greater than the assumed undrained shear strength value).
■ For the water content range ofwP£w<wT(wherewTis the transition water content below which the soil has measurable toughness), the property governing extrusion resistance capacity is the soil remoulding toughness (T), rather than simply its undrained shear strength.
■ When considering a wide range of water contents, the general piecewise-linear nature of the steady-statepe–wrelationship impacts on the reliability of extrusion pressure values deduced from regression analyses and data extrapolation.
Partially drained condition of the soil billet?
Relative to the consistency of the soil billet, the extrusion pressures required for plastic soils are very high, with their values significantly increasing for soil with greater shear strength and for higher experimentalRandvvalues. For instance,pe(LL)andpe(PL) values ranging approximately 20–40 and 2000–3100 kPa, respectively, were reported for the RE apparatus with anRvalue
of 40·1 employed in the investigations of various fine-grained soils by Kayabali (2011a, 2012) and Kayabali and Tufenkci (2007, 2010a, 2010b). For the slow die displacement rates of typically 1–5 mm/min employed, it is entirely plausible that some localised consolidation of the soil billet may occur, caused by drainage of the highly pressurised pore water from the die end of the billet, by way of the extruding soil worm which is under no confinement pressure. More pronounced localised consolidation would be expected for stiffer soils that require higher extrusion pressures, those with greater hydraulic conductivity and also for lower die displacement rates, such that the drainage time increases. In this event, the shear strength mobilised in the billet’s yielding zone would correspond to a partially drained condition, representing a significant departure from the extrusion theory that was adopted from metallurgy. If substantiated, this anomaly could adversely impact or possibly even invalidate the RE approach for the determination of the true undrained shear strength for fi ne-grained soil and by association its consistency-limit values. A full review by the author of the pertinent literature produced only two experimental evidences, which are elaborated below, concerning this particular aspect of RE soil testing.
The most compelling evidence supporting the billet consolidation hypothesis occurs in connection with RE testing of pure kaolin clay (wL = 53·2%; wP = 31·0%) prepared at water contents slightly higher than its PL, as reported in the papers by Verástegui-Flores and Di Emidio (2014, 2015). Rather than reaching a steady-statepe value, the mobilised extrusion pressure continuously increased with increasing die displacement, from which Verástegui-Flores and Di Emidio (2014, 2015) concluded that not only did the kaolin clay billets undergo extrusion but they were also undergoing consolidation within the RE chamber. This 10
100 1000 10000
0 20 40 60 80 100 120
Kayabali and Tufenkci (2007) Kayabali (2013)
Kayabali and Tufenkci (2010b) Kayabali and Ozdemir (2013)
Kayabali (2011a) Kayabali et al. (2015c)
Kayabali (2012) Kayabali et al. (2015b)
pe(PL)
/
pe(LL)
: kPa
(a)
wL(FC), wL(cup): %
10 100 1000 10000
0 10 20 30 40 50 60 70 80 90
Kayabali and Tufenkci (2007) Kayabali (2013)
Kayabali and Tufenkci (2010b) Kayabali and Ozdemir (2013)
Kayabali (2011a) Kayabali et al. (2015c)
Kayabali (2012) Kayabali et al. (2015b)
pe(PL)
/
pe(LL)
: kPa
lP: %
R2 = 0·50
pe(PL)/pe(LL) =19·5e0·0558IP
[image:16.595.53.526.143.360.2](b)
Figure 13.Ratio of steady-state extrusion pressures at the consistency limits deduced forR= 40·1 andv= 1–5 mm/min plotted against
assessment was confirmed by the extruded soil worm having an increased value of water content compared with the remaining compressed billet. In other words, consolidation of the soil billet (with drainage by way of the die orifice) under the very high applied extrusion pressures progressively increased the shear strength value of the kaolin clay billet within the extrusion chamber, such that a steady-statepe value could not be achieved for large die displacements. These researchers reported no similar issues for RE testing of the same kaolin clay at itswL value, or for natural Boom Clay containing illite (wL = 51·0%; wP = 32·4%) and pure bentonite clay (wL = 374·7%; wP = 62·9%) prepared at water contents slightly higher than theirwPvalues. As such, it would appear that fine-grained soil with higher shear strength can be susceptible to billet consolidation and that the other major determining factors are clay mineralogy and gradation. The dependence of shear resistance and compressibility on clay mineralogy is well documented (O’Kelly, 2014b) – that
is, among kaolinite, illite and smectite clay minerals, kaolinite has a smaller specific surface area and shows higher hydraulic conductivity, so it is more prone to releasing water when subjected to confinement stress.
On the other hand, based on <1% difference between the measured water contents of the soil billet and worm parts for 12 specimens of a single high-plasticity clay soil (wL= 57·2%;wP= 23·0%) reverse-extruded at various water contents, Kayabali and Tufenkci (2010b) concluded that the soil material in the billet’s yielding zone remained in a fully undrained condition. However, a water volume balance requires that pore water draining out of the extrusion chamber by way of the die orifice brings about recovery for the extruded soil worm of any reduction in its water content value that occurred earlier within the yielding zone to (approximately) the billet’s initial water content value. As such, this experimental evidence presented by Kayabali and Tufenkci 1
10 100 1000
0 50 100 150 200
pe(LL)
: kPa
(a)
wL(FC): %
100 1000 10 000
0 50 100 150
pe(PL)
: kPa
(b) IP: %
1 10 100 1000
0 50 100 150
pe(PL)
/
pe(LL)
lP: %
[image:17.595.117.497.139.524.2](c)
Figure 14.MPM DE testing of 275fine-grained soils forR= 5·1: values of steady-state extrusion pressure corresponding to (a)wL(FC)and
(2010b) does not, in itself, conclusively support their assertion of a truly undrained billet condition.
Compared with the high-plasticity clay soils investigated by Kayabali and Tufenkci (2010b) and Verástegui-Flores and Di Emidio (2014, 2015), any billet consolidation effect would be significantly more pronounced forfine-grained soils with substantially higher hydraulic conductivity (e.g. siltyfine sand material), which is dependent on the soil gradation. Further, in terms of the experimental set-up, a higher degree of localised consolidation and hence greater gain in shear resistance capacity of these soils could be expected for higher applied extrusion pressures and slower die displacement rates. In other words, under these circumstances, the soil material within the billet’s yielding zone could be partially drained and would therefore mobilise a higher shear resistance capacity compared with its initialsuvalue. Further, different degrees of localised billet consolidation for various
fine-grained soils with the same starting su value would produce different levels of strength increase, thereby mobilising different values of the steady-statepefor these soils. Consequently, the values of the steady-statepe/suratio for these soils would be different.
It is the author’s opinion that billet consolidation, combined with data analysis and extrapolation issues discussed in the following sections, largely explains the very widepe(LL)andpe(PL)value ranges reported for various fine-grained soils investigated using the RE apparatus with set R and v values– that is, consistent with the data trends evident in Figures 11, 12(a) and 14(a),fine-grained soils with lower plasticity, which typically have higher hydraulic conductivity, generally mobilise significantly greater values ofpe(LL)andpe(PL). As such, the extrusion approach may not be a reliable method for undrained shear strength determinations on low-plasticity soils, producing unconservative (high) shear strength values if some localised billet consolidation occurs during the testing. Counteraction measures include reducing the apparatusR value, thereby reducing the pressure values required to cause extrusion, and (or) increasing the die displacement rate, thereby reducing the time period over which billet consolidation could occur. Other potential shortcomings of the RE experimental set-up include required maintenance of the extrusion chamber and the risk of the die jamming, particularly considering the high extrusion pressures required as the PL water content is approached.
Soil remoulding toughness,T
Compared with the predefined shear surfaces for direct shear and shear vane strength-measurement methods and the shearing plane or general plastic deformation of the test specimen for triaxial compression (e.g. see the papers by O’Kelly (2013b, 2013c, 2015)), the extrusion process is distinctly different in that it involves plastic flow of the soil element through the die orifice. At the PL, clayey silt and clayey silty sand materials have slight toughness, whereas low- to medium-plasticity soils have medium toughness and high-plasticity clay soils have high toughness, toughness here referring to the effort required in (re)moulding. As such, soil with greater toughness would be expected to provide higher resistance to extrusion – that is, greater energy would be
required to cause extrusion, noting that the extrusion pressure against die displacement plot can be regarded as the work or power diagram of extrusion.
Typical bi-linearT–wrelationships determined for clay soils using a PL thread-rolling device developed by Barnes (2013a, 2013b) are presented in Figure 15. In thisfigure, the plastic range is subdivided based on the deduced toughness relationship into an adhesive (sticky) plastic region and workable soft- and stiff-plastic regions, as delineated by the reducing water content values of wL, wT, the stiffness transition (wST) and wP. For water contents within the adhesive-plastic region (wT£w<wL),fine-grained soil exhibits zero toughness. In this instance, for given apparatusRandvvalues and a truly undrained condition, the steady-state extrusion pressure value is entirely controlled by the soil’s undrained shear strength. Based on experimental data for rolling out of soil threads presented by Barnes (2013b), measurable toughness forfine-grained soil is typicallyfirst evident atIL≈0·4.
For the water content range of wP£ w< wT, however, it is the author’s contention that the steady-state extrusion pressure value relates to the soil toughness. Compared with low-plasticity fi ne-grained soil, greater toughness for higher-plasticity soil would be expected to provide greater resistance capacity to extrusion for water contents in the workable soft-plastic and, in particular, stiff-plastic regions. This interpretation is consistent with the earlier observation in connection with Figure 12(b) of overall increasing value ofpe(PL)with increasingIP. Further, as discussed in the next section, whether plotted in normal, semi- or double-logarithmic charts, the su–w (and hence steady-state pe–w) correlation can generally be expected to be piecewise linear. This can have major implications for the reliability of regression analyses and extrapolation of steady-statepe–wdata.