I i i iii
THE ECONOMIC
RESEARCH INSTITUTE
MEMORANDUM SERIES
NO. ~1
Recent Demographic Developments in Ireland
by C. E. V. Leser
February 1965
Confidential: Not to be quoted
until the permission of the Author
THB ECONOMIC RESEARCH INSTITUTE
Recent Demographic Developments in Ireland by. C. B. V. Leser
February 1965
I. INTRODUCTION
The history of population movements in Ireland presents many unusual ffeatures in comparison with other countries of the Western world. The effect on natural population increase of a high a~erag.e age at marriage, together with a high proportion of men and women who never marry at all, was offset by. a large family size in married couples; the natural population increase in
¯ . ... .
turn was offset by a high emigration rate, resulting, until quite recently, in a steady decline in population size.
There have been some indications in.recent years to the effect that these tendencies, i.f not re- ’ versed, are at least being modified. The appearance of the 1961 Population Census volumes, together with the
Reports on Vital Statistics up to 1962, permit an analysis of demographic characteristics for a time not too far
removed from the current date. Comparisons may be effected with the position at previous dates, though no
. ;, ..
attempt will be made here to go back further than 1926, the year of the first Population Census in the Free State.
The analysis presented here does not claim to ’ be ex~ :,:stive. The improved collection of vital
statistics introduced in the 1950s now yields a good deal of m’aterial which awaits a more detailed analysis. Some of this work may be done officially, other parts may
be left to this investigator and others working in the field of population. Interrelationships between population and economic factors are only toucbed upon
. 2
--here, and no .pro ection bey.o~d the near. future has yet been made .
All that is attempted is to study some of the salient features in the fields of deaths, marriages, births, labour force and migration. The method of indirect standardisation, in which actual figures are compared with t~ose expected on the basis of some assumption, has been extensively applied.
2. MORTALITY
The crude death rate, represent.ing the number of deaths in relation to population size, was in the region of 14 per thousand from the 1920s until after the war, when it fell to a lower...level of about I~ per 1,0©©; since the early &95©s there has been noL~oticeable ¯further change. However, the crude death rate is not a fully satisfactory measure of mortality, and it should not be concluded that mortality conditions have remained static
in the last decade.
¯ . J ,d",’ . , ,:
The best. way of measuri~g-.mo.rtai:it:y,,:i~s ~by mean s,-~ of the life table, showing the number of persons out of an initial total which, at existing mortality conditions, may be expected to reach various ages. Official life tables have been published for the average of three years around each Population Census, the most recent one
referring:Lie the years 1950-52, though no doubt, a life table for 1960-6~ will be published in due course.
Whils’t:.the construction of a full life. table is laborious¯, there i8 no difficulty in eomputi.,ng an
¯
. ..’, . ¯ ,
- 3
-¯ ; . .’ . ..
being based not on an exact population count but merely on an estimated; age’di’Stri:bution of the population, are
.,t ~ . ’ .’. ;.i
more tentative and hive ’only Been used to estimate the
[image:4.597.54.492.27.821.2]life expectation at birth. ~
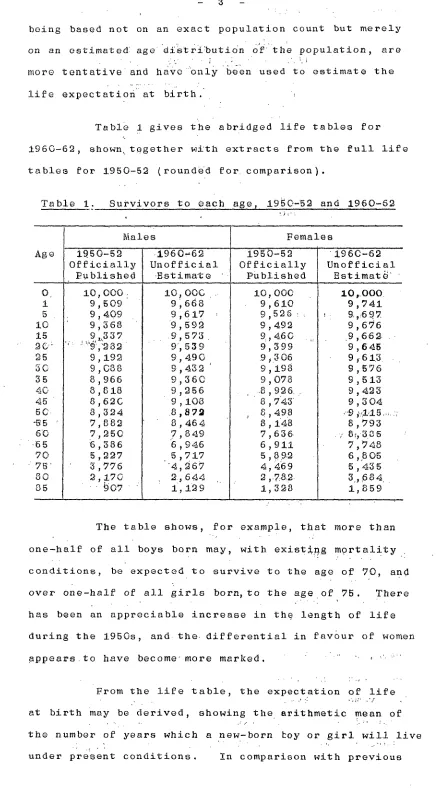
Table i gives the abridged life tables for 1960-62, shown, together with extracts from the full life tables for 1950-52 (rounded for. comparison).
Table i. Survivors to each age, 19~©-52 and 1960-6~ ’.) i’ .
Males Females
Age
i~5o,5~
.1960~6~1950-5~~
.196CL62-Officially Unofficial Officially Unofficial Published .E.stim~Ze Published Estimate’ ’
O 10,OOO. lO~OOG iO,OOC 10,.000.
1 9,509 9,668 9,610 9,741
5 9,409 9,617 9,526:.
10 9,~68 9,59~ 9,492 9,676
15 ...9,573, 9,460 ,,
.9,66~,.-9C= ’" ~’9’,’~82 9,539 9,399 9,645
25 9,192 9,490 19,,$06 9~’6!3.
30 9,088 9,4Z~’ 9,198 9,576
35 8,966 9,360 9,078 9,513
40 8,818 9,256 .8 926. 9,423
45 8,626 9,108 8 , 7’43" 9,~O4
5C’- 8,324 .8,87~ 8 , 498
"55 " 7,882 8,464 8 , I48 8,793
60 7,250 7,849 7,6~6"
65 6,386 ’6 , 946 6,911 7,748
70 5,2~7 5,717 5,89.2 6,805
~,776 "4,267 4,469 5,485
8O 2,17G 8.,684
85
¯.~ov "
l~lI~ 1,3Z8 1,859The table shows, for example, that more than one-half of all boys born may, with existing mortality
.’ . . .
conditions, be expected to survive to the age of 70, and over one-half of all girls born, to the age.of 75. There has been an appreciable increase in the length of life
during the 195Os, and. the. differential in favour of women appears.to have become more marked. ’
4
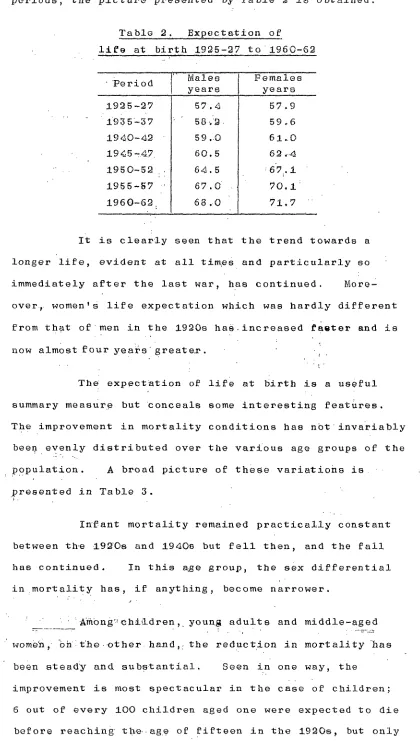
[image:5.595.76.496.60.801.2]-periods, the picture presented by Table ~ is obtained.
Table 2. Expectation of
llfe at birth 1925-27 to 196©-62
"’Period 1925-27 "21.935-37 1940-42 1945 -.47. 1950-52 :[ 1955-~7 ’ 1960-62
"i ,
"’ N1ales years 57.4 58 ..B. 59 .,0 60.5 64.5 67.0 68.0
Females years
57.9 59.6 61..0 6 ~ ..4
70.1: 71.7
It is clea~ly seen that the trend towards a longer life, evident at all timgs and particularly so immediately after the last war, has continued. ~orei over, women’s life expectation which was hardly different from that of men in the 1920s has.increased faster and is now almost four yea~s’greate.r. .~
The expectation of life at birth is a useful summary measure but conceals some interesting features. The improvement in mortality conditions has n0tinvariably
beeg.evenly distributed over the various age groups of tile , population. A broad picture of these variations is¯ ~
presented in Table 3. ~
in’rant mortality remained practically constant between th,e 19~’0s and 1940s but fell then, and the fall has continued. In this a:ge group, the sex differential in mortality has, if anything~ become narrower.
/ .
.... .... AmOng’:~Chi&dren,, young adults and middle-aged ’ women{ ’bh[t~he.other hand,: the reduction in mortality has
been stead;y and. substantial. Seen in one way, the
5
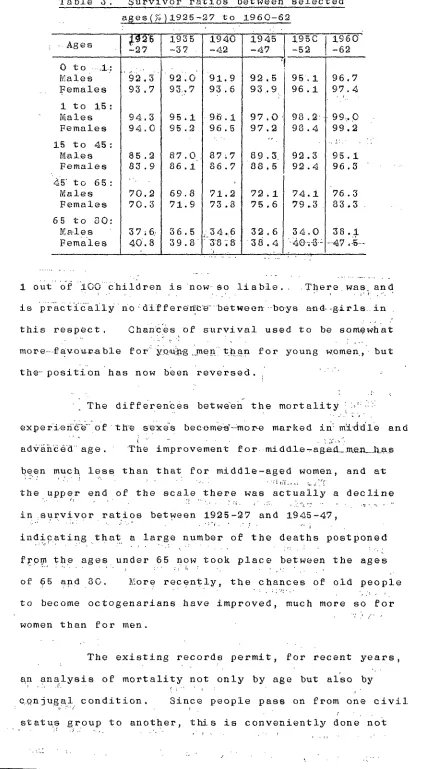
-Table 3. Survivor ratios between selected
.... ages.(7~,)1925-27 to 1960-62195C
1960’-, 1960’-,1960’-,
I
.--3,,?, : ... ,
1935 1940
1945-47-5’/-
-62
0 to .,13
~f
~ales
92.3
92’.O’ ’ ’91. 9
92,595.I
96.7
Females
93,7
93,7
93.6
93,996 .1
97.4
1 to 15:
Males
94,3
95 .i
96.1
97 .O98.2:
99..OFemales
94.0
95.2
96.5 97.9. 98 .4 99.2i5 to 45:
Mal.es
85 .2
87.0
87;789.3.
92.3
95.1 Females83.9
86.1
86.7
88 .5
92.4 96.3%5’ to 65:
Males 70.2 69.8 71.2
79..1
74.1 76 . 3 Females 70.3 71.9 73 .875 .6
79 ..3
83.3
65 to 30:
~a:les
37~6,
~6.5
i 34.:6
32.6
34.0
38 .i
Females
40.8
39.8
3"8.8
38 .4
" &@’;-3-
... 47 ,-5 ... ).., ... . ...
I out of l©O children is now..So liable,. .There was and is p~"ac£ically’no’:differe~t’e"between...boys a-nd.. -girls.. in . this respect, chan:¢:es of survival used to be som.ewhat
. .... .i; ,. <’ ; ... more...favou.r..able forN:o/u!,n,g...merl..t".n...an for young w.omen.,, but
the--positionhas now been reversed. ,, " " ’ -:
The differen’ces betwe"en’ the mortality : :..’: "::
experi-efic:~-"".of ~he sexe"s become4’-:,mor-e marked in: m~iddle and
: :,-, ’)
ad~rai~de’d¯ age, " The improvement: £or¯ midd.le-~aged_.,nten_...h,a.,~
been much less than that for middle-aged women, and at’; .;" .’, .’ ’ i .¯’. ., . " .. ..., ,,,.~,. .... ~. ,~ ./~.
the upper end of the scale there was actually a decline "’ ’ q " " ~ "’ ’.; ¯ " ~’i. ,’ .:’-. . .i~.-i...,." ... .~ ,..,, .. in :surviv0r.ratios between 199.5-27 and 1945-47,
indicating that a large number of the deaths postponed
.:,.:,~ ’, . :" . ’. . :,. , , . "..’, ", ": . . , ¯ .,: . : , : .,..
f~om the ages
under 65 now took place between the ages
of 65 and 80 ~,~.ore recently, the chances of old people to become octogenarians have improved, much more so for women than for men.The existing records permit, for recent years, an analysis of mortality not only by age but al’so by c.onjugal condition, Since people pass on from one civil
status group to another, this is conveniently done not
.... ’,’1 ,i; .." ". .... ’. ¯ , ¯ ,... . , ..
[image:6.595.61.482.52.821.2]6
-by means of life t~bles but~. -by :standardisation. For the years i960-62i .the 6x~c.ted number of deaths among single, married andwidowed males has>been. computed on the assumption tha’t thJ death rate-of each single year of age was the same ~or each conjugal condition group, and the age structure of the three ~roups alone
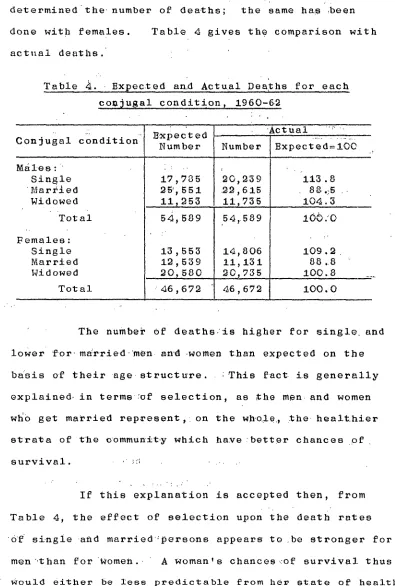
[image:7.595.101.486.55.537.2]determinedthe-number of deaths; the same has’,been done with females. Table 4 gives the comparison with actual deaths.
Table ~. Expec.ted an.d Actual Deaths for each conjugal condition, 1960-62
¯ , ’Actual .~. ~onjugal condition ~.xpected
Number Number Bxpect ed=l©C Miles:"
Single 17,785 20,239 I13 .8
’Marrled e5’,551 .~2,615 8 81 ’i~ 5 I " Widowed 11,253 ... 1.1,735 104.3
Total 5~,589 54,589
100.’o
Females:
Single 13,553 14,806 109.2
Married 12~539 11,131 88.18 ’
Widowed 20,580 ~q,735 i00.18
Total 146,67~ 46,672 100.0
The number ef deaths:is higher for single, and lower¯ :for. m~rried,’men an’d .women than expected on the ba"sis of their age. structure.. ~This fact is generally explained, in terms :of selection~ as ,the men. and women who get married represent,, on the wh’oie., .~he healthier
st ra~a of the o ommunit.y which ha~e .better chances of survival. , ; ~ $ - . i . , .
[image:7.595.92.487.190.776.2]If this explanation is accepted then, from Table 4, the effect of selection upon the death rates 0f single-and married;persons appears to .be stronger for
- 7
-influence upon the chances of marria.ge .than in the case ¯ .. i...
Of men. ~" " " ’. "i ..
Alternatively"r- iZ_/iS possible that marriage itself has a beneficial effect in reducing mortality. There is some supportfor this view in the.~ao~...that
°:. , ,,
mortality is higher for widowed than for married men and women, a fact.-.which..., is not.. easily explained ’ ~..~ethelrwise’
¯ . . ,.
Incidentally) one effect.of the sex ...
differences in mortality, is that..aimost one-.half of the women who die are expe’cted ire, and,do, die.as Nidows; the same applies.to ifttle more than one-f.if~h:’of all
men,~
, . -,
. - ’’ 2"" .’, .’l ¯ Z"
’: ,.., . ~ NUPTIALITY
(" ..
For the l’ast few decades,: ,the. number of
marriages has kept fairly stable near the 15~OOO mark, and the marriage" rat’e" at about 5 mar.riages per thousand
¯ ~ population, The marriagb rate. ¯reached a peak of about ." . ..
,6 per thousand duri’ng "th~ period 1942-46, after which ::2time it settled" down it a somewhat lower level~ around
., , . ,.;
5.5..
.. ,..
’ ’:;"" .On:e mi, ght be tempted to conclude t hat":’~"he’ .; 4:ncreasing"inclination to marry evidenced by"the’ :marriage boom of the 1940s is a merely temporary phenomonon.~.,r~trhis overlooks the fact that the number of marr~ag~S"in-.;bnre period affects the ...numSe~’ of marr,i.age.able persons, i.e.
¯:! . ¯ ..
single and widowed ad01~sCents .and adults, in the
., :: ~. . ",. -....
population and thus the numbe.r .of; marriages l.ikely to result in subsequent periods.’iwi~-,h g:iven marriage habits.. ... ’
. °
. . ~ ’/ . .,. ’, ...
’ : ’) ...
8
-. ’ -.-.-. : .
marriage’ "r:ate; are shown in Table 5 for the average of
three years around":ea’ch’Census data.¯ Measures o£ N up~tialit~y,
Ta ble 5 1 ...
~.
.
1925-27 to 1960-62
i ’’ :"
P’eriod
1925-27
1935-87’
1940-42 1945-471950-52
1955-57 1960-62Marriages per thousand of
:
singie and
widowed, aged
PopUlation
15 andover
~Men Women’
4,58
4:95 .... "
5.31
5.69
5.395.50.
29.7
1.9
21.8
23.6
23.~
24.7
25.8
28.2
25.7
27.9,
27.9 29.5... sO. 1
so. 6
# ’i’.. " " " ..,. . i t ¯
It is seen that in relat:ion,.to the .number of marriageable men and women, the number .of marr,iag, es has
shown no ,sign o£ decline, but on the co, ntrary t,he ratio
is still increasing. The ratio of mar.~iages,:.per¯- ~ : ":
marriageable men has grown faster than t.h:e ratio per,. , , ,. .. ,
marriageable women recently, on accountof the fact that the surplus o£ single and widowed men over women has been
reduced ’~rom"SO,O00 In 195i to"fewer ’than 16,O00 in 1961. It was,said~hat Single ~0meii used to emigrate"to Britain
& , t ..: .. ,. ., .: m ,
¯ to.increase tti~fI~ chaneesof find4ng a husband; if so, it seems that ’with g’rdwing readiness" of young men to enter .the margined ’st’ate this is no longer" an important considera~:io’n~’ ~
i ~ ’i ". ’ " ’ The marriage rate varies considerably, from . area to area. To some extent this is due to the
:~ ,q [, , ~ :. .? :J’,9,q.
celebr;atibn :ahd’ registration of marriages outside the area dr’ t.he groo~,"is resident’e; the statistical
. . .~ . information available now permits correction for this
factor.
-- 9 -- ¯
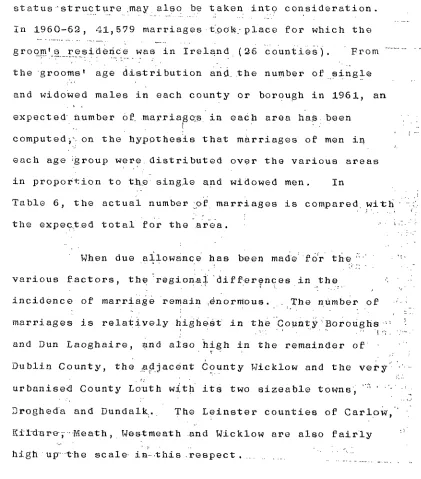
sta’tus’structure ,may also be taken into consideration.
in 1960-62, ,&I,579 marriages t~0oM-place for which the
groom’s residence was in Ireland (~6 Counties). FPom ...
7 ~-"Y-: i: ::" : ~
.
.
the grooms’ age di.s~ribution and.~the number of single .L.
and widowed males in each county or borQugh in 1961, an expected-number 0f. marriagoTs in each area has. been
[image:10.595.71.492.39.518.2]computed~’, on the hypothesis that marriages of men iN each age Sgroup were. distributed over the various areas in proportion to thesingle and widowed men, In
Table 6, the actual number ~p.f marriages is compared with ....<. the expec.t.ed total for the ¯area. .,i,,:.:.:
When due ailowa nce has been made~fo’r’ %he ::" ’~’
¯ . , ~ . .~[ ¯ ..
various factors, the:regionlai "differences in the .’. .. incidence of marrilge ¯remain .enormous. The number o~ .,.i marriages is relatively highest in th~"ounty:Boroughs.~ :! and Dun Laoghaire, .and also high in the remainder of " Dublin County, the @djacent Co.unty Wicklow and the very"I
’..-’/,J, urbanise;d County L0uth with its two sizeable towns’)":’~’ ’" : Drogheda and Dundalk. The L@inster counties of Carlow," ~i~dare’;".Meath, Westmeath .and Wicklow are also fairly ~: high up"the scale, in-.this .respect ...
]~elatively ,’few marriages...toqk: :pl .a..c,e i.n: .,t.he Connaught and ¯Ulster couffties, in Cl~are and Kerry, as
well as in Ki!kennyi, i aois and Longf0rd. 0~,f~ly and most of"%he Nunster counties, excluding ~heir County Boroughs, occupy an intermediate poslt~on. .~.
i mq~
... ! ,, .i’" ;’, ~[
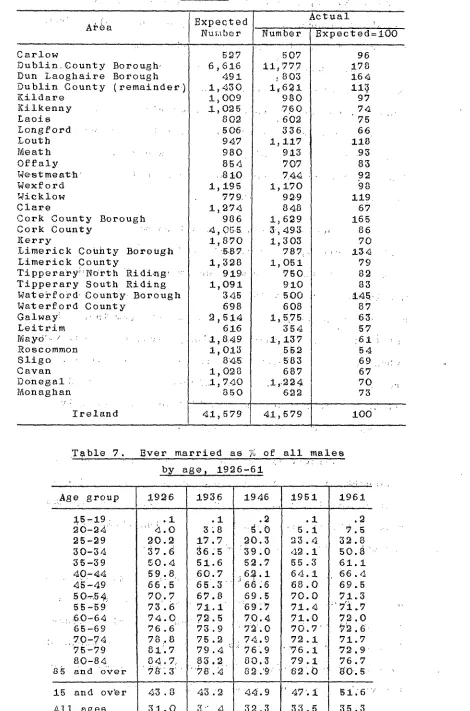
..’ The ~ffec~ oP the higher marrigge rates, has been to ¯reduce th~ :prop0rtion. of single ~ersons .a~d conversely to r’aise the proportion ’o.f married persons
.. ,
in the .~opulatio."n¯. Table, 7 ~how..’s> t.he;, plroDor~io~.:s’: ...." of ever ma.rried (married and ~widowe~) a.mong total ma..!es Per variou:3 age groups fat each Census date ...
i0
-Table 16; ’ Bxpec~ed.,and .actual marriages in.eaoh :area,
1960-62.
. :.
: . ¯
, ....
iExpected
Actual
A~ea
Number
Number Bxpected=lO~
.-..,
., - , ..,
~arlow
527
.. 507
96
Dublin..County Borou.gh,
6,616
iI,77~ ...
178
Dun Laoghaire Borough
491
: 803
164
Dublin County (remainder.)
..i,4~0.
1,6~1
11~
Kildare
1,009
98O
97
Kilkenny
. ’,, .,
!,025 ... 7.60
7~
Laois
802
¯ 602
75
Longford
’ -,-
,506.
586.
66
Louth
947
1,117
118
Meath
.. ,.:
98O
.
913
.93
0ffaly
85&
707
83
West meat.h ’
:
:
...810
I : 7.44
9~
Wexford
1,195
i, 170
98
~licklow
779
9~9
119
~lare
1,274
848
67
~ork County Borough
986
1,629
165
3ork County
.. ;. : ,:
.4,05.5.,
3:, 493.
,,
86
Kerry
Limerick Couhty BoroUg.h ’
1,870
’’5,87.
1,303
787~ .
, , .. 134
70
Limerick County
1,328
i, O51
g9
~ipper a Py~ ’North Ridi.ng.’ "
;:’ 919,~
’
gSO.
82
~ipperary South Riding
1,O91
9i0
83
Waterford. County. Borough
345
: 500
145.
Waterford County
698
608
8V
~alway
..’ ,:: ’,...
2,514
1,575
.
63.
Leitrim
61G
154
57
[~ayd"- / .. :
:
",’’1,8,49~oscommon
" ~1", I~7
:61
: .
1,013
552
54
$1igo
’.
.: 8’4,5:
... 583
69 ...: ,
?, avan
1,0#8
687
67
Donegal ’
. .. ...I,7.40
.i,.224
70 .~
~6onaghan
850
6~2
73
, .,,,,
~I
’’ ~" ... . ....,"’ ~, ’T’" [image:11.597.74.544.91.802.2]Ireland
41,579
41,579
I00
Table 7. Ever married as % of all males
by age, i926-6!
.;,_.} -.:,
Age group
1926
1936
1946
1951
1961
!5-i4.:.9 . ..,.
,.i
.i
.2
.1
.2
90-2
’~%.0
3.8
":5,1 ’~.525-~9
90.o
17.7
20.3
23.4
30-~4
~7.6
36.5 "
~9;0
42. I
5o.8
35-39
50.4
51.6
52.7
55 .Z
61.1
40-44
59.8.. 60.7
.62.1
64.1
66 .d
45 -49
66 .5
65.[~ " ’
’ 66 ;6
68 .O
69.5
5 0.-.54:
70.7
67.8
69.5
70.O
71 ..3
55-59
71.1
’"69 ;7
71.4
:. 6o-6,~ ..
74.0
7~.5
70.4
71.0
7~ .0
65 -69
76.6
7~ .9
’7:2’.0
70.7’
~.6
.~0:-7’~
78 .8
~5. ~ !
: 74.9
72.1
71.9
¯
The proportion of males who are married or widowed has risen steadily since 1936 for each age group under 55 as well as all ages combined, though there have bee.n,,some..d,e. Clines in..,.t:he ~p’pe~ age gr, o’ups.. There are some n.oti,ceable :differendes:i:n t.iming; ’~:f-Or men betweefl ’:"’ 4C, and 55, ~Zhe increase i.n-nuptialitywas al’ready:"qdi~te.
:
substantial by 1951. On the~other~hand, the lower a~ge’ ’ gronps and particularly those.’under 30, had .not been
greatly af.fe:cted ..by. then; ,for these age groups the ~’ ;:" ris.in~, propensity to. marry: is largely of"mor, e’ rece’nt " <
ori@in .... i., .!, ’~ ..
[image:12.595.97.496.251.757.2]Since a steep differential in nuptiality be tween~:.largely urban and &argely rural afeard, has been not:ed, .it may be s~rmise.d that..the Ob.se.rved incre’a’se in ¯ nuptiality..iS..to ~9~e’ exten~..rel.a~ted.to, the inc.r~as’ing 1... degree of. u rban.isation. .~. Table..8 throws some light upon.~> this point,
Table. 8. Proportion -of males,. in .town .a~eas,~and.~ proportion of @wet married males in town a~d .n~al .areas .~.
19~6-1961. " :’ "" r ’ "., " ,.: ". "
Bver marrie~.~..as ,/~. of all ,ma!es~. Year. ~ales in :t0wn areas
as ~. of all males Town Areas ~ural .Areas..:,.. ¯
19~6 50.0 .. 30.1 ~:, , ... ....
1936 33 .i 33.8 30.2
1946 34.5 34.6
~’I.~
: "" ’~ ~
1951 38.7 35.6 32.1
I’961 43 .2 3’7.7 ’33.4
:~(’, i
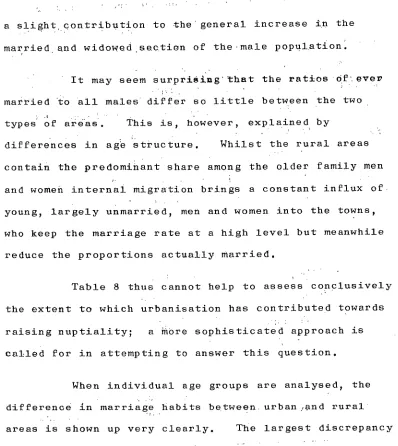
a slight contribution to the¯ general increase in the married¯ and widowed sec.tion of the ,male population.
’ It may seem surprisimg’ ~hat the ratios Of-. ever married "to all males differ so little between the two types of areas. This is, however, explained by
[image:13.597.95.493.58.504.2]differences in age structure. Whilst the rural areas contain the predomihant share among the older family men and women internal migration brings a constant influx of. young, largely unmarried, men and women into the towns, who keep the marriage rate at a high level but meanwhile reduce the proportions actually married.
Table 8 thus cannot help to assess conclusively the extent to which urbanisation has contributed towards raising n.uptiality; a more sophisticated approach is tailed for in attempting to answer this question.
When individual age groups are analysed, the differenoe in marriage habits between, urban .,and rural~ areas is shown up very clearly. The largest discrepancy is found, i.n- the-"agegrbup 30-34 years. In 1926, the ’ proport.ion of malesWho’are married "...Or Wido~ed ’~as 53.6Zo": " "
in town .areas but only29.4~ in rural areas; the
corresponding 1961 figures are 66.8% for towns and 36.2% for rural areas.
13
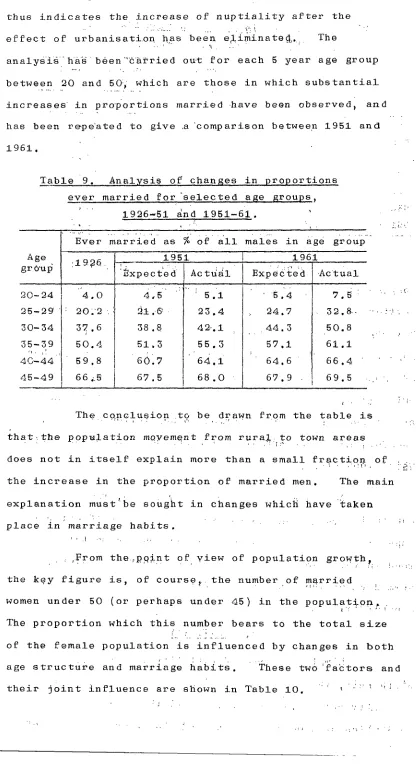
-whilst a comparison of expected and actual 1951 figures thus indicates the increase of nuptiality after the effect of urbanisati.on h.0s been eliminate~... The
analysis"hasb&en"Ua~ried out for each 5 year age group --: . ,. .z .... .
between 20 and 50:,’ which are those in which substantial increases in proportions married .have been observed~ and
¯ .., . ...
[image:14.595.74.490.53.823.2]has been repeated to give .a "comparison betwee.n 1951 and 1961.
Table 9. Analysis of chan~es in pr..pportions ever married for "selected a~e groups~
19Z6-51 gnd 1951-61.
.., ~.. ¯ ... .., .. ,. . .... ¯ ... Ever marrmed as ~ of all males in age group Age grO’up :19~6 20-24 25-29 30-34 35-39
40-44 59.8 45-49 66 ~.~ I ... f ... I
1951 1961
:~xpect:e d Act~gl Expected .Actual 4.0
’20;2 32.6; 50.4
~ j. 5’ 2
-’J1 .e
38.8 51.3 67.5 ~ 5.1 25.4 42.1 55.5 64~.1 68 .0 t , > 5.~ 24.7 44.3 57.1 64.6 67.9 32,8., 50.8 61.1 66.4 69.5 .,~ .... ~..! .. .~.From the.~ppint of view of population growth,. the key figure is, of courset. the number of married women under 50 (or perhaps under 45) in the population, The proportion which this number bears to the total size
/’ : ; .
of the female population is influenced by changes in both age structure and marriage habits. These two ~fa~tors and
their joint influence are shown in Table i0. ’ " ~ ":: " ’~ :: ." ]
The cenclusion .to be drawn from the table is that..the population movement from rural: to town areas does not in itself explain more than a small fraction of
.... ,~o. ¯ - .~.
the increase in the proportion of married men. The main ¯ , .
z
explanation must~be sought in changes which have /taken ¯ ~ ¯ [
: place ±n marriage habits.
14
[image:15.595.90.568.52.633.2]-...: ...; ". ? ,:.’t ’.; :. ’F :, ~
Table i0. Proportion of women abed 15-49 and proportion married, 1926-1961.. ~ ":": ...
Year 1926 1936 19,41 1946 1951 1956 1961
Women aged 15-49 as % Of all femi~es
48.4 47.9 48.7 48.2 46,1 44.6 42.7
~rried,women aged 15-49
.... ;" "
as % of
~i~ women 15-49 38.5 ’ 38.5 ;, 38.3 42,4 AI’i’ females :18.6 18.,5 18.6 20.4 90.8 ":" 21.2 21 ".5 45 .i
...~ ~7.5 ....:~ :; ...
50.4
¯ ::. ,! i ~ ’ ~... ., . , .’/ The proportion of the .female-population in_the. ...
¯: ; ..
/. ¯ ..:.,
4.
reproductive age group, and the proportion of this / ’:’: section actually married, remained practically constant ~ ... between 1926 and 1:9~i but have¯ since then moved" in ;" ~" opposite directions. The relative decline, in the number
---.) of women aged 15-49 was largely brought .about by
-emigration. Its effect on the number o’f married’ women ~ " of childbearing age in relation to population size was~
..: ’ ~ i’" ’~ ’~ :’ ,’~.’ ! " ,~ , ’" : however~ more than offset by the change in marriage habits w~ich took place.
:
As far as nuptialiZyiis cen,ce.rn~d,: ~he Irish population thus s.eems gearedi~9, a h.ig.her rate :of natural
population increase than before; changes in mortality ....¯ ..:.,~:+ tend in the same direction. Other important factors,
summed under the head’ing Of f’e’rtility, Will be’ considered
¯ ,, , . ,1[
.. ... ;
separately.
¯ , ~.~,~-~[~.: ’" .~ ;";~ .. ,~ : ’!~:"~ ; : :".’" ~-~," i~,.
4. FERTILITY
¯ :~’-" :) ; : ’ : ’ " ’ , ~ 7::i! " * i"J’ .’ ’ ’ .: ’4 "~ i.[
Simple measures of,,fe.r~ti!i;ty...a.re,.the,,.,crude,
,birth rate, tke z~neral fertility rate, a~n.:d the:legitimate : ....! ¯
fertility rate, i.e. the .r.atio o.f births .,to t o~tal ... :! . ,i,~: ~ ~.,-population or number of women aged 15-49, or the ratio of
- 15 - ,
[image:16.595.56.495.32.783.2]take to a different extent the age and civil status distribution of the: population into account, they tell a somewhat di.fferent story~ as seen from Table li.
Table il. Measures of fertility, 1925-27 to 1960-62 (3 year average).
Years
1925-27 1935-37 1940-42 1945-47 1950-52 1955-57 1960-62
Total births per 1!000 Total
population 20.6 19,4 20.0 23.0 21.5 21.i 21.6
Women aged 15-49
86 .2 83.1
83.0
96.5 95.1 i, 95.5 ¯: ~01.6Legitimate:births per 1,000 married
women 15-49 217.5 208.5 "
209.4 219.3 205.4 i97.5 1’98.3
Until the end of the last war the .three
indicators moved very close,.ly together, showing a fall in the birth rate in the 1930s followed by a,.~ecovery. During the first ten years following the end"of the war the number of births per married women of childbearing
¯. :,
.F
age declined¯ by about one-tenth; this was partly offset , . . .. .
by higher nuptiality,, but .unfavo.urable ¯changes in age ¯ .t , ... , . structure helped to re#uce the c,pude birth rate. More
:’ ~, "~ : .:.
recently, the decline in legitimate fertility appears to have been arrested an,d the rising proportion ’of married women offset the changes in age distribution, to keep the
.:: i.. i ,:: :’ crude birth rate stable.
F0~ a more rigorous analysis, it is necessary . to take into account changes in age distribution within , ~ the group of women aged 15-49. For 1960-62, the age
- 16
[image:17.595.86.520.44.746.2]-group ;had ,-ap:plied.,.t,o.women of .each ,age g.r:OUp at the , . previous .Cens~ds dates The second¯ set of, ¯expected
figures uses the 1960-62 legitimate and illegitimate age-.[.’,....V:i. %-".~./._.,~.
appliedt0 m~rr.ied"w0.m..en-and specific fertility rates~
to sing-l-~.-o-r ..wi:d[o.wed,.women..o~.__ea.ch age group s..eparat..ely.... In Table 12 tl~;i:~estiJ;l~s are.. compared with the actual birth fate’S: ’ ~ ... :’ ,’ .... ~
Table ~2. Bxpected and actual, birth rates~ .,1925-27 to 1950-6~ (average): _.
I
Births per t~O:usand population (3 Y~:a:r average)
:i ...,. ’- Expected on basis of Period
1925-27 1935-37 19’40-42 1945-47 1950-52 ~1955- 57 1960-6.2..
": "Age’ structure A g:e. andmarital. status structure, ..
25.7 19.3
.,li:! :19,1 :
26,.7 - 19.6
26.3 9.2.1
25.1 22 .O
’ 23.6 ... ~’~ " 21.5 , , 2~,. 6 ... 21.6
:- . "’’ .i-.- ;,;." " ’ ,’,.’~;. ’."
Actual
gO. 6 19.4 20.0 23.0 21.’5
2:1-’.’1 , .., 9.. 1..6
The act~al"~odrse 6f the~cwude~birth rate diver’ges sharply~f~Om that. of the rate expected on.the basis<o~ ’the’ag~!@truCtUre but very little from ~hat
~xpec~edC’onac~6~fi~iof ag4 ,and.civil ,star.us ~d~s~ribution. This .m~y b@ interpret~d as saying that the birth:rat@ is largely explained by the number of married.women.in the various childbearing age groups; changes in the number
j.,...:...:,! , .
. " ., .~’:. ,~,,.., ,.
of children born per married woman of a given age group !:~.’":’" ¯ ,i ~ ¯ !~ ’ ’. "’~’ . .:,t,. .. ... ; .].., ...,. appear to be minor in character.
i! , , ~ ~ ’Int@r-area differehces in t;he.,bir.th, rate’may.¯. be anal~jsed in th’e:smme way as ,chang&s over time. The! : res~t.S: fOr’l960~6~are pP:e~en,ted~in T~b.le., IZ.. , :-~,- : ,. ,, .,, .., ..’: ~. ; !..., :~, ,. . (" . ; :: , ".~. ~.. ,.
17
-’Fable 13. Expected and actual birth rate by areas~ 1960-62.
Area
Carlow
Dublin County Borough Dun Laoghaire
Dublin County remainder Kildare Kilkenny Laois Longford Louth Meath Offaly Westmeath : Wexford Wicklow Clare
Cork County Borough Cork County
Kerry
Borough Limerick County
Limerick County
Tipperary North Riding Tipperary 8outh Riding Waterford.County Bo~oug] Waterford County Galway Leitrim Mayo Roscommon Sligo Cavan
Donegal. : Monaghan
Ireland
Births per thousand population per annum
Expected on basis of
Actual Age Age and civil
structure status structure
20.07 :21.71 24.91
26.99 26,16 24.19
25.47 24.12 92.84
27,11 30;63 27.10
20.42 23.95 24.40
19.19 19.~1 19.49
19.87 20,65 21.92
18,25 17.95 20.05
23.49 2~.51 23.54
19.96 21.39 21.71
19.95 21.96 23.46
20.46 21.28 23.il
19.91 21.13:. 21.25
21.89 23.61 22.40
17,79 17.O3 18.46
24.83 24.58 25.33
20,18 19.98 20,12
18.10 17.46 18.aO:
24.82 26.46 26.14
18.56 17.59 19.70
19.98 19.87 21~96
19.31 20..40 25,61
25,22 26.5.9 ~4.66
19.57 20.20 19.85
18.50 17.55 19.50
16.43 15.44 17 .O0
16.90 16.:47 17.~7
17.39 16.97 16.28
18.75 18.O2 18.53
18.O1 17.67 18.6g
18.39 1~. 39. , 17.10
19.~5 ¯ 18.95
<
21.57 91.57 91.57
- 18
-The birth rate is high in Dublin city’"ahd county and in thev ne:ighbo.~ ~’.... r lng counties, as well as in the county ’ ....boroughs of Cork, Limerick and Waterford, whilst a low
... ,.
... b~r’tli ¯rate is found for most. of the western counties. ¯" "’"i
...The actual’birth rate is generally close to the rate expected 0n .:t~e basi4"of ag-e structure and even closer, ’, :.. ., . .. , 9 ¯ .. when differences in proportions of married women..are:’taken
$nte. account." ~If the areas .are ranked by expected or act.ual birth rate~ the rank correlation coefficient
between expected,and actual ¯birth rate is .900 for the.,first set, and .945 for the second set of expected figures. Thus
.:" ,
local variations-.in age and conjugal condition distribution account to a la@ge"extent for r.eg.ional differences in the
birth rate, and there appear to. be little differences in family formation habi’.ts.
Birth rates by themselves have little meaning, and it is of inter6st to conside~ the level of births in relation to the number, required"~fbr replacement of the population. For this.purpose, gross and net reproduction rates may be compute~. The gross~ reproduction rate
indicate~ the number of baby giris~to whom, together with a corresponding numbedof baby boys, ~the average woman will give birth to in the c’ourse of her~li.fe at existing age-specific .fertility ra~es and in the’absence of any deaths
,.. ¯ . [
incurredj by females be£ore the age o’f 5C’. The net re-,i
production rate measure~ the same bu~.with due allowance made
, . ., ,,
for deaths.occurring to potential m0~hers both in childhood and in the hhildbearin’g ,pe.~iod. : .,.~:
T~e gross and ~et reproduction rates are n0t"
perfect measures of fertility, and in particular suffer
<... ¯ .
from the defect thlt fertility is confounded with
L
i.
., , .
19
-figure of i indicating exac*~ replacement, and a difference from I the theoretical percentage increase or decrease within a generation.
For the average of the years 1960-62, the gross reproduction rate works out as 1.877 and the net reproduction rate as !.796, thus indicating, with certain qualification, a natural population increase of 80~
within a g6neration. Fertility is Considerably above the comparable figures for 1955-57 which are estimated as io675 for the gross and 1.580 for the net reproduction rate. It is also considerably above the level of Bngland and
Wales, where the gross and net reproduction rates are similarly estimated at 1.347 and i.$O5 respectively.
A striking contrast with En[~land and Wales is also obtained when the timing Of the births is considered, If a group of women are :’ollowed throughout their lifetime it is estimated that the median age at birth, i.e. the age at which they will have given birth to half of the children whom they will ultimately have borne, is 28.66 for Bngland and Wales but 31.95 for Ireland. Thus English women will have completed more than half their family formation by the time they reach the age of 30~ whilst in Ireland~ women make a greater contribution to population growth at ages over 30 than at ages under 30.
:An ~ttempt has also been made ’~ estimate
regional variations in fertility. Eight group~ of boroughs or counties have been distinguished, and for each of these groups, the gross and net reproduction rates together
[image:20.595.44.498.53.417.2]Table /4.
20
-Fertility indicators in different areas. 1960-62
Are~
[iZnblin County Borough Dublin and Louth Counties ~emainder of Lein~ter Cork, Limerick and
~aterford County Be roughs
Cork~ Limerick and Watez:ford Counties Remainder of Munster Connaught
Ulster (3 counties) Ireland
Reproduction rate gz’oss net
!,683 1,865 2°072
! ,606 I .780 Io978
Median age of mother at birth
(Years)
30 070 30,42 30 o 71
1o925
1.825 1.997 1.889 1. 843 1,877
1.838
I .741 1. 905 1.80i £ .758 1 °796
30.45
31.33 31.20 31.72 31.46
The highest reproduction rates are found for Leinster outside Dublin and Louth and for Munster outside Cork. Limerick and Waterford, where a fairly high nuptiality is combined with fairly high fertility. In Dublin city~ on the other hand, ~where nuptiality is only moderately high and fertility well below the national average~ the
reproduction rates are at a somewhat lower level than for [
the country as a whole. The median age of mother at birth is somewhat lower in Leinster and in the Munster boroughs than in the rest of the country°
On the whole, however, the similarities are more striking than the differences~ The large inter-area variations in the extent of economic development have not
so far produced very considerable ~ariation8 in family formation habits~ and it still makes sense to speak of an Irish pattern of large families~
o LABOUR FORCE AND EMIGRATION.
[image:21.595.82.487.54.321.2]¯ !:; [..- .
~:" - 2i " ~’. "!}.: < ¯ . ...’... ’.’..-" " ". !. :~/’~.:
analysis. The -present analysis will.’t.herefo..r.e .be ,..
confined to the; decade ..1951-61~ some attention been .given
to annual changes. : . i :
In 1951~ iou.t of a population of 2,960~:6.00. there were 2[,272,000 or.4~I.~O~ gainfully occupied. The size of the labour force, declined more rapidly’thantotal .. ., population during the following decade~ with the result that out of 2, 818, 300 persons, only 1,i08~i00 Or 39.3%
i ;i:!
are recorded asbeing, in gainful occupations. In other Words, the labour for~e was reduced by 163,900 persons.
,h v.
This" ~um’ber. ~a~ be’ split up in~o five componehts: : .’.: : 2
indicating respectivei’y the effect Of c~angesJ’ in"t"otal:. :~ ’ population size, sex structure, age:st:ructure,~’coff9ug’a’i : condition structure df.’t.he, female popula.tion~ and changes,. , .’’ . ~
. .’ ~: ¯ . ; !"~. . .. in wo’rk particip.atio.n rates.~ i.e. proportions occupied in various p0pulatie,~ .groupsi
z ,
For this"purpose,’f’our hypoth’e’ticai"’totais O:f."’ ’ ’’[; ~: gainfully occupied are calculated for 196J_, based on 1951. ’? ’ work participati’o¯n rates (a) .for the population as a whole, ..
(b) for all males and al-l~,f:ema, le-s.~ ,.(c). fo.~ :males ,~n.d ...,, "fem-ale~ of each ag:e group:i.: (.d).di’tt0 :but, separating-single,
married and widowed women:... ,..~v The .age groups¯.. ... .u.sed. are.,~.... ’ .:..~ in~div:idual, ages from 14" ’to ~19. (combined’ fo’r married and " ’"wid;Oed-wQmen")"" ,;."th’e:fiVe-year (age group:g 20-24, 25-29, ,. ,,- i..:
40-44, the re’ft,.year a’g4 g~,oup~’45-54, ~g-64, then 65-6"9,:
70-74, 75 and over. From these totals, the cohtribution ../, of each facto~ to the .declinein.the :labo.ar force is...._
22
-Table IB. Analysis of changes in number gainfully occupied~ 1961-1961
Number ¯(thou’sand) Gainfully occupied 1951
Bffect of changes in : total populationi size sex structure
.age s;truct.ure . " ’: conjugal status structure
specific work ,partic~P.ation .mates i. ¯. ¯ !
Gainfui~y occupied 1961
.¯. , i."
, i, 272.0
-61’.i - 7.1 -60.0 ¯ -17.4 -18.3 i,I08.1 ¯ :~ , ’ ,. ¯.. , ~ . , ¯
’: ¯ The major~ p’ar± of the’ explanat:ion thus may be said to l&e in t’he f.ali&n’g popuiati0n ~nd’in the age distribution becoming less favourable, The increasing proportion of married women and changes ,in:w0rk. part ....
~. j . -. , .
icipation rates were also contributory factors. --."’ ,~;~ ’ t’" " " " ; " "
:’.~ ::’: The changes which W0’rk "participation rates have~.iu~d.e.r.g~one ar~e,¯ :h0We’ver~’"flot "u:niform and do not
even all point in the same directidn. "An analysis of ¯ : .
¯ [,
this factor is therefore given in Table 16 in. some dot all.
¯ : ’ Table ~6. Chainsea in w6’#k participation for !. vanious popul’atio,n,.g~0ups~ .i951-61 .... : i: .. ’’.": "
, I
Number occupied.. Occupied as % of’ (thousand) total
Population jgr:oup ": :On: 1951 basis ,:,~: ,. " ...." ’:i ., i "...."
~ale s 14-19 96.6
.... ¯ ,20~:24, - : : 77.5
95-64 588.3
~ ::--~o5- ’,’ "’"" 86.4-Females . , ,, ! ;:
20-9.4 ., ,: ... 47..,2
5-6 ,.I 94.4
65- !I.Q
Married 22.5
Widowed 35.9
All I~ and over 1,126.4
Actual on ’kg’sl
basi
84.3
" 2’.4 ....
587.9 76.9 65.8 50.8 i0~.i ’9.61" 24.3 33.1 ¯ ¯ 1’t! 1,108 Actual ¯64.4.
96 ’. 3 9 5.~ 2:
[image:23.595.106.532.54.789.2]57.8 47.6 57 .i ~ ~7.4"’~ 4.8 28.4 56.2 :i 90.0 ... .95.2i
Whereas in 1961 ao in 1951 about 95. of ~ho men -
prob-years of age are gainfully occupied, there is an increasing proportion of men under 25 who have not yet entered the labour force and an increasing proportion of men over 65 " who have retired. The work force is thus¯ reduced by
about 27~000. This is partly offset by higher work participation rates for single women between 9.0 and 65 which addd.-i i2~000 to the l~abour force. Minor upward
’:
changes in work 9articipation rates for married women and .°
downward changes for single ..women under 9.0 and over 65 and for widows only mean a frnction~l reduction in the number
gainfully occupied.. :-. . ~*~.
Changes in population size and age distribution, with their repercussions .on the labour force, may likewise be considered.¯ as the joint effect of two factors, one of them being the natural, ageing process combined with
births and deaths~ the. other one e:xternai migra.tiofl.
It i~ of some interest to see what would ¯have happened to the popu.lation of the dountry,..±n,the"absence of emigration, This has been estimated by assuming the same number of births from the second quarter of 1951 to the first quarter of 1961 as actually registered, the mortality conditions of the 1950-5~ life tables applying
for the first five years and those off the abridged 1960-62 life tables applying for the second five years of the
intercnncal period. Table 17 compares this hypothetical 1961 population with the actual one and the effect of migration is obtained by difference, It should be noted that no allowance has been made for loss of births to
24
-Table 17. Hypothetical and actual population by a@e~ 1961.
-it
Age
Males (thousands)
Females (thousands)
group
Without
Bf fe’ct of
WithoutActual
Effect of
imigration
Actual
migration migration
migration
O- 4
149.8
153.4
+3.6
143.8
147,4
+3.6
5- 9
151.1
147.0
-4.1
145.4
140.7
-4.7
10-14
158.4
148.3
-10.1
151.1
140.5
-10.6
15-19
142.6
120.3
-22.3
136.9
113.5
-23.4
20-24
131.6
80.4
-51.2
127.3
77.6~
-49.7
25-29
124.1
72.3
-51.8
114.1
73 .I
-41.0
30-34
103.5
75.2
-28.3
95.2
77.5
-i7.7
35-39
97,4
81.6
-15.8
96.8
85.2
-11.6
40-44
9Z .7
84.8
-8.9
92.7
85.5
-7.2
45--49
98.2
89.0
-9.2
95.2
85.6
-9.6
50-54
88 .i
81.7
-6.4
81.9
75.4
-6.5
55-59
74.2
68.6
-5,6
72,8
67.5
-5.3
60-54
70.3
64.4
-5.9
71.3
66.6
-4.7
65-69
50.2
51.1
+0.9
53 .I
52.3
-©. 8
70-74
41.2
44.1
+2.9
45.0
48.7
+3.7
75-79
29.1
29.7
+0.6
32.2
33.5
+1.3
80--84
17.6
16.7
-0.9
21.6
20.4
-1.2
5 and over
6.9
7.7
+0.8
10.0
10.8
+O. 8
All ages
1,628.0
I, 416.5
-211.5
I; 586.4
1,401.8
-184.6
Net migration thus appears to have reduced the size
of the population by about 396,000 during the las~ decade~
males accounting for the greater half of the loss. The
number of young people in their twenties has been most
drastically reduced~ the loss amounting to more than 409 in
the case of men aged 25-29; men and women aged 20-29 accounted
for almost half the total of the outward migration. All age
groups from 5 to 65 share the loss of numbers in various
degrees. On the other hand, it appears that on balance some
men and women of retiring age have returned to Ireland~ and
there also seems to be a recent inward balance in the number
of couples with small children.
In 1951, the total population of the country was
2,960~600 persons. In the absence of migration, the number
would thus have increased by 253~8OO to 3t214~400; in
actual fact, it fell by 142,300 to 2, 818~300. It is also
estimated that, assuming the additional labour supply
[image:25.595.67.534.78.536.2]25
-the economy, -the labour force would have risen from /,272,000 by about /.42,600 to &,~.1~_~60© instead of
declining by 163,900 to I,iO8,1OO, and the overall work participation rate would have risen from 43.0%~t0 14.0}~ instead of falling to ~9.3~.
Actual net outward migration in the
inter-censal period 1951-61:, as dedu’ced from the recorded balance of births and deaths, amounted to about 409,000 persons. This is somewhat higher than the total of 396,000 deduced
from Table 17. The discrepancy is explained by the fact that emigration tended to reduce by about 13;000 the number of deaths occurring in the country;, these would have been
lost to the country even in the absence of migration.
From the recorded natural population increase and the estimate of total population, the estimated
migration each year may be deduced; the figures obtained differ from those given for "net passenger movement. The split-up of change in population size is shown in Table 18, together with changes in the labour, force as estimated in
,<
"Economic Statistics"; these" are likewise split up into t.
changes in number at work and in unemployment. ., These’. figures are based on a revised estimate for the labour force in 1951~ and thus the total for the decade somewhat differs from that previously quoted.
Table 18., Population and labour force chanses each ~ear~ April 1951 - April 1961.
Period i’§51L52 1959-53 1953-54 ,195~-55 1955-56 1955-57 1957-58 1958-59 i959-60 1960-61 1951-61 Population change
To t al
26
-Assuming that the labour force estimates are reasonably accurate, an interesting problem poses itself. The change in the labour force may be considered as made up by two components, viz. the domestic change
and net migration of the labour force, the domestic change being the balance of intake into and withdrawals from the occupied population. Is it possible to
estimate the two components?
For the period 1951-61, it has previously been estimated that without migration, the labour force would have increased by about 143,600 persons~ or working with adjusted 1951 labour force figures, this comes to about 150,000 persons. As, in fact, the labour force declined
by 154,000 persons it seems that 304,000 potential workers emigrated.
To assume a net domestic labour force intake of 15,000 persons each year does not seem satisfactory as it gives unrealistic figures for the net emigration each year. Instead, we may assume that withdrawals from the labour force, and thus the net intake, is closely related to changes in numbers at work, and that migration of
workers is closely correlated with total migration. The problem then reduceG to one of regression analysis,
Given three variables xl, x2~ y, all measured as differences from their means, y is to be split up into two additive components YI’ Y2 such that
Yl = /31 Xl + ~I Y2 = #2 x2 + ~2
Yl + Y2 = y
27
-that the errors
solution is
and e
±
2
have equal variances~ the
Y2 = ~ (y - bl xl + b2 x2 )
where bI and b2 are the partial regression coefficients
of y on xI and x2.
Iu this instance, xI refers to change in number
at work, x2 to net migration and y to change in total
labour force. Computation yields
bl = 0.,~6~
b2 = 0.3646
thus for the variables xI’ x2’ ’
’
’ Y ’ Yl
include their constant term
’ ,and
[image:28.595.63.499.52.486.2]Yl
Yfl
Table 19 shows the result in numerical terms.
Y2 ’ which
’
= 19.06 + 0.5 y~ + O.2310 xI’ N 0.182~ x2’
’
=-19.06 + 0.5 y’ 0.2310 Xll + 0.i823 x2’
Table 19. AnalTsis of labour force
change) &951-1961.
(thousands)
Period
Tot al
Net domestic
i nt ake
Net migration
1951-52
-8
+16
-24
1952-53
-23
+7
-30
1953-54
-3
+23
-26
1954-55
-20
+13
-33
1955-56
-20
+13
-33
1956-57
-26
+4
-30
1957-58
-21
+16
-37
1958-59
-~2
+17
-29
1959-60
-11
+20
-31
1960-61
-10
+21
-31
[image:28.595.111.419.494.756.2]- 20
-If this analysis is correct, then not only does migration of workers vary, largely in response to the
em[~lcyment situation, but there are also considerable year-to-year variations in the extent to which marginal ~orkers like married women and old people enter or leave the labour, force. Of course, as these conclusions lean heavily on data and assumptions which may not be highly
accurate, they are of a somewhat tentative nature.
6. OUTLOOK
The period analysed here ends in 1961. In one sense, this is an advantage since this year may mark
a turning point in irish population history. For the first time since 1948, the total population began to increase again after 1961, and it is possible that the total oi-#~’-.;2,818,CO0 persono reached then will be the lowest
one recorded for time to come. The total population is estimated to have risen in each of the three years
following April 1961, the total rise up to April 1964 amountinS to ~I,OOC pez.sons.
During this 3-year period, average annual births amounted to 61,70.$ which is the same as the average over the decade 1951-60, but the number of deaths, about 3~OC6
per annum, was well below the level of the preceding decade. With a natural increase of 86,O0.L persons, the total net emigration which is implied in the population
estimates amounts to 55,OOC for the three years, or an annual emigration rate somewhat above 18,000.
29
-For male and female births, it will simply be assumed that the average number between 1961 and 1971 is the same as between 1961 and 195~. Whilst the current
high marriage rates and low emigration make for an increased number of births, this may be offset by some
reduction in marital fertility. For a long-term
projection, the fertility assumptions would need to be more carefully considered, but for a medium-tel, m forecast the level of births is not of outstanding importance.
Mortality is likely to fall further, but the reduction is assumed to be only half of what it was between 1951 and 1961. The precise assumption made is that the survivor ratios betweon 5-year age groups
deduced ~rom the 1960-6~ life tables operate during the five years 1D61-66, but in the following quinquennium higher survivor ratios operate. Denoting these ~atioe fox 1951, 1961 and 1971 by rSl, r61 and rTl respectively, the assumption is that
(1 -
- rS ) :
fr’Sl)/(1 _ 51)
The net loss of population through migration is e~timated as 180,COG persons. The total is based on
recen~ experienco and is in agreement with the targets set by the Second Economic Programme. The sex and age
30
-20. Population 1961 and projected population 1971 by sex and age (thousands).
, 1961 1971
Age
~ales Females ~ales Females
C - 4 153.4 147.4 155 . 3 148.5
5 - 9 1:17.0 14G. 7 15 O. 1 143 . 5
i0 - 14 140.3 140.5 147.7 141.6
15 - 19 120.[~ 113.5 136.2 128 .4
90 - 24 80.4 77.6 124.2 117.5
25 - 29 72 . 3 73 .i [ 95 .8 94.3
30 - 34 75.2 77.5 I 66 .7 69 .0
35 - 39 81.6 35.2 64.1 67.0
40 - 44 84.8 85.5 69 .6 73 .0
,’/.5 - 49 89.0 05.6 74.9 78 .7
50 - 54 81.7 75.4
i 77 .4 79 .O
55 - 59 67.6 67.5 70 .5 77 .S
60 - 6~ 64 ¯ 4 66 .6 67 .2 66 ,3
65 - 69 51.1 52.3 53.3 57.4
70 - 74 44. i 40.7 45.4 i 53 .O
75 - 79 29.7
33.5
2o .9
34.~SO - .$4 16.7 20. <l 16.9 ~2.4
05 and over 7.7 10.8 7.5 12.0
i
,,,All ages i 1,416.5 1,401. 1,460.2 1,463.7
Whilst too much reliance should not be put upon the figures for individual age groups, the broad tend-encies are clear. If the assumptions made are realistic, total population will grow by more than iOO,OOO in the current decade to reach a total of over 2,90C,0C0 by 1971 and thus return to the 1955 level.
There would be a substantial increase of 150,OOC or more in the number of men and women between 15 and 30 years of age, and also a rise in the number of old people. On the other hand, the number of persons in the age groups
between $0 and 50 would decline by about 100, O00.
. ...At 2961!.~ork participation rates in each group, the td.t.al’ labour f.orce would rise from 1,108,000 to
about 1,175,000, made up of 850,000 men and 325,000 women. The gainfully occuPiedproportion of the total population would rise from 39.3/ to 40.2}~, and women would form the greater part of the net inflow into the labour force.
The analysis has been presented here as seen .from th~ demographi’c’angle, and for a fuller treatment,
economic factors should be taken into account. Neverthe-less it seems worth while "to note the demographic influences In assessing economic prospects and policies. The con-clusion obtained with regard to the growing importance of women in the labour force forms one example of such