INTERNAL DOCUMENT It's
DB2 theoretical mooring study A.R. Packwood
August 1982
Internal Document No. 165
[This document should not be cited in a published bibliography, and is supplied for the use of the recipient only].
INSTITUTE OF OCEAIMOGRAPHIC SCIENCES
INSTITUTE OF OCEANOGRAPHIC SCIENCES
Wormley, Godalming, Surrey GU8 5UB
(042-879-4141)
(Director: Dr. A. S. Laughton, FRS)
Bidston Observatory, Birkenhead,
Mersey side L43 7RA (051-653-8633)
(Assistant Director: Dr. D. E. Cartwright)
Crossway, Taunton,
Somerset TA1 2DW (0823-86211)
DB2 theoretical mooring study A.R. Packwood
August 1982
Internal Document No. 165
Institute of Oceanographic Sciences, Brook Road,- Wormley,
CONTENTS
1. Introduction
2. Description of numerical models 3. DBl results
3.1 Model scale tests
3.2 Full scale DBl measurements 3.3 Numerical modelling of. DBl 4.
5.
6.
7.
8.
9.
10.
11.
DB2 trial mooring configuration (DB2^^j) Second trial mooring (DB2^2))
Natural periods of the buoy/mooring system Buoy pitch resonance
Performance in breaking waves Discussion
References
Tables and figures
Page 1
2
3 3 4 4
6
8 8
11
11
DB2 THEORETICAL MOORING STUDY
1. INTRODUCTION
A 5 scale version of the data buoy DBl, henceforth referred to as DB2, has been proposed for operation on the Porcupine Bank off the west coast of Ireland
in 400 m of water.
The survivability of the DBl mooring concept - a 3 point mooring with ground chain and compliant braidline in mid-water, is assumed acceptable having proven itself over the last 4 year deployment in the S.W. Approaches. A similar three point mooring is therefore envisaged and the purpose of this report is to suggest what might be a suitable mooring specification and to try and evaluate the buoy/ mooring system performance in adverse conditions.
Extreme wave conditions for this area are estimated as 33-35 m for the 50 year return wave height and 30 m for the 10 year return value. Typical periods for these waves may be 16 s. Typical mean currents are of order 0.5 kts peaking to 1 2 kts in directions predominantly from the west and south-west. January winds are s-sw-w and are 30% of the time greater than 28 kts. Most of this data is obtained from the W. Atlantic tables of wind and waves.
Numerical models are used in the analysis to evaluate first the steady forces on the buoy-mooring system and the effective stiffness of the ground chain catenary and then the dynamic loads in the mooring. Several simplifications are made to enable a very simple one degree of freedom model of the buoy motion to be used. This model is used to estimate the mooring tensions in the extreme wave conditions, however this does not cover breaking wave events, the
significance of which is discussed later (see section 8) . Having previously determined the effective stiffnesses of the mooring, section 6 examines the various natural frequencies of the mooring system.
The results of the DBl model trials in breaking waves performed at NMI in 1977 are discussed and compared with the results obtained numerically. Two sizes of ground chain are considered and the merits of each are presented.
Overall, no problems are found in choosing the mooring materials. It also appears that certain resonant, conditions may be acceptable in view of the high damping in the mooring system.
2. DESCRIPTION OF THE NUMERICAL MODELS
The basis for the steady force calculations is the ICS cable/mooring program SHAPE. The program is described in more detail in Carson (1975) but basically it will calculate the shape of a cable catenary in a current which may vary with depth. The cable is divided into sections which may have different properties, weight, diameter,•drag or local current. The water depth is
fixed and the program can be made to determine the necessary buoyancy required to keep a surface buoy afloat.' The program was modified so that the bottom section would automatically, by an iterative procedure, be altered in length such that the cable formed a catenary with an angle of less than 5° to the horizontal at the sea bed. This was to simulate the ground chain catenary.
The results obtained by running the steady state program for a variety of water depths and currents are discussed in detail in the following sections. The results suggest that a simple dynamic model might be used to estimate wave forces on the buoy/mooring system. It was found that the vertical displacement of the buoy had only a small effect on the mooring load when compared with horizontal displacements. This is borne out by a comment made by Carson (1977) commenting on the results of the DBl deployment off Lowestoft. He concluded that with respect to mooring loads "tidal height appears to be much less important than current". The comment related to a much shallower mooring but the same result is indicated by the numerical model results of section 4. Hence the major wave force component comes from the drift of the buoy in the wave velocity field. A simple one degree of freedom system is devised to give the unsteady drift and horizontal force component which can then be related back to the steady state results to give the total mooring force including the vertical component. In this simplified calculation the drag of the buoy and upper chain are allowed for in the horizontal but vertical drag is ignored as are chain stiction forces in the bottom mud. Wind force has also been ignored at this stage.
The simple dynamic model is depicted below. The equation of motion is then cc
MX = D - T (1)
X
where
D = ijp (SCjj) (V-x) Iv-xi T = T (x)
X X
V(t) = + V (t)
pendzinL o w
c-hoi-ns
(x) is a non-linear restoring function due to the "weather" mooring leg and is determined by the steady flow calculations, D is the drag force and (SCq) represents the summed (projected area x drag coefficients) for the hull and upper parts of the 3 leg mooring in the wave velocity field, M is the effective mass i.e. mass plus added mass of the buoy plus upper pendant chains, is the steady current and (t) is the imposed wave particle velocities. Eq.(l) is a non-linear ordinary differential equation which is solved numerically using standard NAG library routines. (t) is the main forcing function and is chosen to represent the velocity field of a suitable wave train.
3. DBl RESULTS
3.1 SCALE MODEL TESTS
A summary of the model tests carried out at NMI in January 1977 is reported in Carson (1982) . The purpose of the tests was to test the survivability of DBl in breaking waves and determine a-mooring con-figuration to reduce the likelihood of the buoy being overturned.
A sketch of the best mooring and that originally proposed for DBl in the S.W. Approaches is sketched below. The numbers iZHm. e-lnstic.
Scctlon
-^sf>(fne-s&: 6.2S kw/m.
Q3m. chain _ ''lOeight ua tOoUr
0.2>5 teM/m. -vmr
are scaled up to full DBl size from the scale model test results. Maximum forces in 25 m, 13.2s waves are 7 — 8.5 tonnes. With this arrangement the buoy capsized 5 times in 30 breaking waves of about this size.
DB2 is 5 the scale of DBl so, ignoring the difference in mooring depth for the moment, these forces under Froude scaling scale as (t)^ = 0.512 of the DBl values. So the mooring force scaled for DB2 from these DBl model tests is of order 3.5 - 4.3 tonnes. The braidline stiffness scales as (g)2 = 0.64 as does the chain weight giving 4 kN/m braidline stiffness and 0.224 kN/m chain weight in water. However the scaled water depth is only 5 that of the proposed DB2 site and the scaled model test waves are only 19 m high compared with the 35 m predicted maximum wave. These figures then can only be used as a guide giving data which may be compared with actual DBl data.
-3.2 FULL SCALE DBl MEASUREMENTS
The largest loads measured on DBl while in the S.W. Approaches were
-13 tonnes which was measured in 20 m high waves, see Rusby & Waites (1980) . This is a considerably higher load than predicted in the model tests with the arrangement described above but may be due to the reduced compliance of the braidline used on DBl and a larger pre-tension, 5 - 6 tonnes on lay. A 13 tonne load corresponds to a load of 6.7 tonnes at DB2 scale.
3.3 NUMERICAL MODELLING OF .DBl
The DBl mooring was modelled using the steady flow program to compare the numerical model with the actual model tests and full-scale measurements outlined above. A full description of the DBl mooring and the data required to run the program is given in fig. 1. The drag of the buoy hull was
measured by Carson (1972), his results give (SC ) = 1.0 mf at current 1) iIUXjLJ
speeds of 1 - 2 m/s. The drag of the pendant chains I crudely estimate as (SC - 3.2 m^/leg using C_ = 1.2 on the projected area of the
D CriAIN U
chain and I include in the buoy drag 50 m of braidline on the two slack moorings which adds (SC ) = 9.7 mf. Thus the total buoy drag
u oLiACK. RUPiIjD
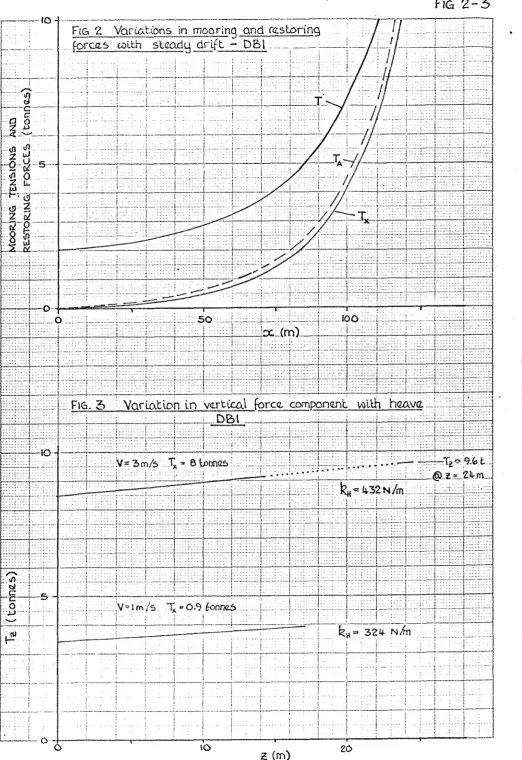
at the upper end of the weather mooring becomes (SC^) = 17.1 . The velocity profile is an arbitrary choice, hopefully not unrealistic. .Wind, drag has not been accounted for in the total drag above. This is unimportant in the sense that the model will only be used to give the restoring force and catenary shape for given horizontal and vertical displacements of the buoy. A summary of the findings is given in table 1, the symbols used are defined in fig. 1, the results are shown plotted in figs 2 - 4 .
By plotting £n (T^) vs x it can be shown that the function T^; is exponential and is reasonably approximated by the relation
T^ = 0.057e*^^^'^ tonnes (2)
= 0.559e*/^^'^ kN
The surge stiffness which is just the differential of this is then
k = 24.6e*^^^'^ N/m (3)
s
As suspected the stiffness is highly non-linear.
In contrast, the heave stiffness, which is the slope of the lines of fig. 3, is linear in z and varies only a comparitively small amount with X. Since the restoring force is very much more dependant on x that z, it is justifiable to ignore this contribution and argue that if we know how T^ and x vary in large waves then we may infer T from the steady flow results of figs 2 - 4 and correct for the wave height.
-In (1) is now known, it is assumed that (SC^), in the expression for D, is the same as for the steady flow case since no better assumption is available. DBl weighs 40 tonnes in air, assuming the added mass of the buoy hull is equal to the displaced volume this adds another 40 tonnes and adding some extra for the pendant chains and their added mass, say in total M = 83 tonnes. It only remains to determine the forcing function V (t) . It was decided that the breaking wave groups used in the NMI
experiments would be scaled up thus again providing a useful test of the numerical model with experiment. In the experiment, (F) in Carson (1982), the waves came in groups of six. Four smaller waves were followed by two larger ones the first of which usually broke near to the model. Using Froude scaling to scale the pen recorder traces of wave height the full scale DBl waves were 4 @ H = 11.3 m, = 14.4s period followed by 2 @ H = 24 m, = 12.5s period. The maximum particle velocity is taken as Hir/T and v' is then assumed sinusoidal. V was chosen to be
p w o
1 m/s, a typical surface velocity at the DBl site is 0.7 m/s, so probably never exceeds 1 m/s. In the model tests there was no tidal flow but some tidal drift is required to make the model representative for the exponential function for is invalid for small x. Some back tension was employed in the model test, sufficient to give the weather leg a load of 1 - 2 tonnes at full scale. A 1 m/s current gives a pretension of 3.5 tonnes according to the numerical model so it may be expected that the numerical results will give tensions slightly larger than those predicted from the tests.
The calculation was started from the steady state with V(t) = V^, X = X = 0. The initial value of x was determined by solving (1) with these conditions using (2) and the assumed drag coefficient and effective mass. The results of this calculation are shown in fig. 5. The maximum value of T^ is 7.9 tonnes and x = 112 m. The greatest tension occurs
X max
not at the peak of the first big wave but at the peak of the first smaller wave following the two larger ones. This is brought about by the large trough in the wave particle velocity preceeding the leading big wave. The buoy response, shown on the bottom graph, indicates the fast response to the initial drop in velocity and the slower build up to the peak tension as the big waves push the buoy along the surface. The mean tension then decreases as the buoy gradually drifts back through the next three waves. The response indicates that the system is very heavily damped, the buoy velocity never exceeds the magnitude of the forcing velocity.
-Returning to the steady flow results, it can be deduced that if x = 112 m then from fig. 2,T = 12 tonnes @ z = 0 and JL - 170 m @ z = 0, The results of table 1 also indicate that L increases as z thus in a 24 m wave the total chain lifted may be - 195 m. T is also increased slightly, from fig. 3,?^ - 9.6 tonnes in a 24 m wave, with - 8 tonnes this increases the total tension at the buoy to T = 12.5 tonnes.
The force on the anchor T^ - 8.6 tonnes under these conditions. These forces are larger than those measured at model scale but this is due to the higher pretension and reduced compliance of the braidline. However the numerical model does give tensions similar to those measured on DBl on site in 20 m waves which is very encouraging. It is also sobering to think that this force is sufficient to lift nearly all the 210 m anchor chain that lies on the bottom. . It is therefore not surprising that the loads of 17 tonnes measured shortly after the initial mooring lay were sufficient to relax the mooring pretension by dragging the anchor (see Carson (1982)).
4. DB2 TRIAL MOORING CONFIGURATION (DB2^^^)
For typical design mooring forces one may take the measured DBl maximum load of 13 tonnes and scale by (1)^ to get an equivalent DB2 load of 6.7 tonnes. A minimum proof load for the chain would then be say 15 tonnes. This would correspond to 19 mm high strength stud link chain. But it would be unwise to go for the minimum specification since at the DB2 site the water depth is much greater and the 50 year wave somewhat higher than at the DBl site. So for a first trial mooring try 25 mm chain, high strength stud link, at 27 tonnes proof load weighing 146 N/m in air = 127 N/m in sea water.
The braidline should not be loaded to more than 20% of its breaking load if it is not to be permanently deformed thus losing some of its compliance. The 27 tonne proof chain suggests a maximum S.W.L. of 16.5 tonnes so to be consistent with this initial choice of chain a braidline with a minimum breaking load of 82.5 tonnes would be appropriate. The 64 mm Viking, nylon braidline of British Ropes has a quoted break load of 90 tonnes and therefore seems suitable as an initial choice. Suppose 25 m of chain is pendant at the buoy and 50 m of bottom chain are lifted as pretensioning chain in zero current conditions. This leaves 325 m to be taken up by the braidline. The 64 mm braidline stretches 10% for a 10 tonne applied load, this gives a braidline stiffness of 3.02 kN/m. The pretension is = 6.35 kN therefore static stretch is 2.1 m. The length of ground chain will be determined by the calculations as will a suitable anchor size.
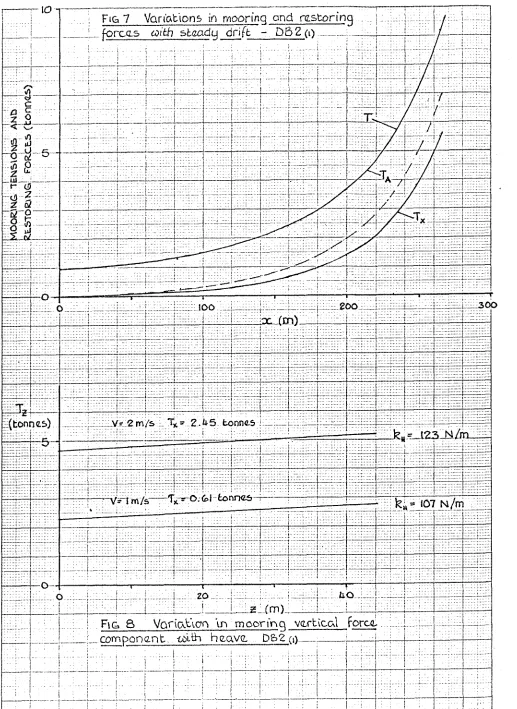
The details of the trial DB2 mooring are given in summary in fig. 6 together with the assumed velocity profile and drag assumptions necessary for running the steady flow program. The buoy drag was obtained by scaling the DBl data and the drag of pendant chains and moorings was found as described in section 3.3. The results of running the steady flow program using this data with a range of surface currents and water depths are given in table 2. These results are shown graphically in figs 7 - 1 0 . Again the restoring function T^ is
found to be exponential and may be reasonably fitted by the curve
T^ = 0.0236e*^^^'^ tonnes
= 0:232e*/4B.8 (4)
Consequently the surge stiffness on the one weather mooring leg is given by
Kg = 4.75e*/48.8 (g)
Comparing (5) with (3) the DB2 surge stiffness is very much less than DBl. This one might have expected since DB2 is in much deeper water. Similarly from fig. 8 the heave stiffness is also much reduced compared to the DBl mooring, this being a consequence of the lighter chain. Hence the buoy can drift 160 m in a 2 kt current cf. DBl: 76 m drift in the same steady current. This means that the DB2 watch circle radius will be approximately twice that of the DBl mooring in the S.W. Approaches in a similar surface current.
Eq. (4) is used to give the restoring force in the simplified equation of motion (1) and an effective mass of M = 51.3 tonnes made up as for the DBl calculation, see section 3.3, is assumed.
A similar wave group pattern as for the DBl experiments is used as a forcing function. A wave train of four 16.5 m, 18s waves lead the group and are
followed by two 33 m, 16s waves. These have peak particle velocities of 2.88 m/s and 6.48 m/s respectively. An initial steady current of 1 m/s is again assumed and the calculation is started from rest. The results are shown in fig. 11. It is noticeable that the buoy takes longer to reach its maximum excursion, requiring two wave groups to pass before the motion becomes periodic. Once more the motion appears heavily damped.
Tv = 2 . 7 4 tonnes and x = 232 m. The steady flow calculations indicate
* max max
that at this drift the full tension in the mooring allowing for an additional 33 m lift due to the wave is approximately 5.9 tonnes. The length of chain lifted is 265 - 270 m and the force on the anchor is approximately 3.5 tonnes.
This result is encouraging in that the specified chain and braidline are very adequate for these forces. Some over specification is desirable since from DBl experience it is known that larger forces can be induced at the time of laying the mooring and in the shake-down period that follows.
-5. 2ND TRIAL MOORING (DB2 ) K^)
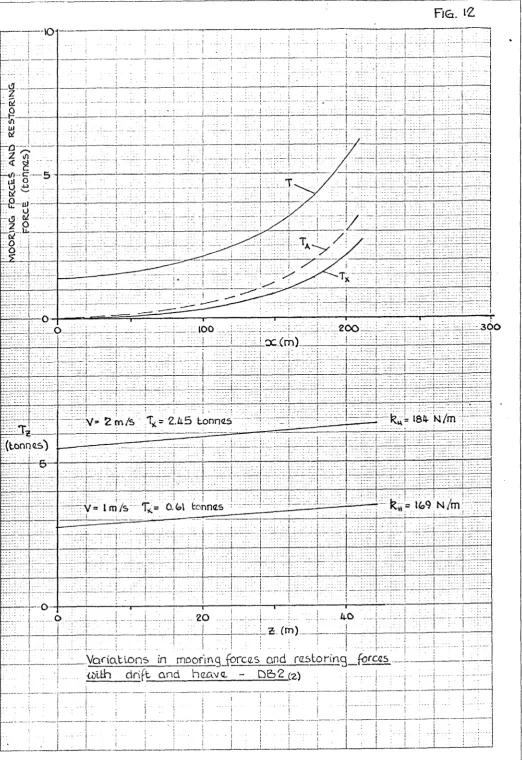
It was felt that possibly the 25 mm chain might suffer heavy wear in the thrash zone on the sea bed where it is constantly being pulled in and out of the mud. So a slightly heavier chain was substituted for the ground chain in the calculations. The 25 mm chain was retained at the buoy but 31.75 mm chain was used for the entire length of ground chain. This has a weight in air of 230 N/m and 200 N/m in sea-water and has a proof load of 42 tonnes. Re-running some of the steady flow calculations of section 4 with this data gives the results tabulated in table 3. The mooring tension T, T^ and T^ are shown plotted against the drift in fig. 12. The restoring force with the heavier chain can be approximated by
giving
T^ = 0.387e*/5° kN kg = 7.75e*/50
(6)
(7) The buoy dynamic response shown in fig. 13 is very similar to the first DB2 trial mooring giving a peak restoring force T^ = 2.7 tonnes. The only notice-able difference is that x is reduced throughout by approximately 20 m so that X = 211 m. Because the chain is heavier however T is larger giving T ^
max z ^ 3
7 tonnes allowing for 35 m additional chain lifted on passing through a 33 m wave. The total length of chain lifted is = 210 m and the anchor force is of order 4 tonnes. Summaries of all these maximum load estimates obtained for DBl and the two DB2 trial moorings from the numerical solutions are given in table 4.
NATURAL PERIODS OF THE BUOY/MOORING SYSTEM
The stiffness of the various systems discussed have already been calculated using the steady flow program. So in summary on a single mooring leg
-DBl(41.3mm chain) DB2(25mm chain) DB2(31.75mm chain)
surge
1 leg J kg(N/m) heave
1 leg
weight of )
) kjj (N/m) ) @ V=lm/s chain J (N/m)
24.6e 40
x / 2 2 . 7
324 307 3.02 x/48.8 4.75e 3.02 x/50 7.75e 169 200
Buoy mass (kg) Added mass (kg) (estimated)
40 X 10' 43 X 10!..
22 X 10=
25 X 10' 26 X 1 0 ^
13 X 10'
25 X 10®
26 X 10^. low freq. 13 X 10^ high freq.
The natural period of oscillation is given by
Tp . 2, (S)'' . (8)
where M = effective mass and k is the appropriate stiffness for the mode of oscillation. Clearly in surge where the buoy is effectively moored on one leg, the other two pendant, k^ is the appropriate stiffness since the pendant legs will contribute very little to the restoring force. However in heave the buoy must lift not only the chain on the weather leg but also the slack chain on the two pendant legs. Hence in heave the appropriate "stiffness" is
(kg + 2w^) in the table above. Note the chain itself acts as a spring in providing a restoring force which is proportional to the length lifted. So its effective stiffness is just its weight in water - when the chain is slack. As V decreases it is expected that k^^ ^ as V -> O. We note that k^ is not very different to in the cases studies so a reasonable approximation to the total stiffness in heave is 3W .
c
The added mass is a function of the wave frequency, the added mass coefficient being approximately 1.0 at the low frequency end of the spectrum ranging to approximately 0.5 at the high frequency limit, see Newman (1977) . The natural periods of the system are tabulated, see table 5, for both high (w^) and low
(Wj^) frequency limits for the three buoy configurations considered (DBl and DB2 with two chain sizes). Three modes of mooring oscillation are considered
(i) buoy surge k = k^ (ii) buoy heave k = 3W^
(iii) braidline natural frequency k =
The results for DBl are for its mooring in the S.W. Approaches and are not therefore for direct comparison with the DB2 mooring off Ireland, they are included for information only and to compare performance of the systems.at their different locations.
There remains the transverse vibrations of the braidline to be considered. There are two types of transverse vibration possible (i) vortex induced vibration and (ii) the stretched string modes of oscillation. The natural periods due to vortex shedding are given by
"^p " 0.2V (9)
where d is the braidline diameter and V the current speed which for simplicity is assumed constant. In the current range V = 0.5 - 1 m/s the vortex shedding period for the 64 mm braidline is very short, T^ = 0.64 0.32 s.
The natural periods of the stretched string modes are given by the relation A
where L = length of the string, n is the mode number, the (mass + added mass) per unit length of cable and T is the mean tension. Eq.(10) assumes that the ends of the cable are fixed. The fact that the ends are flexible, i.e. the chain can move, and that there is a considerable amount of free hanging chain on the end of the braidline will increase the period of the
fundamental since L is not just the braidline length but includes the free chain also. The tension varies with the buoy drift, wave conditions and also down the length of the mooring. By averaging the tension and obtaining an average mass per unit length for the entire cable and chain lifted a rough approximation to the natural period may be obtained. For each mooring config-uration the high and low load limits are considered where the low load is just the static weight of the minimum length of the mooring lifted, as under zero current conditions. The results are given in table 6 where (10) has been used to give Tp^. It is clear that DBl has fundamental natural periods that fall within the high energy band of wave periods. DB2qj and DB2^2) move the low tension fundamental outside the band but the high tension fundamental falls within the band as do the second modal periods Tp^- This appears to be something of a problem, especially since there does not seem to be a simple way of shifting these fundamental periods below the lower limit of the band where all of the modes would then be outside the high energy part of the
wave spectrum. This difficulty of maintaining a high frequency tether response as water depth is increased is mentioned by Bowers & Standing (1982) . Their conclusion is that an increase in Tp may have to be accepted in the hope that fluid damping will reduce the dangers of dynamic response and fatigue problems.
-7. BUOY PITCH RESONANCE
A first approximation of DB2 pitch resonance may be determined by scaling the DBl pitch resonance period.• This assumes that the buoy loading and distribution of weight may all be scaled down in the same manner as the geometry. The natural frequency in pitch may be defined as
0) =
fl
rad/s (11)where F is some restoring force, r the moment arm of F from the pitch axis and I is the 2nd moment of inertia in pitch. Now I may be defined as
I = I Ma^ ( 1 2 )
where M is an element of mass of the buoy or payload, a is its distance from the pitch axis and Z signifies summation over the whole structure and payload.
If s represents the linear scale factor between DBl and DB2 such that
•C' = s-C, where all dashed quantities will refer to DB2 and undashed to DBl,
then by Froude scaling force and mass scale as s®. Hence I' EM'a'^ Es^Ms^a'
= s I EMa^ EMa^
Using (13) and (11) it is then easy to show that
(13)
w 0)
F'r' Fr
-h (14)
It is known that s = 0.8 therefore (w'/w) = 1.118. Carson (1982) quotes the DBl period of pitch resonance as 2.2s, i.e. oj = 2.856 rad/s, this gives (J)' = 3.193 rad/s which is equivalent to a period of 1.97s.
8. PERFORMANCE IN BREAKING WAVES
The performance of the DBl mooring system in breaking waves was studied at NMI in model trials carried out in 1977 as already described. The buoy
is essentially a surface following device and in a breaking wave the buoy will track around the concave
face of a large breaker as depicted below. In order to invert the buoy the wave must be at least two buoy diameters high. Particle velocities and wave speed in a breaker are
substantially higher than in a linear wave and the buoy can be carried along with the wave for a considerable
Carson (1982) found that peak mooring loads in breaking waves with a non-compliant mooring could be very high, up to 86 tonnes at DBl scale. The best mooring was found to be a compliant one with the lower chine attach-ment point. With this system loads were reduced by a factor of 10. The chine attachment gives a strong righting moment which aids survivability in breaking and spilling breakers and helps to pull the buoy through the crest of the wave. It is thought that the load reduction is mainly brought about by the compliance in the mooring. The wave sketched above evolves very quickly and rapidly dissipates as the jet forms a torrent of white water. The compliance allows the buoy to. move with the wave even after all of the ground chain has been taken up. This allows some time for the wave to break so that the buoy does not have to be pulled through the solid wall of water, as it inevitably would with non-compliant mooring. Instead the buoy may ride through the cascading white water as the wave evolves and breaks over it. The white water being much aerated is much less dense which reduces the drag considerably. The fact that the DB2 mooring is very much more compliant than DBl and of approximately the same compliance as that of the scaled up model mooring should give it a better survivability than DBl.
The probability of meeting a plunging breaker 12 - 15 m high in deep water at any one given location such that the breaker face is just becoming vertical as it approaches the buoy must be very remote. Carson (1982) argues that the majority of ocean breakers are of the spilling type, which are much less damaging. It is almost certain from the undamaged state of the relatively delicate meteorological sensors on the DBl mast that DBl has never encountered such a wave in its 4 year deployment in the S.W. Approaches.
In summary, the forces in a big breaking wave are potentially high enough to break a non-compliant mooring of the DBl or DB2 type specifica-tion, although it would probably lift an anchor first. The degree of compliance of the DB2^j or DB2 moorings however enable the buoy to ride with the wave as it breaks which reduces the forces by an order of magnitude. Under such circumstances the mooring loads may not be much different from those predicted for the extreme non-breaking waves.
However, the likelihood of such a wave hitting the buoy are very slight. The chine attachment gives a righting moment which improves the buoy survivability in both spilling and plunging breakers making it superior to centre point moored discus buoys.
-9. DISCUSSION
It is encouraging to note that in surge and heave the moorings for both DB2and DB2are more compliant and therefore have longer natural periods than DBl, The mooring forces are significantly reduced by a factor between 0.5 and 0.67 for the smaller buoy in the deeper water. Either of the DB2 moorings considered appear to be suitable from consideration of mooring forces and natural periods. The choice may therefore be made from wear and corrosion considerations. The 32 mm chain of the DB2^2j mooring is the more substantial and hence more appealing. The heavier chain increases the tension in the mooring slightly when compared with DB2^j but this has the beneficial effect of reducing the drift by approximately 20 m, roughly a 10% improvement. The increased water depth and compliance of the DB2 system means that the watch circle radius, i.e. the circle the buoy describes through a typical tidal cycle, is approximately twice that of DBl. The braidline compliance for the chosen 325 m length of 64 mm diameter braidline is more than 10 times that of the DBl braidline compliance. This figure is nearer that originally proposed by Carson, see Carson (1982), for the DBl system when appropriately scaled for the DB2 system, following the model trials in breaking waves at NMI. There is therefore every hope that the DB2 system may fair equally as well as in the original model tests which showed good survivability characteristics and low mooring loads in breaking waves. This was by virtue of the chine mounted mooring attachment point and the high degree of compliance in the elastic mooring. The probability of the buoy meeting a large breaking wave just at the point when the front face becomes vertical is considered small. It is thought that DBl on its 4 year deployment in the S.W. Approaches has not encountered such an occurence.
The simple dynamic numerical model has proved very useful in predicting peak mooring loads in extreme non-breaking wave conditions. The predicted tensions for DBl are in reasonable agreement with those measured on site in the S.W. Approaches. There must be some uncertainty in this deterministic approach however since only one wave group has been examined. It would therefore be prudent to be conservative in making the final choices of materials and chain lengths for the system. A linear spectral model which might hope to cover a wider range of wave amplitudes and frequencies is very clearly inappropriate for the mooring systems examined here which are highly nonlinear both in damping and stiffness.
for this length, since 50 m is used to pretension the mooring. In either
mooring a 1 tonne Bruce anchor, quoted as having a holding power of 40:1 in
good ground, should be sufficient to withstand these anchor loads.
A number of possible modes of the mooring vibration appear to have periods
that fall within the high energy band of the wave spectrum. These are the
elastic natural period of the braidline and the first two modes of the
transverse oscillation of the whole mooring as a stretched string, see
tables 5 and 6. With regard to the first of these the compliance of the
chain catenary is much greater than that of the braidlihe even at large values
of x , the drift. The braidline only becomes the most compliant section of the
mooring when the buoy is hard against the anchor having lifted all of the
ground chain. If such a condition can be avoided, by laying adequate lengths
of ground chain, the elastic natural frequency of the braidline should not
excite a large or damaging response of the system. It is thought that after
the initial lay of the DBl moorings in the S.W. Approaches the tensions
recorded in the first significantly high waves (17 tonnes in 14 m waves) were
sufficient to lift the entire length of ground chain. The outcome appears to
have been that the anchor was dragged and the pretension relaxed. If the
calculations here are correct then subsequent peak loads i- 13 tonnes) have
not quite managed to lift the chain and the mooring seems to have functioned
as designed.
The second set of natural modes that appear potentially problematical are
the transverse modes. There is evidence that these modes do not cause any
problem on the DBl mooring system. If it were a problem then it might be
expected to show itself in excessive chain wear between links. Examination
of recovered DBl mooring chains suggests that inter-link wear is not significant.
Of much greater significance is corrosion of unprotected links and shackles,
damage due to fishing warps and abrasion in the ground chain thrash zone.
It is thought that the fluid damping, especially over the chain sections,
is more than adequate to damp these modes of vibration. It is considered
that the same will be true of the DB2 mooring in deeper water. The remaining
transverse vibration due to vortex shedding has a much higher frequency than
any of the natural modes discussed and so is not likely to excite any large
response of the system.
The buoy pitch response is very similar to that of DBl, the scaled natural
period being slightly less at approximately 2 s . It is interesting to note
from the dynamic response calculations of figs. 5, 11 and 13 that the buoy
will always under-read the wave particle velocity because of the large mooring
motion which allows the buoy to drift with each wave. The mean velocity, or
the current underlying the wave motion, is correctly averaged however so that
V - x is correctly given as Vq in each case.
All of these results with the great benefit of the DBl experience indicate
no particular difficulty in choosing materials or a mooring configuration
that gives promising performance on paper. In particular the DBl experience
should be used to guard the new mooring against corrosion, handling and
fishing activity problems which still probably present the gravest dangers
to the integrity of the mooring.
10. REFERENCES
Bowers E.G. and Standing R.G. (1982) Environmental loading and response.
NMI R135 March 1982.
Carson R.M, (1972) Model tests on a data buoy hull
NIO internal report no. A59, September 1972.
Carson R.M. (1977) Motions and mooring forces of the data buoy.
In: Proc. of the U.K. data buoy symposium. lOS Report 44.
Carson R.M. (1975) Mooring hydrodynamics.
Technology of Buoy Mooring Systems, 55-63, pub. S.U.T.
London.
Carson R.M. (1982) On the capsize performance of a discus buoy in deep sea
breakers, (submitted Ocean Eng. 1982).
Newman J.N. (1977) Marine Hydrodynamics.
pub. MIT press.
Rusby J.S.M. and Waites S.P. (1980) The deployment and operational performance
of the DBl data buoy system in the South-West Approaches
to the British Isles.
Oceans '80.
Table 1
DBl steady flow results
V (m/s)
2 (m)
T
(tonnes) (tonnes)
Tz (tonnes) I (m) x (m) 9*
(deg) (tonnes) 0.25 0 2 . 1 5 0.06 2.15 2.5 15 88.5 0.075
0.5 0 2.4 0.22 2.4 10 33 84.7 0.3
1 0 3.55 0.9 3.44 40 66 75.4 1.2
1 2 3.6 0.9 3.49 40 64 75.7 1.2
1 4 3.67 0.9 3.56 45 6 2 75.9 1.2
1 14 3.95 0.9 3.86 55 53 76.9 1.23
1.5 0 4.85 2.0 4.41 65 84 65.5 2 . 2 8
2 0 6.75 3.58 5.72 100 97 58.0 3.96
3 0 11.74 8.05 8.5 170 113 46.7 8.59
3 5 11.89 8.05 8.75 175 111 47.4 8.6
3 10 12.0 8.05 8.94 180 109 48.0 8.6
3.5 0 14.8 10.9 10.0 205 119 42.4 11.5
Table 2
steady flow results
V (m/s)
z (m)
T
(tonnes) (tonnes)
Tz (tonnes) I (m) x (m) (zf (deg) TA (tonnes)
0.5 0 1.4 0.15 1.39 25 88 83.7 0.24
1 0 2.36 0.61 2.28 80 159 75.0 0.92
1 10 2.47 0.61 2.39 90 148 75.6 0.92
1 20 2.57 0.61 2.5 105 138 76.2 0.93
1 30 2 . 6 8 0.61 2.61 115 128 76.8 0.93
1 40 2.79 0.61 2 . 7 2 125 117 77.3 0.94
1.5 0 3.67 1.38 3.4 150 200 68.0 1.94
2 0 5,25 2.45 4.65 215 2 2 8 6 2 . 2 3 . 2 8
2 10 5.37 2.45 4.78 2 2 5 221 6 2 . 9 3.3 2 20 5.49 2.45 4.91 2 4 0 214 63.5 3.32
2 30 5 . 6 2.45 5.04 2 5 0 207 64.1 3.34
2 4 0 5.72 2.45 5.17 2 6 0 200 64.7 3 . 3 6
2.5 0 7.1 3 . 8 2 5 . 9 8 2 8 0 2 4 8 57.4 4 . 9 2
3 0 9 . 1 9 5.5 7.36 3 5 0 2 6 4 5 3 . 2 6 . 8 4
Table 3
DB2^2) steady flow results
V (m/s) z (m) T (tonnes) t x (tonnes) Tz (tonnes) I (m) x
(m) (deg)
tA (tonnes)
0.5 0 1.77 0.15 1.76 ' 15 6 8 85.0 0.25
1 0 2.8 0.61 2.73 6 0 136 77.4 0.94
1 20 3.12 0.61 3 . 0 6 75 113 78.7 0.95
1 40 3.47 0.61 3.42 95 90 79.9 0.96
1.5 0 4.25 1.38 4.02 120 178 71.1 2.0
2 0 6.0 2.45 5.48 160 206 65.9 3.4
2 40 6 . 6 9 2.45 6.23 2 2 0 175 68.5 3.5
Table 4
Summary of results for extreme non-breaking waves taken from the combined dynamic and steady flow analyses
max. wave z = 0 Estimated for z = H
H (m) T P (s) max (tonnes) x
max I (m)
T (tonnes)
T z
(tonnes) (tonnes) I (m)
DBl 2 4
scale model
12.5
d from tests
7.9 112 170 12.5 9.6 8.6 195
0=2(1,
(25mm chain)
33 16 2.74 2 3 2 230 5.9 5.2 3.5 270
082(2,
(32mm chain)
33 16 2.7- 211 176 7.0 6.5 3.7 211
Table 5
Natural periods of buoy/mooring system (sec.)
dbl ==2(1,
(25imn chain)
0B2(2,
(31.75min chain)
...
(i) surge
35]
(. x = 100m 40 J
681
> x = 220m 58j
111
V x = 190m 66 J
(ii) heave
51.6
59.6
62.7
72.7
50.0
57.9
... braidline (ill) ,
elasticity
7.8
9.1
22.3
25.8
22.3
25.8
Table 6
Mooring natural periods in transverse oscillations (as a stretched string)
LOW LOAD HIGH LOAD
L(m) Tave(W) (kg/m) Tp^(s) tpz's) L(m) T ave (N) (kg/m) T p i( s )
DBl 165 10180 24.7 16.3 8.2 335 103500 3 2 . 8 11.9 5.9
4 0 0 4780 10.4 37.3 18.7 630 46107 12.8 21.0 10.5
""(2) 4 0 0 7 0 0 8 11.6 32.5 16.3 611 52680 16.7 21.8 10.9
-F I G . 1
cia\urrt lacalu3v\. z. = 2. i v = 0 velocity fsrofllii
50tn
125m
165m
%
oc * -iS^;
2 5 m 4l mm choin 307 N/m SCf, = J27 m' per wiib IcngUi
>00 m
8) m m bravdliao. 3.98 N/m cb= 1.2
6l mm cJvxin. lom ojj- btd
z - o
• '• scj,cr n.lm •i
?
-5chenrLat"ic rc-prcsantatlon of the, D B l m o o r i a g for the.
•5taaclL| f l o w namcn'cal m o d a l - s h o w n a t d a i x j m a n d s t e a d y staba, Looxbion f o r givnn V a n d E.
Braidb'r) (Z. 81mm d i d n y l o n Vifeihg ; 136 bonnes b r e a k . ; £-==- 17(o M w / m ^
Chain
•• Mmm high strangth stud Dnk. •. too tonnes brciafe.
wt. in air 36 kg/m
[image:23.603.54.547.57.802.2]FIG 2 - 5
r & s l o n n q V h r i a moor
Fig. 5 V a r i a t i o n i n vdrtCcgl f o r c e compongnt valBi hoavQ.-D B l
V= 3m/3 X = 6 tonncia
[image:24.600.29.552.40.800.2]@_E= Zk-m |^„= 1^.32 N/m
.;v=lm/5 t "0.9 tonme>
32U- N/fn
2 (m)
FIGI. K'
200-oc (m)
r 1(3. 5
\ (tonnes)
200.
occm) 200.
DBA dunamfc rasponsc
Wava. group piriod 82.fo &
a wavds (3> il3m , k h s a€D' 2.&7ma
2 " " 2(1 m, t2.5£»(3^=^ &>.oim/s im/s
txmac' ^ 9 bonnes ^mox. ^ ^2. in
= lOOrri
F i g 6
5 0 m
200 m
3 5 0 m
koo
m-6 ^
- c d _
5c^ ts
2 5 m .. 2 5 mm cKqia.
127.5 n/m
• Ofcfcm^ per unit fiuiglK
• 325 m
WLmm b'CitdLin.e. 2.55 m/m
cpr 1.2
_ 2
sca= "-tw
2 5 mm cKoim. 50m olj- bwi
(p) cc:r 2 = 0
S c h c . r n a t ( c r c p r c s a n t o - t v o n of t h e 5 6 2 (\) m o o r i n g i n W o m o f waVar for the s t e a d y f l o w n u m a r i c a l made. I S r a i d U n c - : 64mm d i d nylon Vifeinq •• 9ofconnc3 b r o o k 3 0 5 MM/m'
FIG. 7 - 8
3 0 0
FIG 7
VgriRbions in mooring ond
RESTORINGtorcQ-S to/6h sLgodq drift - D52(i)
IFL P
x . ( m )
(tonnes) V ? 2 m / & : Tv= 2 . b 5 tonnes
ku=_l23_n/m
Yr 1 m/s Tx.-r' O. <£"1 tonn<z6
n / m
i F i g a Voricx-^'ion "m m o o r i n g v(Lrbical f o r o L com p e n a n t t i b l t h h e g v g . D & 2 (q
[image:28.601.30.547.50.759.2]FlCa. 9
zoo
V a r i a t i o n L n c a b l c a n q i Q . Q fcm b u 6 q
w i t h i d r i f t f o r ! E = 0 .
<b (dagrtcls)
brift (m) 3 (p
4.
-Tx (tonnes)
DB2,(i) dynamic rtisporBg.
0.
V (m/s) CC (m/s)
_ J — I I — I I 1 1 1 — I I I 1 I I I I I I I I I 1 I I I I I 1 I I I I I I I I I I 1 I I I I I t I I I I I I t I I I I I I I I I I
100.
200. 300. 400. 500.600.
VJavo. group period I0& s
4- wavoa 16.5m, las — a<o= e.as m/s 2 ^ *• 33 rf\ , ibs —dio c rrv/s
Vft = I lYl/s
2.74 tonnas
^mci* ^ ^32 m 2zom
ac Cm)
200.
0. _1 I I I I I I I I I I I I I I I I I I I I I I I I I I I 1 I I I 1 1 I I I 1 1 I 1 1 1 1 1 1 1 1 1 1 1 1 1 1 1 1 — ! 1 ! 1 1 L .
FIG. 12
3 0 0
as o
o c ( m )
kw= 181- n / m ; V= 2 m /s 2.liB Lonn&s
( t o n n t s ) 5
k,rt = IG9 N / m : V = 1 m / s 11 = 0.W conn&s
V g r i d k l o n s in m o o f i n q f o r c e s o n d r g . s t o r i n g forcas • <Z)Uh d r i f t a n d h e a v t L - D & 2 (7,)
[image:32.604.29.552.32.793.2]r l\3. »0
% (lonnc6)
d&2cc>-) dynamic nzsponsc
Ve.Locity f t c l d c& F i s ii
"'""max " tomizs ^max ^ m m ^maan^ l90rn
_1 L - _ i I I l _ _ l I I I I I I I 1 1 I 1 1 I I I 1 1 1 1 L — 1 1 1 1 1 1 1 — I — 1 1 1 1 1 1 — 1 L _ J 1 1 1 1 1 1—i—I—J l _ J 1 1 1 — 1 1 1 1_
0.
100.
200. 300. 400. 500. 600.X (m)
200.
0. I I I 1 L ,1 l _ - J l _ J I 1 1 — 1 I 1 1 1 1 1 1 1 L _ 1 1 L — l 1 1 1 1 — I 1 1 — I 1 — I - - I L — I U _1 1 1 1 1 1 1 1 1 1 1 1 1 1 1 1 I L .
FI&. 14.
! N Q b u m l p e r i o d in surqg.
tp:6y_
^7 / / //•/•/• /^-rj- > / / -7-/ / / /——// // y / /
cc (m)
3 0 0