Comparison of Protein Profiles in Sputum between COPD
and Acute Exacerbation of COPD
Soo-Taek Uh1, Seung Ah Ko1, An Soo Jang2, Sung Woo Park2, Yong-Hoon Kim3, Young-Ki Paik4, Choon Sik Park2*
1Division of Respiratory and Allergy Medicine, Soonchunhyang University Hospital,
Seoul, South Korea
2Genome Research Center for Allergy and Respiratory Disease, Soonchunhyang University Bucheon Hospital,
Bucheon, South Korea
3Division of Respiratory Medicine, Soonchunhyang University, Chunan Hospital, Asan, South Korea
4Yonsei Proteome Research Center, Department of Biochemistry and Biomedical Science, College of Life Science and
Biotechnology, Yonsei University, Seoul, South Korea Email: uhs@schmc.ac.kr, *mdcspark@unitel.co.kr
Received January 25, 2012; revised March 7, 2012; accepted March 15, 2012
ABSTRACT
Background and Objective: Chronic obstructive pulmonary disease (COPD) is characterized by progressive airflow
limitation that is associated with an abnormal inflammatory response of the lung to noxious particles or gases. Cigarette smoking is the major risk factor for the development of COPD. This study evaluated the levels of cyclophilin B in sputa from patients with COPD and COPD with acute exacerbation (AECOPD). Materials and Methods: Two-dimensional
electrophoresis was used for differential display proteomics. Western blotting was used to identify and quantify cyclo-philin B in sputum from subjects with AECOPD and COPD. Results: Forty-nine protein spots differed in relative
in-tensity between the AECOPD (n = 6) and COPD (n = 6) subjects. Twenty proteins showed increased expression in the sputum of AECOPD subjects, and 29 proteins were present at lower levels in AECOPD sputum compared with COPD sputum. One of these proteins was associated with cyclophilin B. Cyclophilin B concentrations were lower in sputum from subjects with COPD (n = 4) versus AECOPD (n = 4). Conclusion: The sputum proteomic analysis suggests that
changes in various proteins are associated with the development of AECOPD.
Keywords: Proteomics; COPD; Acute Exacerbation; Chromatography, Liquid; Mass Spectrometry
1. Introduction
Chronic obstructive pulmonary disease (COPD) is char-acterized by slowly progressive airway limitation due to abnormal pulmonary inflammatory reactions [1]. The incidence of COPD has been increasing in recent decades, and it is projected to rank third as the cause of death by 2020 [2]. Of the Korean population older than 45 years, 17.2% have airway obstruction in which the forced expi-ratory volume in one second (FEV1)/forced vital capacity
(FVC) ratio is <0.7, emphasizing the clinical implications of COPD [3]. A cross-sectional study reported that the mortality rate increased to 2.5% in COPD patients with acute exacerbation (AECOPD) [4], and acute exacerba-tion can reduce the long-term survival of patients with COPD [5,6].
Therefore, it is important to identify a marker of AE-COPD in order to detect and treat exacerbations early.
Markers such as serum surfactant protein D have been evaluated in patients with AECOPD, but no one marker can distinguish between COPD and AECOPD [7,8]. The identification of respiratory disease-specific proteins in the airway and alveolar lining fluids will help to improve the early detection, prognosis, and treatment of these diseases. Therefore, large-scale, high-throughput, whole- proteome studies of bronchoalveolar lavage (BAL) fluids using two-dimensional electrophoresis (2DE) and ma-trix-assisted laser desorption/ionization time-of-flight (MALDI-ToF) mass spectroscopy (MS) have been con-ducted to determine the proteomic contribution to asthma and idiopathic pulmonary fibrosis [9,10].
2. Materials and Methods
2.1. Patients and Sputum Collection
ing for more than 10 pack-years; and 3) no abnormal findings of obstructive airway disease such as advanced inactive tuberculosis or severe bronchiectasis on chest X-rays. A bronchodilator test was performed before and 6 weeks after an acute exacerbation. AECOPD was de-fined as an event in the natural course of the disease characterized by a change in the patient’s baseline dysp-nea, cough, or sputum that was beyond the normal day-to-day variation, was acute in onset, and warranted a change in regular medication in a patient with underlying COPD [1]. Sputum was collected on the first day of an acute exacerbation and 6 - 7 weeks after the acute exac-erbation. The patients’ clinical characteristics are sum-marized in Table 1.
The study was approved by the ethics committee, and all subjects provided informed consent.
2.2. Sputum Preparation
All visibly more-solid portions of the sputum were se-lected carefully and placed in a preweighed Eppendorf tube, to which four volumes of 0.1% dithiothreitol (Spu-tolysin; Calbiochem, San Diego, CA, USA) was added. One volume of protease inhibitors (0.1 MEDTA and 2 mg/ml phenylmethylsulfonyl fluoride) was added to 100 volumes of the homogenized sputum, and the total cell count was determined with a hemocytometer. The ho-mogenized sputum was spun in a cytocentrifuge, and 500 cells were examined on each sputum slide stained with Diff-Quik solution (American Scientific Products, Chi-cago, IL, USA). The homogenized sputum sample was centrifuged at 1000 × g for 5 min, and the supernatant was collected and stored at –70˚C for subsequent
analy-sis. Bacterial cultures and tests to detect rhinoviruses were performed in cases of exacerbated COPD. A pha-ryngeal swab was obtained and inoculated onto cell mo-nolayers to isolate influenza A and B; parainfluenza 1, 2, and 3; adenovirus; and respiratory syncytial virus. Hu-man rhinoviruses were detected using reverse transcrip-tase-polymerase chain reaction with rhinovirus-specific primers.
2.3. Sample Preparation, Two-Dimensional Electrophoresis, and Image Analysis
[image:2.595.63.541.504.696.2]Sputum samples containing 200 μg of protein from each patient were pooled for the two-dimensional analysis. One milligram of protein from the pooled sputum was precipitated with 10% trichloroacetic acid in acetone and resuspended in the sample solution. Immobiline Dry Strips (Amersham Biosciences) were used for isoelectric focusing (IEF), which was performed with 1 mg of the extracted protein on a Multiphor II™ electrophoresis system (GE Healthcare). After IEF separation, the pro-teins were separated in the second dimension by sodium dodecyl sulfate-polyacrylamide gel electrophoresis (SDS- PAGE). For image analysis, the gels were visualized with Coomassie Brilliant Blue G-250 according to the manufacturer’s instructions. The 2D gels were scanned by an ImageScanner (Bio-Rad) in transmission mode. Spot detection and matching were performed using Ima-geMaster 2D version 5.0 (Amersham Biosciences). Digi-tized images were analyzed using the program Image-Master to calculate each 2D spot intensity by integrating the optical density over the spot area (the spot “volume”), followed by normalization [11].
Table 1. Clinical characteristics of patients.
Ex-Sputum cell count St-Sputum cell count
Age/Sex PY* FEV
1L/% pred. exacerbation Cause of Virus Bacteria
Total M (%) N (%) Total M (%) N (%)
Treatment
1 82/M 60 1.60L/89 Pneumonia ND fluorescensputidaPseudomonas 14 1 99 55 8 92 + SAMA + AntiSS + SABA
2 82/M 35 1.53L/72 Pneumonia ND Micrococcus species 12 2 89 1 2 86 SS + SABA + Anti
3 68/M 60 0.89L/39 Pneumonia ND ND 2 2 91 12 43 35 SS + SABA+ Anti
4 78/M 50 1.00L/38 Unknown ND ND 190 1 99 9 3 96
SS + LAMA + SAMA +
SABA
5 63/M 90 1.47L/56 Pneumonia ND Staphylococcus capitis 18 5 89 10 40 56 SS + SABA + Anti
6 56/M 20 2.89L/80 Pneumonia ND Subspecies capitis 45 7 78 4.8 60 24 SS + SABA + Anti
Definition of abbreviations:PY: Smoking, pack-years; FEV1: Forced expiratory volume in 1 second. This value was the most recent data before exacerba-tion; % pred: % predicted; Ex-Sputum cell count: Sputum cell count during exacerbation state; St-Sputum cell count: Sputum cell count during stable state; Total: Total cell count, × 105/mL; M: Macrophage; N: Neutrophil; ND: Not-detected; SS: Systemic steroid; SABA: Short acting beta-2 agonist; SAMA: Short
citng muscarinic antagonist; Anti: Antibiotics; LAMA: Long acting muscarinic antagonist. a
2.4. Protein Identification by Nano-LC-MS/MS and Database Searching
Differentially expressed protein spots were excised from the 2D gels, cut into smaller pieces, and digested with trypsin (Promega), as described previously [12]. All LC-MS/MS experiments were performed using Agilent Nanoflow Proteomics Solution with an Agilent 1100 Series nano-LC system. For MS/MS, this was coupled through an orthogonal nanospray ion source to an Agi-lent 1100 Series LC/MSD Trap XCT ion trap mass spec-trometer.
The nano-LC system was operated in sample ment/desalting mode with a Zorbax 300SB-C18 enrich-ment column (0.3 × 50 mm, 5 μm). Chromatography was performed using a Zorbax 300SB-C18 (75 μm × 150 mm) nanocolumn. The column was eluted with a gradient be-ginning with isocratic application of 3% solvent B (0.1% formic acid in acetonitrile) and 97% solvent A (0.1% formic acid in water) for 5 min and changing to 10% B over 5 min (from 5 to 10 min), to 45% B over 40 min (10 - 50 min), to 90% B (isocratic) for 5 min (55 - 60 min), and to 3% B over 1 min (60 - 61 min). Finally, the col-umn was washed with 3% B for 10 min.
The LC/MSD Trap XCT was operated in unique pep-tide scan Auto-MS/MS mode. The ionization mode was positive nanoelectrospray with an Agilent orthogonal source. The drying gas flowed at 5 L/min at a tempera-ture of 300˚C. Vcap was typically 1800 - 1900 V with
skim 1 at 30 V, and the capillary exit was offset at 75 V. The trap drive was set at 85 V with averages of one or two. The ion charge control was on with a maximum accumulation time of 150 ms, the smart target was 125,000, and the MS scan range was 300 - 2200. Auto-matic MS/MS was performed in ultrascan mode with the number of parents at 2, averages of two fragmentation amplitude of 1.15 V, SmartFrag on (30% - 200%), active
exclusion on (after-two spectra for 1 min), prefer +2 on, MS/MS scan range of 100 - 1800, and ultrascan on. Each acquired MS/MS spectrum was searched against the non-redundant protein sequence database using Spectrum Mill software [12].
2.5. Detecting Cyclophilin B in Sputum by Western Blotting
First, 200 μg of protein were electrophoresed in a 15% polyacrylamide gel with a discontinuous system. The proteins were transferred to a nitrocellulose membrane at 120 V for 40 min. The membrane was blocked with 5% skim milk and 0.1% NP40 in Tris-buffered saline for 2 h at room temperature, and incubated overnight with a 1:500 dilution of rabbit polyclonal antibody against cyc-lophilin B at 4˚C. The membrane was incubated with horseradish peroxidase (HRP)-conjugated anti-rabbit IgG (1:5000 dilution) for 1 h at room temperature. The target protein was detected using enhanced chemiluminescence solution (Amersham Pharmacia Biotech, Little Chalfont, Buckinghamshire, England).
3. Results
3.1. Two-Dimensional Electrophoresis and Protein Analysis
Moderate differences were observed in the sputum pro-tein profiles between patients with COPD and AECOPD (Figure 1). There were no increases in low-molecular-
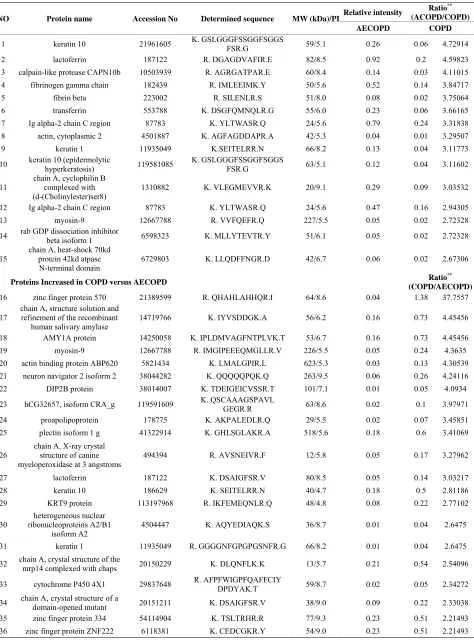
weight proteins in sputum from patients with AECOPD, suggesting there were no factors enhancing the prote-olytic degradation of sputum in patients with AECOPD. Forty-nine spots with expression differences greater than two-fold between sputum from patients with COPD and AECOPD were selected for analysis (Table 2).
Us-ing LC/MSD Trap XCT MS after tryptic digestion, we
[image:3.595.145.456.537.707.2]Table 2. List of proteins found differentially expressed between patients with COPD and AECOPD.
Relative intensity Ratio
**
(ACOPD/COPD) NO Protein name Accession No Determined sequence MW (kDa)/PI
AECOPD COPD
1 keratin 10 21961605 K. GSLGGGFSSGGFSGGS FSR.G 59/5.1 0.26 0.06 4.72914
2 lactoferrin 187122 R. DGAGDVAFIR.E 82/8.5 0.92 0.2 4.59823
3 calpain-like protease CAPN10b 10503939 R. AGRGATPAR.E 60/8.4 0.14 0.03 4.11015
4 fibrinogen gamma chain 182439 R. IMLEEIMK.Y 50/5.6 0.52 0.14 3.84717
5 fibrin beta 223002 R. SILENLR.S 51/8.0 0.08 0.02 3.75064
6 transferrin 553788 K. DSGFQMNQLR.G 55/6.0 0.23 0.06 3.66165
7 Ig alpha-2 chain C region 87783 K. YLTWASR.Q 24/5.6 0.79 0.24 3.31838
8 actin, cytoplasmic 2 4501887 K. AGFAGDDAPR.A 42/5.3 0.04 0.01 3.29507
9 keratin 1 11935049 K.SEITELRR.N 66/8.2 0.13 0.04 3.11773
10 keratin 10 (epidermolytic hyperkeratosis) 119581085 K. GSLGGGFSSGGFSGGS FSR.G 63/5.1 0.12 0.04 3.11602
11
chain A, cyclophilin B complexed with (d-(Cholinylester)ser8)
1310882 K. VLEGMEVVR.K 20/9.1 0.29 0.09 3.03532
12 Ig alpha-2 chain C region 87783 K. YLTWASR.Q 24/5.6 0.47 0.16 2.94305
13 myosin-9 12667788 R. VVFQEFR.Q 227/5.5 0.05 0.02 2.72328
14 rab GDP dissociation inhibitor beta isoform 1 6598323 K. MLLYTEVTR.Y 51/6.1 0.05 0.02 2.72328
15
chain A, heat-shock 70kd protein 42kd atpase N-terminal domain
6729803 K. LLQDFFNGR.D 42/6.7 0.06 0.02 2.67306
Proteins Increased in COPD versus AECOPD Ratio
**
(COPD/AECOPD)
16 zinc finger protein 570 21389599 R. QHAHLAHHQR.I 64/8.6 0.04 1.38 37.7557
17
chain A, structure solution and refinement of the recombinant
human salivary amylase
14719766 K. IYVSDDGK.A 56/6.2 0.16 0.73 4.45456
18 AMY1A protein 14250058 K. IPLDMVAGFNTPLVK.T 53/6.7 0.16 0.73 4.45456
19 myosin-9 12667788 R. IMGIPEEEQMGLLR.V 226/5.5 0.05 0.24 4.3635
20 actin binding protein ABP620 5821434 K. LMALGPIR.L 623/5.3 0.03 0.13 4.30539
21 neuron navigator 2 isoform 2 38044282 K. QQQQQPQK.Q 263/9.5 0.06 0.26 4.24116
22 DIP2B protein 38014007 K. TDEIGEICVSSR.T 101/7.1 0.01 0.05 4.0934
23 hCG32657, isoform CRA_g 119591609 K. QSCAAAGSPAVL GEGR.R 63/8.6 0.02 0.1 3.97971
24 proapolipoprotein 178775 K. AKPALEDLR.Q 29/5.5 0.02 0.07 3.45851
25 plectin isoform 1 g 41322914 K. GHLSGLAKR.A 518/5.6 0.18 0.6 3.41069
26 chain A, X-ray crystal structure of canine myeloperoxidase at 3 angstroms
494394 R. AVSNEIVR.F 12/5.8 0.05 0.17 3.27962
27 lactoferrin 187122 K. DSAIGFSR.V 80/8.5 0.05 0.14 3.03217
28 keratin 10 186629 K. SEITELRR.N 40/4.7 0.18 0.5 2.81186
29 KRT9 protein 113197968 R. IKFEMEQNLR.Q 48/4.8 0.08 0.22 2.77102
30
heterogeneous nuclear ribonucleoproteins A2/B1
isoform A2
4504447 K. AQYEDIAQK.S 36/8.7 0.01 0.04 2.6475
31 keratin 1 11935049 R. GGGGNFGPGPGSNFR.G 66/8.2 0.01 0.04 2.6475
32 chain A, crystal structure of the mrp14 complexed with chaps 20150229 K. DLQNFLK.K 13/5.7 0.21 0.54 2.54096
33 cytochrome P450 4X1 29837648 R. AFPFWIGPFQAFFCIY DPDYAK.T 59/8.7 0.02 0.05 2.34272
34 chain A, crystal structure of a domain-opened mutant 20151211 K. DSAIGFSR.V 38/9.0 0.09 0.22 2.33038
35 zinc finger protein 334 54114904 K. TSLTRHR.R 77/9.3 0.23 0.51 2.21493
shown). This suggests that calpains are not important in exacerbation of COPD. The 70-kDa HSP was increased in patients with AECOPD. This can be explained by stress and inflammation in the lung caused by infection during AECOPD [16]. The 70-kDa HSP protein is likely an end product of AECOPD.
identified 15 proteins with increased expression in pa-tients with AECOPD and 21 proteins with increased ex-pression in patients with COPD.
Calpain-like protease (CAPN10b), cyclophilin B, Rab GDP dissociation inhibitor, and 70-kDa heat-shock pro-tein (HSP) were increased in sputum from patients with AECOPD compared with COPD. By contrast, lactoferrin, DIP2B, proapolipoprotein, and actin binding protein were increased in patients with COPD compared with AECOPD.
The majority of cells in sputum during the acute exac-erbations were neutrophils, with a mean differential of 91%. Neutrophils decreased to 65% by 6 weeks after the acute exacerbation, suggesting that the proteomic differ-ences seen in the present study depend on neutrophil proteins. However, the proteomic differences between an acute exacerbation and stable COPD seen in this study do not seem to depend on neutrophil proteins because the identified proteins were completely different from those seen in a proteomic study using whole human neutrophils [17,18]. The proteomic differences identified in our study should be compared with the proteomic differences be- tween “activated” and “stable” neutrophils to determine whether activated neutrophils are a major determinant of our findings. Avram et al. [19] showed that lactoferrin and vimentin are major tyrosyl proteins in neutrophils activated by phorbol myristate acetate or tissue necrosis factor-α (TNF-α). Therefore, we postulate that our results are related to proteins other than those produced by acti- vated neutrophils.
3.2. Western Blotting for Cyclophilin B in Sputum
To investigate whether cyclophilin B expression was altered in sputum (Figure 2), we performed Western blot
analysis of sputum obtained from similar subjects with AECOPD (n = 4) and COPD (n = 4) using an antibody specific for cyclophilin B. All patients with AECOPD expressed the protein in sputum, while the protein was not expressed in sputum from patients with COPD.
4. Discussion
In this study, we identified inflammation-related proteins that were increased in sputum from patients with AE- COPD. Although the roles of these proteins are unknown, their possible use as biomarkers of AECOPD deserves study.
One limitation of our study is the cause of AECOPD. In this study, the most common cause of AECOPD was infection [1]. The proteomic results may reflect differ-ences between infected and non-infected lung. Second, we could not verify the transcription or translation of the identified proteins in lung tissues because we could not obtain lung tissue samples from the patients with AE-COPD. Third, pooled sputum, not individual sputum samples, was used for the proteomics study because in-dividual samples do not contain sufficient protein. This made it difficult to interpret differences in protein ex-pression between patients with COPD and AECOPD. If a specific protein were significantly increased in a single patient with AECOPD, this protein may not also be ele-vated in the pooled sample.
Cyclophilin B is a cyclosporine-binding protein ex-pressed mainly within the endoplasmic reticulum. Cyc-lophilin B also binds to lymphocytes [13] and may regu-late cyclosporine-mediated immunosuppression. We could not identify the mechanism underlying the increased level of cyclophilin B in patients with AECOPD. There-fore, cyclophilin B may be involved in the development of AECOPD or may be an end product. Similar to C- reactive protein, an inflammatory marker in COPD [14], cyclophilin B may be a marker of inflammation in pa- tients with AECOPD. An elevated cyclophilin B level in AECOPD was verified by Western blot analysis of spu- tum.
In conclusion, the proteomic analysis of sputum sug-gests that changes in the expression of various proteins are associated with the development of AECOPD. Calpains are calcium-regulated proteases involved in
cellular functions, including muscle proteolysis in cy-toskeletal remodeling and signal transduction [15]. The calpain protein level on Western blots did not differ
be-tween patients with AECOPD and COPD (data not
5. Acknowledgements
[image:5.595.57.287.654.699.2]This work was supported by grants from the Korea Health 21 R&D Project, Ministry of Health, Welfare, and Family Affairs, Republic of Korea (A010249, A090548, and A030003).
Figure 2. Western blot of cyclophilin B. The 21-kDa cyclo-philin B band (arrow) was detected in all patients with AECOPD (n = 4), but rarely in patients with COPD (n = 4).
REFERENCES
P. Calverley, Y. Fukuchi, C. Jenkins, R. Rodriguez-Roisin, C. van Weel and J. Zielinski, “Global Strategy for the Diagnosis, Management, and Prevention of Chronic Ob- structive Pulmonary Disease: GOLD Executive Sum- mary,” American Journal of Respiratory & Critical Care Medicine, Vol. 176, No. 6, 2007, pp. 532-555.
doi:10.1164/rccm.200703-456SO
[2] K. R. Chapman, D. M. Mannino, J. B. Soriano, P. A. Vermeire, A. S. Buist, M. J. Thun, C. Connell, A. Jemal, T. A. Lee, M. Miravitlles, S. Aldington and R. Beasley, “Epidemiology and Costs of Chronic Obstructive Pulmo- nary Disease,” European Respiratory Journal, Vol. 27, No. 1, 2006, pp. 188-207.
doi:10.1183/09031936.06.00024505
[3] D. S. Kim, Y. S. Kim, K. S. Jung, J. H. Chang, C. M. Lim, J. H. Lee, S. T. Uh, J. J. Shim and W. J. Lew, “Prevalence of Chronic Obstructive Pulmonary Disease in Korea: A Population-Based Spirometry Survey,” American Journal of Respiratory & Critical Care Medicine, Vol. 172, No. 7, 2005, pp. 842-847. doi:10.1164/rccm.200502-259OC [4] S. P. Patil, J. A. Krishnan, N. Lechtzin and G. B. Diette,
“In-Hospital Mortality Following Acute Exacerbations of Chronic Obstructive Pulmonary Disease,” Archives of In-ternal Medicine, Vol. 163, No. 10, 2003, pp. 1180-1186. doi:10.1001/archinte.163.10.1180
[5] C. Ai-Ping, K. H. Lee and T. K. Lim, “In-Hospital and 5-Year Mortality of Patients Treated in the ICU for Acute Exacerbation of COPD: A Retrospective Study,” Chest, Vol. 128, No. 2, 2005, pp. 518-524.
doi:10.1378/chest.128.2.518
[6] J. Berkius, T. Nolin, C. Mardh, G. Karlstrom and S. M. Walther, “Characteristics and Long-Term Outcome of Acute Exacerbations in Chronic Obstructive Pulmonary Disease: An Analysis of Cases in the Swedish Intensive Care Registry during 2002-2006,” Acta Anaesthesiologica Scandinavica, Vol. 52, No. 6, 2008, pp. 759-765. doi:10.1111/j.1399-6576.2008.01632.x
[7] M. Cazzola, W. MacNee, F. J. Martinez, K. F. Rabe, L. G. Franciosi, P. J. Barnes, V. Brusasco, P. S. Burge, P. M. Calverley, B. R. Celli, P. W. Jones, D. A. Mahler, B. Make, M. Miravitlles, C. P. Page, P. Palange, D. Parr, M. Pistolesi, S. I. Rennard, M. P. R. Van Molken, R. Stockley, S. D. Sullivan, J. A. Wedzicha and E. F. Wouters, “Out-comes for COPD Pharmacological Trials: From Lung Function to Biomarkers,” European Respiratory Journal, Vol. 31, No. 2, 2008, pp. 416-469.
doi:10.1183/09031936.00099306
[8] D. A. Lomas, E. K. Silverman, L. D. Edwards, N. W. Locantore, B. E. Miller, D. H. Horstman and R. Tal- Singer, “Serum Surfactant Protein D Is Steroid Sensitive and Associated with Exacerbations of COPD,” European Respiratory Journal, Vol. 34, No. 1, 2009, pp. 95-102. doi:10.1183/09031936.00156508
[9] B. Magi, L. Bini, M. G. Perari, A. Fossi, J. C. Sanchez, D. Hochstrasser, S. Paesano, R. Raggiaschi, A. Santucci, V. Pallini and P. Rottoli, “Bronchoalveolar Lavage Fluid Pro- tein Composition in Patients with Sarcoidosis and Idio- pathic Pulmonary Fibrosis: A Two-Dimensional Electro- phoretic Study,” Electrophoresis, Vol. 23, No. 19, 2002, pp. 3434-3444.
doi:10.1002/1522-2683(200210)23:19<3434::AID-ELPS 3434>3.0.CO;2-R
[10] K. Larsen, J. Malmstrom, M. Wildt, C. Dahlqvist, L. Hansson, G. Marko-Varga, L. Bjermer, A. Scheja and G. Westergren-Thorsson, “Functional and Phenotypical Com- parison of Myofibroblasts Derived from Biopsies and Bronchoalveolar Lavage in Mild Asthma and Scleroderma,”
Respiratory Research, Vol. 7, No. 1, 2006, p. 11. [11] M. H. Cha, T. Rhim, K. H. Kim, A. S. Jang, Y. K. Paik
and C. S. Park, “Proteomic Identification of Macrophage Migration-Inhibitory Factor upon Exposure to TiO2 Parti-cles,” Molecular & Cellular Proteomics, Vol. 6, No. 1, 2007, pp. 56-63. doi:10.1074/mcp.M600234-MCP200 [12] A. Shevchenko, M. Wilm, O. Vorm and M. Mann, “Mass
Spectrometric Sequencing of Proteins Silver-Stained Poly- acrylamide Gels,” Analytical Chemistry, Vol. 68, No. 5, 1996, pp. 850-858. doi:10.1021/ac950914h
[13] M. Carpentier, F. Allain, M. C. Slomianny, S. Durieux, C. Vanpouille, B. Haendler and G. Spik, “Receptor Type I and Type II Binding Regions and the Peptidyl-Prolyl Isomerase Site of Cyclophilin B Are Required for En- hancement of T-Lymphocyte Adhesion to Fibronectin,”
Biochemistry, Vol. 41, No. 16, 2002, pp. 5222-5229. doi:10.1021/bi015951j
[14] A. Bircan, M. Gokirmak, O. Kilic, O. Ozturk and A. Ak- kaya, “C-Reactive Protein Levels in Patients with Chronic Obstructive Pulmonary Disease: Role of Infection,” Medi- cal Principles and Practice, Vol. 17, No. 3, 2008, pp. 202-208. doi:159/000117793
[15] Y. Yuan, S. M. Dopheide, C. Ivanidis, H. H. Salem and S. P. Jackson, “Calpain Regulation of Cytoskeletal Signaling Complexes in Von Willebrand Factor-Stimulated Plate- lets: Distinct Roles for Glycoprotein Ib-V-IX and Glyco- protein IIb-IIIa (Integrin AlphaIIbbeta3) in Von Willebrand Factor-Induced Signal Transduction,” Journal of Biological Chemistry, Vol. 272, No. 35, 1997, pp. 21847-21854. doi:10.1074/jbc.272.35.21847
[16] S. P. Ribeiro, J. Villar, G. P. Downey, J. D. Edelson and A. S. Slutsky, “Sodium Arsenite Induces Heat Shock Pro- tein-72 Kilodalton Expression in the Lungs and Protects Rats against Sepsis,” Critical Care Medicine, Vol. 22, No. 6, 1994, pp. 922-929.
doi:10.1097/00003246-199406000-00008
[17] G. G. Tomazella, I. da Silva, H. J. Laure, J. C. Rosa, R. Chammas, H. G. Wiker, G. A. de Souza and L. J. Greene, “Proteomic Analysis of Total Cellular Proteins of Human Neutrophils,” Proteome Science, Vol. 7, No. 8, 2009, p. 32. [18] M. de Souza Castro, N. M. de Sa, R. P. Gadelha, M. V. de
Sousa, C. A. Ricart, B. Fontes and W. Fontes, “Proteome Analysis of Resting Human Neutrophils,” Protein and Peptide Letters, Vol. 13, No. 5, 2006, pp. 481-487. doi:10.2174/092986606776819529
[19] D. Avram, E. P. Romijn, E. H. Pap, A. J. Heck and K. W. Wirtz, “Identification of Proteins in Activated Human Neutrophils Susceptible to Tyrosyl Radical Attack: A Proteomic Study Using a Tyrosylating Fluorophore,”