STABILITY INDICATING ANALYTICAL METHOD DEVELOPMENT AND VALIDATION FOR THE
SIMULTANEOUS ESTIMATION OF PARACETAMOL AND ETODOLAC USING RP
METHOD IN BOTH BULK AND PHARMACEUTICAL DOSAGE FORM
*Hepsebah, N.
Mewar University
ARTICLE INFO ABSTRACT
A simple and effective RP
Etodolac in tablet dosage form, using Inertsil ODS C18 (250 x 4.6 mm,
Acetonitrile and water (60:40), detection wavelength at 269 nm, at flow rate of 1ml/min at retention time 3.206 min for paracetamol, 4.825 min for etodolac. Linearity was obtained in the range of 18.46 µg/ml to 55.38 µg/ml for paracetamo
for the drugs. The Recovery studies were performed for paracetamol and etodolac in the range of 50% - 150 %. The % Assay for paracetamol is 98.85% and etodolac is 99.81 %. Forced Degradation were conducted according to the ICH guidelines and the Drug Product was found to be stable in all conditions. Hence, the method could be successfully applied for routine analysis of Paracetamol and Etodolac in combined dosage form.
Copyright©2017, Hepsebah and Ashok Kumar. This
unrestricted use, distribution, and reproduction in any medium, provided the original work is properly cited.
INTRODUCTION
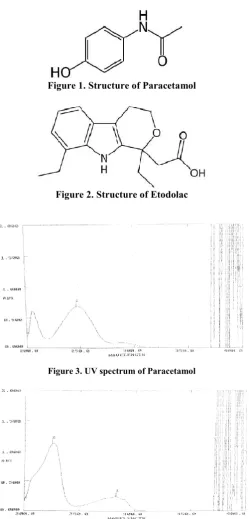
Paracetamol (Figure 1) is chemically N-(4
acetamide (Siva Rama Krishna et al., 2014
chemically 1,8-Diethyl-1,3,4,9-tetrahydropyrano (3,4
1-acetic acid. Both
these
drugs belong to class of nonsteroidalanti-inflammatory drugs (NSAIDs). A combination of 325mg of Paracetamol and 400 mg of Etodolac is available commercially as tablet. This combination is used as analgesic and antipyretic. Etodolac (Figure 2) is a NSAID and its IUPAC
name is (RS)-2-(1,8-Diethyl-4, 9-dihydro-3
indol-1-yl)acetic acid. This drug is used for the management of mild to moderate pain, fever, and inflammation. It works by reducing the levels of prostaglandins, which are chemicals that are responsible for pain and the fever and tenderness that occur with inflammation. Etodolac blocks the cyclooxyg enzymes which form prostanoids, resulting in lower
concentrations of prostaglandins. As a consequence,
inflammation, pain and fever are reduced (Sruthi
Kallur et al., 2013; Mithlesh et al., 2015).
MATERIALS AND METHODS
Chemicals and reagents: Analytically pure sample of paracetamol and etodolac with purities greater than 99% were
*Corresponding author:Hepsebah, N. J. R.
Mewar university, Gangrar, Chittorgarh, Rajasthan, India
ISSN: 0975-833X
Article History: Received 28th May, 2017 Received in revised form 15th June, 2017
Accepted 26th July, 2017
Published online 31st August, 2017
Citation: Hepsebah, N. J. R. and Ashok Kumar, A.
estimation of paracetamol and etodolac using Rp-HPLC method in both bulk and pharmaceutical dosage form (08), 56385-56390.
Key words:
Paracetamol, Etodolac, RP-HPLC, ICH.
RESEARCH ARTICLE
STABILITY INDICATING ANALYTICAL METHOD DEVELOPMENT AND VALIDATION FOR THE
SIMULTANEOUS ESTIMATION OF PARACETAMOL AND ETODOLAC USING RP
METHOD IN BOTH BULK AND PHARMACEUTICAL DOSAGE FORM
Hepsebah, N. J. R. and Ashok Kumar, A.
University, Gangrar, Chittorgarh, Rajasthan, India
ABSTRACT
A simple and effective RP-HPLC method had been developed for the estimation of Paracetamol and Etodolac in tablet dosage form, using Inertsil ODS C18 (250 x 4.6 mm,
Acetonitrile and water (60:40), detection wavelength at 269 nm, at flow rate of 1ml/min at retention time 3.206 min for paracetamol, 4.825 min for etodolac. Linearity was obtained in the range of 18.46 µg/ml to 55.38 µg/ml for paracetamol and etodolac. The correlation coefficient was found to be 0.999 for the drugs. The Recovery studies were performed for paracetamol and etodolac in the range of 50%
150 %. The % Assay for paracetamol is 98.85% and etodolac is 99.81 %. Forced Degradation were conducted according to the ICH guidelines and the Drug Product was found to be stable in all conditions. Hence, the method could be successfully applied for routine analysis of Paracetamol and Etodolac in combined dosage form.
This is an open access article distributed under the Creative Commons Att use, distribution, and reproduction in any medium, provided the original work is properly cited.
(4-hydroxyphenyl) 2014). Etodolac is tetrahydropyrano (3,4-b)indole-drugs belong to class of nonsteroidal inflammatory drugs (NSAIDs). A combination of 325mg of Paracetamol and 400 mg of Etodolac is available lly as tablet. This combination is used as analgesic s a NSAID and its IUPAC
3H-pyrano [3,4-b]
the management of mild to moderate pain, fever, and inflammation. It works by reducing the levels of prostaglandins, which are chemicals that are responsible for pain and the fever and tenderness that occur with inflammation. Etodolac blocks the cyclooxygenase enzymes which form prostanoids, resulting in lower
concentrations of prostaglandins. As a consequence,
Sruthi et al., 2013;
Analytically pure sample of paracetamol and etodolac with purities greater than 99% were
Mewar university, Gangrar, Chittorgarh, Rajasthan, India.
obtained as gift samples from Chandra and tablet formulation
etova-pharmacy, Hyderabad, India with labelled amount 500mg each of paracetamol and etodolac. Acetonitrile (HPLC grade) was obtained from Sigma Aldrich (Hyderabad, India), Water (HPLC grade), 0.45μm Nylon membrane filters were obtained from Spincotech private limited, Hyderabad, India.
Instrument
HPLC analysis was performed on Shimadzu LC Prominence Liquid Chromatography
pump, Shimadzu SPD-20A Prominence UV
Enable C18G reverse phase C18 column (250X4.6 mm, 5 micron particle size). A manually operating Rheodyne injector with 20 μL sample loop was equipped with the HPLC system. The HPLC system was controlled with “Lab solutions lite” software. In addition, an electronic analytical weighing balance (0.1mg sensitivity, Shimadzu AY 220), digital pH meter (DELUX model 101), a sonicator (sonica, model 2200 MH) and UV-Visible Spectrophotometer
series, software-UV probe version 2.42) were used in this study.
Selection of wavelength
Initially method development work was started by taking UV visible spectra from 400-200 nm of paracetamol and etodolac
International Journal of Current Research Vol. 9, Issue, 08, pp.56385-56390, August, 2017
R. and Ashok Kumar, A., 2017. “Stability indicating analytical method development and validation for the simultaneous
HPLC method in both bulk and pharmaceutical dosage form”, International Jo
STABILITY INDICATING ANALYTICAL METHOD DEVELOPMENT AND VALIDATION FOR THE
SIMULTANEOUS ESTIMATION OF PARACETAMOL AND ETODOLAC USING RP-HPLC
METHOD IN BOTH BULK AND PHARMACEUTICAL DOSAGE FORM
, Gangrar, Chittorgarh, Rajasthan, India
HPLC method had been developed for the estimation of Paracetamol and Etodolac in tablet dosage form, using Inertsil ODS C18 (250 x 4.6 mm, 5m.), mobile phase Acetonitrile and water (60:40), detection wavelength at 269 nm, at flow rate of 1ml/min at retention time 3.206 min for paracetamol, 4.825 min for etodolac. Linearity was obtained in the range of 18.46 l and etodolac. The correlation coefficient was found to be 0.999 for the drugs. The Recovery studies were performed for paracetamol and etodolac in the range of 50% 150 %. The % Assay for paracetamol is 98.85% and etodolac is 99.81 %. Forced Degradation studies were conducted according to the ICH guidelines and the Drug Product was found to be stable in all conditions. Hence, the method could be successfully applied for routine analysis of Paracetamol and
is an open access article distributed under the Creative Commons Attribution License, which permits
obtained as gift samples from Chandra labs (Hyderabad, India) -p was procured from Apollo pharmacy, Hyderabad, India with labelled amount 500mg each of paracetamol and etodolac. Acetonitrile (HPLC grade) was obtained from Sigma Aldrich (Hyderabad, India), Water PLC grade), 0.45μm Nylon membrane filters were obtained from Spincotech private limited, Hyderabad, India.
HPLC analysis was performed on Shimadzu LC-20AD Chromatography comprising a LC-20AD 20A Prominence UV-Vis detector and Enable C18G reverse phase C18 column (250X4.6 mm, 5 micron particle size). A manually operating Rheodyne injector with 20 μL sample loop was equipped with the HPLC system. system was controlled with “Lab solutions lite” software. In addition, an electronic analytical weighing balance (0.1mg sensitivity, Shimadzu AY 220), digital pH meter (DELUX model 101), a sonicator (sonica, model 2200 MH) Visible Spectrophotometer (Shimadzu UV-1800 UV probe version 2.42) were used in this
Initially method development work was started by taking UV-200 nm of paracetamol and etodolac
INTERNATIONAL JOURNAL OF CURRENT RESEARCH
Stability indicating analytical method development and validation for the simultaneous
standard solutions. By observing the spectra of standard solutions λmax 269 nm was chosen as the desired wavelength. The spectrum was shown in Figure No: 5.
Figure 1. Structure of Paracetamol
Figure 2. Structure of Etodolac
[image:2.595.38.291.647.763.2]Figure 3. UV spectrum of Paracetamol
Figure 4. UV spectrum of Etodolac
Figure 5. Overlapped UV spectrum of Paracetamol and Etodolac
Chromatographic conditions
The separation of the drugs was achieved on a C18 column reverse phase (4.6 mm X 250 mm, 5 micron particle size). The mobile phase consists of a mixture of Acetonitrile and water as the mobile phase in the ratio 60:40 at a flow rate of 1 ml/minute and the volume injected was 20 μl for every injection .the detection wavelength was set at 269 nm.
Mobile Phase
Prepared a degassed and filtered mixture of Acetonitrile and water were taken in the ratio 60:40 v/v.Peaks of paracetamol and etodolac were well resolved with the solvent system of Acetonitrile:water in the ratio of 60:40 v/v.
Preparation of Stock and Working Standard Solution
10mg of Paracetamol and Etodolacwere accurately weighed and taken in 100ml clean and dry volumetric flask containing 80ml of solvent (mobile phase )and then the solution was made up to the mark using the solvent. This is considered as standard stock solution (100µg/ml). 3.7ml of the stock solution was pipetted out and made up to 10 ml to get a concentration 36.92μg/ml, treated as working standard, 100% target concentration for which UV spectrum was recorded (Figure 5).
Preparation of Stock and Working Sample Solution
Take average weight of one tablet and crush in a mortar by using pestle and weight 99.8 mg equivalent weight ofetova-p sample into a 100ml clean dry volumetric flask and add about 80ml of Diluent and sonicate to dissolve it completely and make volume up to the mark with the same solvent. Further pipette 1ml of above stock solution into a 10ml volumetric flask and dilute up to the mark with diluent (stock 2) from this stock-2 pipette out 3.7 ml into 10 ml clean dry volumetric flask and add diluent upto the mark to get target concentration of 36.92µg/ml of concentration.
RESULTS AND DISCUSSION
Method Development
RP-HPLC isocratic stability indicating assay method was developed keeping in mind the system suitability parameters i.e. Asymmetric factor (A),number of theoretical plates (N), runtime, separation of drug peak from the forced degradants, detection of drug peak along with significant impurities and majority of impurities. In order to test the applicability of the developed method to a commercial formulation, etova-p was chromatographed at working concentration (36.92μg/ml) and it
is shown in Figure 8. The samplepeak was identified by
Fig. 6. Typical chromatogram of the blank
Fig. 7. Typical chromatogram of the standard
Fig. 8. Typical chromatogram of the control formulation
Method Validation
Validation of the analytical method is the process that establishes by laboratory studies in which the performance characteristics of the method meet the requirements for the intended analytical application. RP-HPLC method developed was validated according to International Conference on Harmonization (ICH) guidelines for validation of analytical procedures. The method was validated for the parameters like system suitability, specificity, linearity, accuracy, precision, and sensitivity.
Specificity
Blank, standard drug solution and sample chromatogram revealed that the peaks obtained in the standard solution and sample solution at working concentrations are only because of the drug as blank had no peak at the retention time of paracetamol and etodolac. Accordingly it can be concluded that, the method developed is said to be specific.
Precision
System Precision
Six replicate injections of the standard solution at working concentration showed % RSD (Relative Standard Deviation) less than 2 concerning peak area for the drug, which indicates
the acceptable reproducibility and thereby the precision of the system. System precision results are tabulated in Table 1.
Method Precision
Method precision was determined by performing assay of sample under the tests of repeatability at working concentration.
Repeatability (Intraday precision)
[image:3.595.39.280.53.176.2]Six consecutive injections of the sample from the same homogeneous mixture at working concentration showed % RSD less than 2 concerning % assay for the drug which indicate that the method developed is method precise by the test of repeatability and hence can be understood that the method gives consistently reproducible results (Table 2).
Table 1. System Precision Results
Paracetamol Etodolac
S.No. Rt Area Rt Area
1 3.197 360763 4.813 429725
2 3.198 357025 4.816 429021
3 3.203 361028 4.820 425498.000
4 3.199 359175 4.814 427583.000
5 3.192 356969 4.806 425614
6 3.191 352818 4.807 414863.000
avg 3.1967 357963 4.813 425384.000
stdev 0.0045 3067.314 0.005 4960.930
[image:3.595.339.526.277.387.2]%RSD 0.14 0.86 0.11 1.17
Table 2. Intraday Precision Results
PARACETAMOL ETODOLAC
S.No. Rt Area Rt Area
1 3.627 2646.619 5.047 2433.63
2 3.623 2647.154 5.040 2421.25
3 3.630 2647.393 5.047 2427.526
4 3.630 2653.772 5.043 2433.302
5 3.623 2658.543 5.033 2437.33
6 3.630 2657.198 5.043 2428.506
avg 3.6272 2651.780 5.042 2430.256
stdev 0.0034 5.410 0.005 5.699
%RSD 0.09 0.20 0.10 0.23
Intermediate Precision (Ruggedness / Inter day precision)
[image:3.595.345.521.417.525.2]The sample solution from the same homogeneous mixture at working concentration on a different day by a different analyst, showed % RSD less than 2 for % assay for the drug within and between days, which indicate the method developed is inter day precise / rugged (Table 3).
Table 3. Intermediate Precision
analyst 1
Paracetamol etodolac Result
1 Standard 1102591 1017647 paracetamol 98.34735
2 Sample 1084369 1014451 etodolac 99.68594
analyst 2
Paracetamol etodolac Result
1 Standard 1122641 1018626 paracetamol 100.881
2 Sample 1132532 1019236 etodolac 100.0599
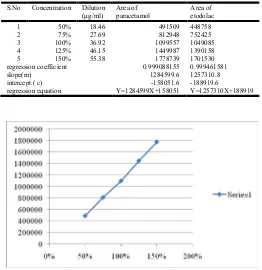
Linearity
[image:3.595.313.551.658.739.2]prepared. Calibration curve was constructed by plotting the concentration level of drug versus corresponding peak area. The results show an excellent linear correlation between peak area and concentration level of drug within the concentration range (18.46-55.38μg/ml) for the drug and the results are given
in Table 4 and Figure 9 & 10. The correlation coefficient of
[image:4.595.305.563.72.180.2]paracetamol is 0.999andetodolac is 0.999. Thus hence the method is said to be linear in the range of 18.46-55.38 μg/ml.
Table 4.
S.No Concentration Dilution (μg/ml)
Area of paracetamol
Area of etodolac
1 50% 18.46 491509 448758
2 75% 27.69 812948 752425
3 100% 36.92 1099557 1049085
4 125% 46.15 1449987 1390158
5 150% 55.38 1778739 1701530
regression coefficient 0.999088155 0.999461581
slope(m) 1284599.6 1257310.8
intercept ( c) -158051.6 -188919.6
regression equation Y=1284599X+158051 Y=1257310X+188919
Fig. 9. Linearity Graph of PARACETAMOL
Fig. 10. Linearity Graph of ETODOLAC
Accuracy
Accuracy was determined by means of recovery experiments, by the determination of % mean recovery of sample at three different levels (50-150%). At each level, three determinations were performed. Percent mean recovery was calculated as
shown in Table 5 & 6. The accepted limits of recovery are
90%-110% for the process of determining recovery of the standard from the formulation at three different levels of 50%, 100% and 150%. All observed data are within the required range which indicates good recovery values and hence the accuracy of the method developed.
Table 5. Recovery Studies Results of Paracetamol
ACCURACY OF PARACETAMOL
S.No %LEVEL Sample area % of recovery % of mean recovery
1 50%-01 1096527 96.63176318
100.3335249
2 50%-02 1186427 104.554227
3 50%-03 1132644 99.81458438
1 100%-01 1294267 102.6518928
98.86811874
2 100%-02 1243207 98.60218304
3 100%-03 1202206 95.35028041
1 150%-01 1496458 105.5006398
101.3352979
2 150%-02 1407342 99.2179409
[image:4.595.32.294.174.444.2]3 150%-03 1408326 99.28731313
Table 6. Recovery Studies Results of Etodolac
ACCURACY OF ETODOLAC
S.no % level Sample area % recovery % Of mean recovery
1 50%-01 156550 73.60408478 102.83
2 50%-02 158072 74.31967352
3 50%-03 157527 74.06343445
1 100%-01 421600 99.11045079
99.36
2 100%-02 423321 99.51502642
3 100%-03 420470 98.84480846
1 150%-01 672567 94.86492205
99.103
2 150%-02 671439 94.70581874
3 150%-03 673068 94.93558761
Sensitivity
The sensitivity of measurement of PARACETAMOL and ETODOLAC by use of the proposed method was estimated in terms of the limit of quantitation (LOQ) and the limit of detection (LOD). LOQ and LOD were calculated by the use of
the equations LOD = 3.3/S and LOQ = 10/S where is the
standard deviation of response of calibration plot and S is the slope of the corresponding calibration plot. The limit of detection (LOD) and limit of quantification (LOQ) was found to be 0.001924ng/mland0.00583ng/ml respectively for PARACETAMOL and 0.001109ng/ml and 0.003361ng/ml for ETODOLAC respectively.
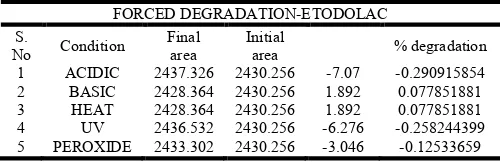
FORCED DEGRADATION STUDIES
SAMPLE PREPARATIONS TO PERFORM FORCED DEGRADATION STUDIES
Acid degradation
Take tablet powder and crush in a mortar by using pestle and weigh one tenth equivalent weight of (99.8 mg) etova-p sample into a 100mL clean dry volumetric flask and add about 3mL of 0.5N HCl and kept a side for 3hours and add 3mL of 0.5N NaOH solution to neutralize the solution and make the volume up to mark by using Diluent and sonicate to dissolve it completely. Further pipette 1ml of above stock solution into a 10ml volumetric flask and dilute up to the mark with diluent from this again pipette out 3.7 ml into 10 ml volumetric flask having diluent make up to the mark with the diluent and degassed in a digital ultrasonicator for 10 minutes.
Alkaline degradation
[image:4.595.307.560.208.318.2]Further pipette 1ml of above stock solution into a 10ml volumetric flask and dilute up to the mark with diluent from this again pipette out 3.7 ml into 10 ml volumetric flask having diluent make up to the mark with the diluent and degassed in a digital ultrasonicator for 10 minutes.
Peroxide degradation
Take tablet powder and crush in a mortar by using pestle and weigh 99.8 mg equivalent weight of etova-p sample into a 100mL clean dry volumetric flask and add about 10mL of 3% Hydrogen peroxide solution and kept a side for 3hours and make the volume up to mark by using Diluent and sonicate to dissolve it completely. Further pipette 1ml of above stock solution into a 10ml volumetric flask and dilute up to the mark with diluent from this again pipette out 3.7 ml into 10 ml volumetric flask having diluent make up to the mark with the diluent and degassed in a digital ultrasonicator for 10 minutes.
Thermal degradation
Take tablet powder and crush in a mortar by using pestle and weight 99.8 mg equivalent weight of etova-psample into a 100mL clean dry volumetric flask and expose to heat at 70ºc for 3hours and make the volume up to mark by using Diluent and sonicate to dissolve it completely. Further pipette 1ml of above stock solution into a 10ml volumetric flask and dilute up to the mark with diluent from this again pipette out 3.7 ml into 10 ml volumetric flask having diluent make up to the mark with the diluent and degassed in a digital ultrasonicator for 10 minutes
Photolytic degradation
[image:5.595.310.556.48.179.2]Take tablet powder crush in a mortar by using pestle and weight 99.8 mg equivalent weight of etova-psample into a 100mL clean dry volumetric flask and expose to ultraviolet rays for 3hours and make the volume up to mark by using Diluent and sonicate to dissolve it completely. Further pipette 1ml of above stock solution into a 10ml volumetric flask and dilute up to the mark with diluent from this again pipette out 3.7 ml into 10 ml volumetric flask having diluent make up to the mark with the diluent and degassed in a digital ultrasonicator for 10 minutes
Table 6. Results for degradation studies of Paracetamol
S.
No Condition
Final
area Initial area %degradation
1 ACIDIC 2658.543 2651.779833 -6.76317 -0.255042541
2 BASIC 2648.553 2651.779833 3.226833 0.121685567
3 HEAT 2648.553 2651.779833 3.226833 0.121685567
4 UV 2660.236 2651.779833 -8.45617 -0.318886454
[image:5.595.314.553.200.324.2]5 PEROXIDE 2653.772 2651.779833 -1.99217 -0.075125644
Table 7. Results for degradation studies of Etodolac
FORCED DEGRADATION-ETODOLAC S.
No Condition
Final area
Initial
area % degradation
1 ACIDIC 2437.326 2430.256 -7.07 -0.290915854
2 BASIC 2428.364 2430.256 1.892 0.077851881
3 HEAT 2428.364 2430.256 1.892 0.077851881
4 UV 2436.532 2430.256 -6.276 -0.258244399
[image:5.595.313.551.354.475.2]5 PEROXIDE 2433.302 2430.256 -3.046 -0.12533659
[image:5.595.309.553.502.625.2]Figure 11.Chromatogram showing acidic degradation.
Figure 12. Chromatogram showing basic degradation.
Figure 13. Chromatogram showing peroxide degradation.
Figure 14. Chromatogram showing sunlight degradation.
[image:5.595.30.293.594.665.2] [image:5.595.309.553.651.773.2] [image:5.595.37.287.694.775.2]Conclusion
A reverse phase HPLC isocratic stability indicating assay method has been developed and validated as per ICH guidelines for the quantitative estimation of PARACETAMOL and ETODOLAC in etova-p tablets. Forced degradants were separated from the drug peak using the optimized method. Intraday is exemplified by relative standard deviation of 0.2% &0.23%. A good linear relationship was observed for the drug between concentration ranges of 18.46 and 55.38 μg/ml. Accuracy studies revealed that mean recoveries were between 90 and 110%, an indicative of accurate method. The limit of detection (LOD) and limit of quantification (LOQ) was found
to be 0.001924ng/mland0.00583ng/ml respectively for
PARACETAMOL and 0.001109ng/ml and 0.003361ng/ml for ETODOLAC respectively. Accordingly it can be concluded that the developed reverse phase isocratic HPLC stability indicating assay method is sensitive, accurate, precise and linear and therefore the method can be used for the routine analysis.
REFERENCES
Balan, P., CarolinNimila, I., Lakshmi Prasanna, M., Vanaja Rani, M., Rajasekar, S. 2011. Simultaneous estimation of Etodolac and Paracetamol by UV spectrophotometric
method in tablet formulation. Journal of Pharmacy
Research, 4(6):1663-1665.
International Conference on Harmonization of technical requirements for registration of pharmaceuticals for human use. Validation of Analytical Procedures: Text and Methodology ICH Q2 (R1). 2005.
Jadavalpa, V., GohelBhavika, A., SondagarMital, M., Patel Bhavna, A., Parmar Shraddha, J. 2013. Method development and validation for the simultaneous estimation of Paracetamol and Etodolac by Derivative UV
spectroscopic method. International Journal of Pharm
Tech Research, 5(3):1155- 1160.
Kallur, H.J., Prabhudev, S.M., Bagal, V.A., Kishore Singh, C.
2013. Simultaneous estimation of Etodolac and
Paracetamol in bulk drug dosage form by RP-HPLC.
International Journal of Advances in Pharmaceutical Analysis, 3(3):56-67.
Mithlesh, R., Hinna, H, Manjeet, A., Rakesh Kumar, K. 2015. Development and validation of a stability indicating
Reverse Phase HPLC Method for simultaneous
determination of Etodolac and Paracetamol in its tablet
dosage formulation. International Journal of Innovative
Research in Science, Engineering and Technology,
4(1):19075-19081.
Shailaja, B., Afreen, M., Vinay Kumar, T., Ashok Kumar, A. 2015. UV assay method development and validation for simultaneous estimation of Etodolac and Paracetamol in
tablets by simultaneous equation method. Indo Am J Pharm
Sci., 2 (11), 1468-1473.
Siva Rama Krishna, V., Sateesh, B., Ravi, N.T. 2014. RP- HPLC method development and validation of Etodolac and
Paracetamol in tablet dosage form. International Journal of
Pharm Tech Research, 6(2):775-782.
Sruthi, A., Thanuja, N., Saisamhita, M., Sudheerkumar, D., Sreekanth, G. 2013. A simple RP-HPLC method for simultaneous estimation of Paracetamol and Etodolac in tablet dosage form Indo American Journal of Pharm Research, 3(5):3742-3751.