COMPARISION OF TWO HPLC METHODS FOR DETERMINATION OF HIGHER
MOLECULAR WEIGHT PROTEIN IN INSULIN GLARGINE
*Rashmi Rawat,
S.S.M.V.
ARTICLE INFO ABSTRACT
The current British Pharmacopoeia requirements, quality testing of Insulin glargine identification, related proteins, HMWP and assay by HPLC methods. RP
identification, related proteins and assay while SE HMWP. Current BP 2015 method on determination of HPLC colum
test on Human insulin using single HPLC column with run time of about 35 minutes. As the molecular weights and amino acid sequence of Insulin glargine and Human insulin are
expect that the two molecules should have similar chromatographic profile when tested for their HMWP content. Th
Insulin glargine by the methods described in t
Copyright © 2016, Rashmi Rawat et al. This is an open access article distributed under the Creative Commons Att use, distribution, and reproduction in any medium, provided the original work is properly cited.
INTRODUCTION
The advent of recombinant DNA (rDNA) technology and its application in the pharmaceutical industry has brought about a rapid growth of biotechnology companies and a number of therapeutic rDNA products are available for human use. Currently, several categories of rDNA products, viz. Hormones of therapeutic interest, Haemopoietic Growth Factors, Blood Coagulation Products, Thrombolytic Agents, Anticoagulants, Interferons, Interleukins and Therapeutic Enzymes are being produced using rDNA technology. Human insulin produced by rDNA technology is the first commercial health care product derived from rDNA technology. Insulin, containing 51 amino acids and molecular weight of 5.8 kDa, is a small polypeptide hormone that regulates blood glucose homeostasis. Patients with insulin-dependent diabetes mellitus require insulin therapy through the administration of exogenous insulin. A weakened form of Escherichia coli is used as a vector for the synthesis of recombinant human insulin. The protein is produced in the bacterial cell as two chains A and B. The chains are mixed and reconnected in a reaction that forms the disulfide cross-bridges, resulting in pure recombinant human insulin. Several methods have been reported for the determination of insulin in the pharmaceuticals and plasma including Voltametric, Spectroscopic, Electrochemical and Chromatographic Methods (Khaksa et al., 1998).
*Corresponding author: Rashmi Rawat,
S.S.M.V. (PG) College, Shikarpur, Bulandshahr, India
ISSN: 0975-833X
Vol.
Article History:
Received 15th August, 2016
Received in revised form
22nd September, 2016
Accepted 11th October, 2016
Published online 30th November,2016
Key words:
Protein, Insulin Glargine, HPLC.
Citation: Rashmi Rawat, Kushmander Singh and Neeraj Kumar
weight protein in insulin glargine”, International Journal of Current Research
RESEARCH ARTICLE
COMPARISION OF TWO HPLC METHODS FOR DETERMINATION OF HIGHER
MOLECULAR WEIGHT PROTEIN IN INSULIN GLARGINE
Rashmi Rawat, Kushmander Singh and Neeraj Kumar
(PG) College, Shikarpur, Bulandshahr, India
ABSTRACT
The current British Pharmacopoeia requirements, quality testing of Insulin glargine identification, related proteins, HMWP and assay by HPLC methods. RP
identification, related proteins and assay while SE-HPLC is the method of choice for determination of HMWP. Current BP 2015 method on determination of HMWP of the Insulin glargine employs two HPLC columns in series with run time of about 65 minutes. However, IP 2014 describes the HMWP test on Human insulin using single HPLC column with run time of about 35 minutes. As the molecular weights and amino acid sequence of Insulin glargine and Human insulin are
expect that the two molecules should have similar chromatographic profile when tested for their HMWP content. Therefore, it would be interesting to investigate the results of test on HMWP of Insulin glargine by the methods described in two pharmacopoeias i.e. BP 2015 and IP 2014.
is an open access article distributed under the Creative Commons Attribution License, which use, distribution, and reproduction in any medium, provided the original work is properly cited.
) technology and its application in the pharmaceutical industry has brought about a rapid growth of biotechnology companies and a number of therapeutic rDNA products are available for human use. Currently, several categories of rDNA products, viz. Hormones of therapeutic interest, Haemopoietic Growth Factors, Blood Coagulation Products, Thrombolytic Agents, Anticoagulants, Interferons, Interleukins and Therapeutic Enzymes are being produced using rDNA technology. Human insulin produced by the first commercial health care product Insulin, containing 51 amino acids and molecular weight of 5.8 kDa, is a small polypeptide hormone that regulates blood glucose homeostasis. Patients llitus require insulin therapy through the administration of exogenous insulin. A is used as a vector for the synthesis of recombinant human insulin. The protein is produced in the bacterial cell as two chains A and B. The two chains are mixed and reconnected in a reaction that forms the bridges, resulting in pure recombinant human Several methods have been reported for the determination of insulin in the pharmaceuticals and plasma tric, Spectroscopic, Electrochemical and
1998).
S.S.M.V. (PG) College, Shikarpur, Bulandshahr, India.
Reverse Phase-HPLC (RP-HPLC) is probably the most used analytical method for separation and
and proteins in an extensive range of applications (Aguilar, 2004). Analytical methods for various types of insulin insulin analogues are gradually being included in the Indian Pharmacopoeia (IP), United States Pharmacopeia (USP), British Pharmacopoeia (BP) and European Pharmacopeia (EP). Usually these insulin analogues only differ by 1 to 3 amino acids, which is too subtle to distinguish by mo
methods currently available.
MATERIALS AND METHODS
Method 1. Determination of HMWP as per BP 2015 Method
Preparation of Mobile Phase
200 ml of glacial acetic acid, 300 ml of acetonitrile 400 ml of HPLC grade water was taken in 1000 ml bottle and mixed properly.
pH of the solution was adjusted to 3.0 with ammonia solution. Volume was made up to 1000 ml with water. Solution was filtered through a 0.45 µm membrane
filter and degased for 15 min in sonicator before using in HPLC.
International Journal of Current Research
Vol. 8, Issue, 11, pp.41538-41543, November, 2016
INTERNATIONAL
Rashmi Rawat, Kushmander Singh and Neeraj Kumar, 2016. “Comparision of two HPLC methods for determination of higher molecular
International Journal of Current Research, 8, (11), 41538-41543.
COMPARISION OF TWO HPLC METHODS FOR DETERMINATION OF HIGHER
MOLECULAR WEIGHT PROTEIN IN INSULIN GLARGINE
Kushmander Singh and Neeraj Kumar
The current British Pharmacopoeia requirements, quality testing of Insulin glargine involves identification, related proteins, HMWP and assay by HPLC methods. RP-HPLC is used for tests on HPLC is the method of choice for determination of HMWP of the Insulin glargine employs two s in series with run time of about 65 minutes. However, IP 2014 describes the HMWP test on Human insulin using single HPLC column with run time of about 35 minutes. As the molecular weights and amino acid sequence of Insulin glargine and Human insulin are very close, we may expect that the two molecules should have similar chromatographic profile when tested for their refore, it would be interesting to investigate the results of test on HMWP of
wo pharmacopoeias i.e. BP 2015 and IP 2014.
ribution License, which permits unrestricted
HPLC) is probably the most used analytical method for separation and determination of peptides and proteins in an extensive range of applications (Aguilar, 2004). Analytical methods for various types of insulin and dually being included in the Indian Pharmacopoeia (IP), United States Pharmacopeia (USP), British Pharmacopoeia (BP) and European Pharmacopeia (EP). Usually these insulin analogues only differ by 1 to 3 amino acids, which is too subtle to distinguish by most of analytical
MATERIALS AND METHODS
Determination of HMWP as per BP 2015 Method
200 ml of glacial acetic acid, 300 ml of acetonitrile and 400 ml of HPLC grade water was taken in 1000 ml bottle and mixed properly.
pH of the solution was adjusted to 3.0 with ammonia solution. Volume was made up to 1000 ml with water. Solution was filtered through a 0.45 µm membrane
15 min in sonicator before using
INTERNATIONAL JOURNAL OF CURRENT RESEARCH
Preparation of Reference Solution (a)
Approximately 200 mg of Insulin glargine drug substance was weighed in a glass vial.
Insulin glargine powder was allowed to dry in an oven at 100°C for 1.5 - 3 hrs.
15 mg of dry Insulin glargine powder was weighed and dissolved in approximately 1.5 ml of 0.01N HCl and diluted to 10 ml with water.
Preparation of Reference Solution (b)
1 volume of Reference solution (a) was diluted to 100 volumes with water.
Again 3 volumes of this solution were diluted to 20 volumes with water.
Preparation of Test Solution
15 mg of Insulin glargine drug substance was dissolved in 1.5 mL of 0.01N HCl solution and diluted to 10 ml with HPLC grade water.
Solution was filtered through 0.22 µm syringe filter and transferred to HPLC vial for injection in HPLC.
Test Validity
Test is not valid unless:
Tailing factor is maximum 2.0 for Insulin glargine peak in Reference solution (a)
Peak to valley ratio is minimum 2; where Hp = height above the baseline of the peak due to high molecular mass proteins and Hv = height above the baseline of the lowest point of the curve separating this peak from the peak due to insulin glargine in the glargine in the chromatogram obtained with reference solution (a)
Method 2. Determination of HMWP as per IP 2014 Method
Preparation of Mobile Phase
1.0 gm of L-arginine powder was weighed and dissolved in 1 lt. HPLC grade water (18.2MΩ).
650 ml of above solution, 200 ml of acetonitrile, and 150 ml of glacial acetic acid were mixed in a 1 lt. bottle. Solution was filtered through a 0.45 µm membrane filter and degased for 15 min in sonicator before using in HPLC.
Preparation of Reference Solution (a)
Approximately 200 mg of Insulin glargine drug substance was weighed in a glass vial.
Insulin glargine powder was allowed to dry in an oven at 100°C for 1.5 - 3 hrs.
15 mg of dry Insulin glargine powder was weighed and dissolved in approximately 1.5 ml of 0.01N HCl and diluted to 10 ml with water.
Preparation of Reference Solution (b)
1 volume of Reference solution (a) was diluted to 100 volumes with water.
Again 3 volumes of this solution were diluted to 20 volumes with water.
Preparation of Test Solution
15 mg of Insulin glargine drug substance was dissolved in 1.5 mL of 0.01N HCl solution and diluted to 10 ml with HPLC grade water.
Solution was filtered through 0.22 µm syringe filter and transferred to HPLC vial for injection in HPLC.
Test Validity
Test is not valid unless peak to valley ratio is minimum 2; where Hp = height above the baseline of the peak due to dimer and Hv = height above the baseline of the valley separating dimer and monomer peaks in the chromatogram obtained with reference solution (a)
RESULTS AND DISCUSSION
Present study was planned with the focus to evaluate the HMWP in Insulin glargine under the conditions provided by the BP 2015 (method 1) and IP 2014 (method 2). Results of the study are summarized and discussed below.
Retention Time Variation
Figure 1. Chromatogram of Reference solution (a) with method 1
Figure 2. Expanded view of chromatogram of Reference solution (a) with method 1
[image:3.595.78.524.541.765.2]Figure 4. Expanded view of chromatogram of Reference solution (a) with method 2
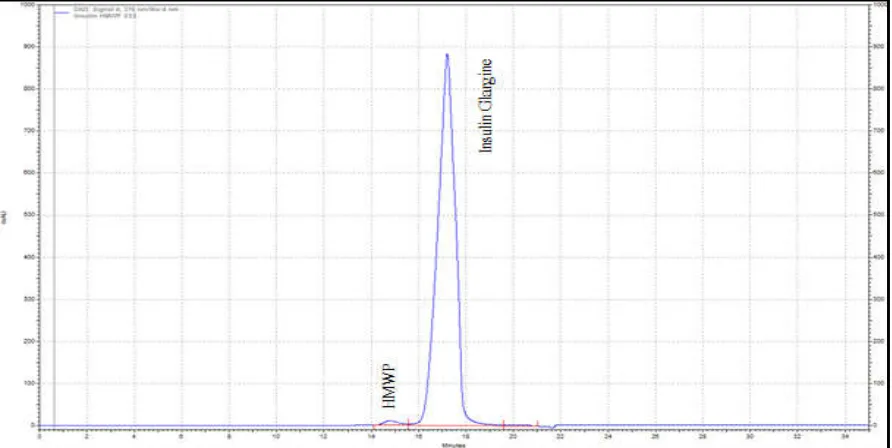
Figure 5. Chromatogram of Insulin glargine DS with method 1
[image:4.595.77.521.554.768.2]Results obtained in the present study show that when IP method on HMWP is applied to Insulin glargine samples, retention time of the Insulin glargine monomer peak is as per the IP requirements. Average retention time of Insulin glargine HMWP peak was observed to be 14.07 min. ±0.64 min for method 2. Representative chromatogram of the Reference solution (a) as per method 2 is shown in figure 3 and 4. The variation observed in the retention time of the principal peak in two methods is attributed to the column length. BP method employs two columns (300 mm each in length) in series making total column length to be equivalent to 600 mm. Depending on the method requirements, column length can be chosen to either provide improved resolution or higher sample throughput. For a registered quality test a longer column provides improved resolution that can result in better quantitative reliability. While in discovery, development or during real-time process monitoring, a shorter column allows for faster analysis time and higher sample throughput.
Tailing Factor
One of the important parameter of the HPLC analysis is the estimation of tailing factor of the peak. In the present study,
average tailing factor of the principal peak in Reference solution (a) was estimated to be 0.80 and 0.82 for method 1 and 2 respectively. BP 2015 mentions that for the validity of the test for HMWP, the tailing factor of the main peak should be not more than 2. In this respect, results of both method 1 and 2 complies with the pharmacopoeial requirements. Also, these results indicate that the two methods are comparable for the peak symmetry without any significant difference.
Resolution Variation
[image:5.595.77.524.74.271.2]Chromatographic principles predict that resolution is proportional to the column length and that is what was observed in the present study. Average resolution between HMWP and Insulin glargine monomer peak was 2.61 and 2.11 for Method 1 and 2 respectively. Improved resolution in method 1 is also attributed to the use of two HPLC columns in series as compared to use of single column in method 2. Hence, the increase in column length results in better resolution between HMWP and monomer peaks. However, it is important to note that the improved resolution in method 1 is accompanied by approximately two-fold increase in analysis
Figure 7. Chromatogram of Insulin glargine DS with method 2
[image:5.595.78.525.302.508.2]time and mobile phase use. Also, resolution is not a pharmacopoeial requirement for the test on HMWP.
Intra-assay and Inter-assay Variation in HMWP Content
In the present study, intra-assay variation in the determination of HMWP content was assessed by taking into consideration the data on %peak area of the HMWP peak obtained with Reference solution (a). For the calculation of intra-assay variation, Reference solution (a) was injected three times and %RSD of the HMWP content were calculated. Results show that for method 1 and 2, the intra-assay variation was 0.50% and 0.55% respectively. These results indicate that both BP and IP methods are highly precise for intra-assay variation and comparable without any significant difference. As in the case of intra-assay variation, inter-assay variation was also assessed by taking into consideration the data on %area of the HMWP peak obtained with Reference solution (a). Mean %peak area of the HMWP in Reference solution (a) obtained from three independent experiments was used for the calculation of inter-assay variation. Results of the present study show that for method 1 and 2, the inter-assay variation was 16.25% and 7.42% respectively. These results indicate that IP method is more precise in terms of inter-assay variation.
Comparing HMWP Content of Two Methods
Two methods were also compared with each other to evaluate the content of HMWP in Insulin glargine. Present study show that estimated HMWP content was 1.32% and 1.15% when tested by method 1 and 2 respectively. These results indicate that the two methods do not show any major difference in estimating HMWP content in Insulin glargine. An impurity in a drug substance or a drug product as defined by the International Conference on Harmonization (ICH) Guidelines is any component present in the drug substance or drug product which is not the desired product, a product-related substance, or excipient including buffer components. It may be either process-related or product-related. Therefore any extraneous material present in the drug substance has to be considered an impurity even if it is totally inert or has superior pharmacological properties. Related substances include
degradation products, synthetic impurities of drug substance, and manufacturing process impurities from the drug product (Chan et al., 2004).
The impurity profile of pharmaceuticals is of increasing importance as drug safety receives more and more attention from the public and from the approving authorities. Impurities could be forming from the impact of heat, light, acids, bases and oxidants (including air) on the drug product and might be catalyzed or accelerated by trace metal impurities, changes in the pH of the formulation, interactions with packaging components, excipients and other active ingredients, in the case of combination products. Therefore, identification, quantification, and control of impurities in the drug substance and drug product, according to ICH Guidelines are an important part of drug development and regulatory assessment. Overall, the results of this study indicate that the results obtained as per the requirements of BP 2015 does not offer any advantage over the results obtained as per IP 2014 for the determination of HMWP in Insulin glargine. Moreover, BP method is time consuming and gives final results in approximately 65 minutes. The longer run time also results in increase in the mobile phase consumption and running cost of the test. In view of these results, it is concluded that IP method, which gives results in approximately 35 minutes, may be a method of choice for estimation of HMWP content in Insulin glargine and may replace the BP method.
REFERENCES
Aguilar, M. 2004. HPLC of Peptides and Proteins: Methods and Protocols; Aguilar M, Ed., Humana press: Totowa, 251: 3.
British Pharmacopoeia, 2015.
Chan, C.C., Lee, Y.C., Lam, H. and Zhang, X.M. 2004. Analytical Method Validation and Instrument Performance Verification. Newjersy: A John Wiley & Sons, INC; Publication.
Indian Pharmacopoeia, 2014
Khaksa, G., Nalini, K., Bhat, M., and Udupa, N. 1998. High-performance liquid chromatographic determination of insulin in rat and human plasma. Anal Biochem., 260: 92–95.