ISSN Online: 2161-7198 ISSN Print: 2161-718X
DOI: 10.4236/ojs.2018.85051 Sep. 18, 2018 770 Open Journal of Statistics
A Comparative Analysis of Generalized
Estimating Equations Methods for Incomplete
Longitudinal Ordinal Data with Ignorable
Dropouts
Kago Edwin Ditlhong
1, Oscar Owino Ngesa
2, Abdalla Yusuf Kombo
21Pan African University Institute of Basic Sciences, Technology and Innovation, Nairobi, Kenya 2Department of Mathematics and Informatics, Taita Taveta University, Nairobi, Kenya
Abstract
In longitudinal studies, measurements are taken repeatedly over time on the same experimental unit. These measurements are thus correlated. Missing data are very common in longitudinal studies. A lot of research has been going on ways to appropriately analyze such data set. Generalized Estimating Equations (GEE) is a popular method for the analysis of non-Gaussian longi-tudinal data. In the presence of missing data, GEE requires the strong as-sumption of missing completely at random (MCAR). Multiple Imputation Generalized Estimating Equations (MIGEE), Inverse Probability Weighted Generalized Estimating Equations (IPWGEE) and Double Robust Genera-lized Estimating Equations (DRGEE) have been proposed as elegant ways to ensure validity of the inference under missing at random (MAR). In this study, the three extensions of GEE are compared under various dropout rates and sample sizes through simulation studies. Under MAR and MCAR me-chanism, the simulation results revealed better performance of DRGEE com-pared to IPWGEE and MIGEE. The optimum method was applied to real da-ta set.
Keywords
Longitudinal Ordinal Data, MAR, MCAR, Multiple Imputation GEE, Inverse Probability Weighted GEE, Double Robust GEE
1. Introduction
In the medical, epidemiological and social sciences, studies are often designed to
How to cite this paper: Ditlhong, K.E., Ngesa, O.O. and Kombo, A.Y. (2018) A Comparative Analysis of Generalized Esti-mating Equations Methods for Incomplete Longitudinal Ordinal Data with Ignorable Dropouts. Open Journal of Statistics, 8, 770-792.
https://doi.org/10.4236/ojs.2018.85051
Received: July 30, 2018 Accepted: September 15, 2018 Published: September 18, 2018
Copyright © 2018 by authors and Scientific Research Publishing Inc. This work is licensed under the Creative Commons Attribution International License (CC BY 4.0).
DOI: 10.4236/ojs.2018.85051 771 Open Journal of Statistics
investigate changes in the response of interest observed or measured over time on each subject. These are called repeated measures or longitudinal studies. Since the measurements are taken repeatedly over time on the same experimental unit, then the data are typically correlated. Ordinal responses are regularly experienced in these studies. It is exceptionally common for sets of longitudinal studies to be incomplete, in the sense that not all intended measurements of a subject outcome vector are actually observed. This turns the statistical analysis into a missing data problem. When data are incomplete, a number of issues arise in the analysis: 1) the issue of bias due to systematic differences between the observed measurements and unobserved data, 2) loss of efficiency and 3) complications in
data handling and statistical inferences [1].
The issues of missing data are frequently encountered in longitudinal studies in the sense that nonresponse can happen any time from the beginning of the study. Two patterns of missing data can be observed for the response: 1) dropout (monotone pattern of nonresponse), in which an individual terminates the study prematurely from a scheduled sequence of visits for a number of reasons (both known and unknown), or 2) intermittent nonresponse, in which a subject
returns to the study after occasions of nonresponse [2]. The reasons for
missigness are varied and it is fundamental to know the missing data mechanism
generating nonresponse and its impact on inferences. Rubin [3] argued that
there are two important broad classes of missing data: missing data that is ignorable from the analysis, and missing data that is non-ignorable (missing not at random). If missing data occur under either missing completely at random or missing at random conditions, the problem is deemed ignorable, and the missingness process need not be explicitly modelled. A nonresponse process is missing completely at random (MCAR) if the probability of being missing is independent of both unobserved and observed measurements. Data are said to be missing at random (MAR) if, nonresponse is independent of the unobserved quantities given the observed data and missing not at random (MNAR) when the nonresponse depends on unobserved quantities.
A lot of research has been going on ways to appropriately analyze longitudinal studies. When data is incomplete, rather than deleting missing values, it has
been recommended to “impute” them [4]. The subject of how to obtain valid
inferences from imputed data was formally addressed by Rubin [5] who
introduced the multiple imputation (MI) method as an approach to handle missing data. MI has become one of the most popular approaches in handling incomplete data and it is applicable when the data are MAR or MCAR. MI
method replaces each of the unobserved values with m≥2 plausible values to
obtain m completed datasets, whence reflecting the uncertainty about the
missing data. The m completed datasets are then analysed separately using
standard complete data methods and finally, the results from the m analysis are
combined into a single inference.
Alternative solutions of handling longitudinal missing data have been
DOI: 10.4236/ojs.2018.85051 772 Open Journal of Statistics
which is quite popular for the analysis of non-Gaussian correlated data. Its main advantage is that one is only required to specify correctly the mean structure of the response for the parameter estimator to be consistent and asymptotically normal. In the presence of missing data, GEE is only valid under the strong assumption of MCAR. The first effort to make GEE applicable to the more realistic MAR scenario was Multiple Imputation Generalized Estimating
Equations (MIGEE), proposed by Little and Rubin [7]. Here, missing values are
multiply imputed and the resulting completed datasets are analysed through standard GEE methods. Following Rubin’s rule, the final results obtained from
the completed datasets are combined into a single inference. Robins [8]
extended GEE be developing the Inverse Probability Weighted Generalized Estimating Equations (IPWGEE), which consists of weighting each subject’s contribution in the GEE by the inverse probability that a subject drops out at the time they dropped. IPWGEE produces consistent estimates provided the weight model is correctly specified. Double Robust Generalized Estimating Equations (DRGEE) arise as a third generalisation of GEE to deal with data subject to MAR mechanism. The main idea is to supplement the IPWGEE with a predictive
model for the missing quantities conditional on the observed ones [9]. This
method produces consistent estimates provided the dropout or conditional model is correctly specified. Doubly robust methods have widely received
attention in the literature in the last decade (see [10] [11] [12] [13]).
Literature of GEE for missing data for longitudinal ordinal response is
comparatively scarce. In Toledano and Gatsonis [14], the authors used a
weighted GEE method to accommodate intermittent nonresponse of an MCAR missing response and missing covariate that is MAR. In a simulation study,
authors in [15] compared ordinal imputation regression and multivariate
normal imputation for ordinal outcome subject to dropout. A paper from
Kombo [16] compared through a simulation study two multiple imputation
methods (multivariate normal imputation and fully conditional specification) for longitudinal ordinal data with monotone missing data patterns. The aforementioned papers used single robust versions of GEE and they have treated only a missing MAR response or missing MAR covariate. In a paper by da Silva
[13], the authors used DRGEE method for ordinal data with intermittently
missing response and missing covariate. Therefore the use of DRGEE, IPWGEE and MIGEE methods for ordinal data with monotone missing pattern has been in need for further development.
In this paper, our main interest is the comparison of GEE methods in handling incomplete longitudinal ordinal outcomes when missing response is ignorable. This assumes the missing data are either MCAR or MAR. Comparisons are made by means of simulation study and the optimum model is applied to a real dataset. Through simulation study, the behavior of the methods in terms of mean squared error (MSE) and bias of the estimators are extensively studied, under correctly specified models.
DOI: 10.4236/ojs.2018.85051 773 Open Journal of Statistics
definitions. Section 3 outlines the GEE, as well as IPWGEE, MIGEE and DRGEE approaches. A simulation study is presented in Section 4 followed by a simulation results and application in Section 5. Finally, discussion and concluding remarks are provided in Section 6.
2. Definitions and Notation
2.1. Ordinal Outcomes
Categorical variables occur frequently in many studies including but not limited to economic, health, education fields. In cases where the variables is categorical with only two levels, logistic regression take stage. However, in cases where there are more than two categories and the categories are ordered then polytomous ordinal regression come into play.
Ordinal outcomes are regularly experienced in longitudinal studies, particularly in randomized clinical trials. Apart from failing to meet the usual normality assumption for analysis and inference, these data are prone to missingness. Failure to deal with incomplete information jeopardizes the validity
of inferences. Various authors [17] [18] [19] have studied a number of logistic
regression models for ordinal responses variables. When considering several
factors, special multivariate analysis for ordinal data is the best option [20], even
though other methods like mixed models can be employed. Nevertheless, ordinal logistic regression models have been found to be most useful when dealing with
ordinal data [19]. There are several ordinal logistic regression models namely;
the proportional odds model, continuous ratio model, partial proportional odds model and the stereotype regression model. Among the aforementioned ordinal logistic regression models, the most common is the proportional odds model
[21]. The proportional odds model is a logit model that allows ordered data to be
modelled by analysing it as a number of dichotomies [16]. It compares a number
of dichotomies by arranging the ordered categories into a series of binary comparisons. The proportional odds assumption states that the effect of each covariate is the same for each binary comparison (logit). The assumption is regularly used with the cumulative logit link.
2.2. Missing Data in Longitudinal Studies
Suppose that longitudinal data consists of N subjects and let Yij be an ordered
variable for subject i with C categories assessed at jth occasion
(
j=1,2, , T)
.We define Yijc=I Y
(
ij=c)
for c=1, , C , where I( )
. is the indicatorfunction equal to one when the argument is true and zero otherwise. Let
(
1, ,)
i i iT
Y = Y Y ′ denote the vector of repeated measurements of the ith subject.
Associated with each subject, there is a vector of covariates, say Xij, measured
at time j. Let Xi =
(
Xi1, , XiT)
′ be the covariates matrix for ith subject. Themarginal distribution of Yij will have a multinomial distribution such that:
(
)
1
| , C yijc
ij ij ijc
c
f Y X µ
=
=
∏
DOI: 10.4236/ojs.2018.85051 774 Open Journal of Statistics
where µijc=µijc
( )
β =E Y X(
ijc| ,i β) (
=P Yij=c X| ,i β)
, is the probability ofbeing at category c at time j given a set of covariates and β =
(
β β0c, x)
is avector of regression parameters. The cumulative proportional odds model is a
popular choice to model µijc [19]. Specifically, the cumulative logit model is
given as
(
)
0logitPr Yij ≤c X| ij =β c+Xij x′β c=1,2, ,C−1 (2)
where β0 is the vector of intercept parameters and βx is the vector of
coefficients and does not the depend on c.
Now if we let Ri=
(
Ri1, , RiTi)
be the indicator vector corresponding to(
1, , i)
i i iT
Y = Y Y and Rij=
(
Ri1, , Ri j, 1−)
. Yi can be split into subvectors(
0, m)
i i
Y Y where 0
i
Y denotes the observed component and m
i
Y refers to the
missing component. Now we let Rij=0 if the outcome Yij is missing and
1 ij
R = if Yij is observed. The joint distribution of the full data Yi and the
indicator vector random variable Ri can be factorised as
(
i, | , ,i i)
(
i| ,i) (
i i| , ,i i)
,f Y R X θ ψ = f Y X θ P R r Y X= ψ (3)
where f Y X
(
i| ,i θ)
denotes the marginal density of the measurement process,(
i i| , ,i i)
P R r Y X= ψ denotes the missing data model whose parameter are
contained in ψ . ψ is an unknown parameter governing the missing data
mechanism and θ denotes the vector of parameters describing the response
variable. The distribution of Ri may depend on Yi. In terms of probability, we
may define these distributions such that the data is said to be MAR if
(
| , , ,0 m)
(
| , ,0)
i i i i i i i i i
Pr R r Y Y X= ψ =Pr R r Y X= ψ , MCAR if
(
| , , ,0 m)
(
| ,)
i i i i i i i i
Pr R r Y Y X= ψ =Pr R r X= ψ and MNAR if
(
| , , ,0 m)
(
| , , ,0 m)
i i i i i i i i i i
Pr R r Y Y X= ψ =Pr R r Y Y X= ψ .
In this paper, our main interest is on missing data due to dropouts. For all
components of Yij that are not observed, the corresponding components of
ij
R will be 0. We can then replace the vector Ri by a scalar variable Di, the
drop out indicator, commonly defined as:
1
1 T .
i ij
j
D R
=
= +
∑
(4)i
D denotes the time at which subject i dropped out. The model for drop outs
process can therefore be written as
(
i i| , ,i i)
(
i i| , ,i i)
,P R r Y X= ψ =P D d R X= ψ (5)
where di is the realisation of the variable Di. In Equation (4), it is assumed
that all subjects are observed on the first occasion so that Di takes values
between 2 and
(
T+1)
. The maximum value(
T+1)
corresponds to a completemeasurement sequence.
3. Statistical Methods for Handling Missing Data
3.1. Generalized Estimating Equations
DOI: 10.4236/ojs.2018.85051 775 Open Journal of Statistics
Wedderburn [22] and later developed and extended by McCullagh and Nelder
[23]. GEE is a general statistical approach to fit a marginal model for
longitudinal data analysis in clinical trials or biomedical studies. This method has computational simplicity and marginal parameter estimation. The method estimates model parameters by iteratively solving a system of equations based on extended quasi-likelihood where the extension to the generalized linear model is towards incorporating correlations.
Suppose that longitudinal data consists of N subjects. For subject
(
)
, 1,2, ,
i i= N , there are T observations and let Yij denote the jth response
(
j=1,2, ,T)
, and let Xij denote the p×1 vector of explanatory variables.Suppose Yi=
(
Y Yi1, , ,i1YiT)
′ denote the corresponding column vector ofresponse variable for the ith subject with the mean vector
(
)
1, 2, ,
i= µ µi i µiT
µ
where µij is the corresponding jth mean. The marginal model specifies that a
relationship between E Y
( )
ij =µij and the covariates Xij is as follows:( )
ij ij ,g µ =X′β (6)
where g is a link function and
β
is the vector of regression parameters. On theother hand, the conditional variance of Yij given Xij is given as
(
ij| ij)
( )
ijVar Y X =φν µ , where
φ
is a scaling parameter and ν is a knownvariance function of µij . Based on Liang and Zeger [6]; Lipsitz [24], the
generalized estimating equations has the form
( )
1(
)
1 0,
N i
i i i
i
U V Y−
= ∂
= − =
′ ∂
∑
µβ µ
β (7)
where β′ denotes a transpose vector of marginal regression parameters
β
,( )
1 1
2 2
i i i i
V A R= α A is a covariance matrix of Yi in which Ai is a diagonal
matrix containing marginal variances. Ri
( )
α is a “working” correlation matrixthat expresses the marginal correlation between repeated measures and α is a
vector of noises which may be handled by the introduction of the working correlation structure such as independence, autoregressive of the first order (AR(1)), exchangeable, or unstructured. For AR(1) the correlations decline
exponentially between measures i.e. Corr
(
,)
j hij ih
Y Y =ρ − . In the independence,
the identity matrix serves as the working correlation matrix. On the other hand, for exchangeable structure the correlation between any two measures are assumed to be the same regardless of the time from one period to the next. Under unstructured case, every pair of measurements is given its own association parameter.
Under mild regularity conditions and correct specification of the marginal
mean µi, Liang and Zeger [6] showed that the estimator βˆ, obtained by
solving Equation (7), is consistent and N
(
β βˆ−)
converges in distribution toa multivariate normal with mean vector 0 and covariance matrix given by
1 1
0 1 0
lim ,
N
DOI: 10.4236/ojs.2018.85051 776 Open Journal of Statistics
where
( )
1 1
0 1
1 and 1 ,
N N
i i i i
i i i
i V i Var Y V
− −
= =
′ ′
∂ ∂ ∂ ∂
Σ = Σ =
′ ′
∂ ∂ ∂ ∂
∑
µβ βµ∑
µβ βµ (9)where µi′ in Equation (9) denotes a transpose mean vector of µi. In practice,
the “sandwich” covariance matrix Vβ in Equation (8) is calculated by ignoring
the limit and replacing
β
and α by their estimates, and also Var Y( )
i inexpression Σ1 by
(
)(
)
T
ˆ ˆ
i i i i
y −µ y −µ [25].
3.2. Multiple Imputation Generalized Estimating Equations
This method is a simulation-based approach that imputes missing values
multiple times [5]. The main idea of the procedure is to replace each missing
value with a set of M plausible values drawn from the conditional distribution of
the unobserved values given the observed ones. This conditional distribution
represents the uncertainty about the right value to impute. In this way, M
imputed datasets are generated (imputation stage), which are then analysed using standard complete data methods (analysis stage). Finally, the results from
the M analyses have to be combined into a single inference (pooling stage) using
Rubin [5] rules.
Let βˆk and Uk be the estimate of a parameter of interest
β
and itscovariance matrix from the kth completed data set,
(
k=1,2, , M)
respectively.According to Little and Rubin [7], the combined point estimate for the
parameter of interest
β
from the MI is simply the average of M complete-datapoint estimates:
1
1
ˆ M ˆk
k
M =
=
∑
β β (10)
and an estimate of the covariance matrix of βˆ is given by
1 , M
V W B
M
+
= +
(11)
where
(
)(
)
1 1
1 and 1 ˆ ˆ ˆ ˆ .
1
M M
k k k
k k
W U B
M = M =
′
= = − −
−
∑
∑
β β β βhere, W measures the within-imputation variability and B measures the
between-imputation variability.
As Schafer [26] expressed, MI can be used to create the imputations from a
fully parametric model. After drawing the imputations, one analyses the imputed datasets by a semi-parametric or non-parametric estimation procedure to achieve better performance and greater robustness. In the context of binary
outcomes, [27] [28] [29] used MI to fill in missing values for GEE analysis in
data that are MAR. So GEE can be used after MI, leading to a hybrid technique
named MIGEE [26]. Typically, the missing data mechanism can be further
DOI: 10.4236/ojs.2018.85051 777 Open Journal of Statistics
3.3. Inverse Probability Weighted Generalized Estimating
Equations
When data are incomplete, GEE suffers bias from its frequentist nature and it is
generally valid only under the strong assumption of MCAR [1]. Robins [8]
proposed a class of weighted generalized estimating equations, effectively to remove bias and provide valid statistical inferences to regression parameter estimates for marginal models in the incomplete longitudinal data scenario by allowing it to be MAR. This method requires specification of a dropout model in terms of observed outcomes and/or explanatory variables. The idea behind IPWGEE is to weight each subject’s contribution in the GEEs by the inverse probability that a subject drops out at the time they dropped out. Such a weight can be expressed as
(
)
(
)
{ }
1
2 , 1
2
2 , 1
1 0 | 1
0 | i ,
j
ij i it i i t
t
I j T
ij i i j
w P D j P R R R
P R R R
− − = ≤ − = = = − = = = = × = = =
∏
(12)where j=2,3, , T+1, I
{}
is an indicator variable and Di is a dropoutindicator for the subject i, where 1 T1
i j ij
D = +
∑
=R . The first visit Yi1 is assumedto be always observed with Ri1=1 so that 2≤D Ti≤ +1. Hence D Ti= +1
represents that subject i completes all the T visits, which were set prior by design.
In the IPWGEE approach, GEE estimator for
β
is based on solving theequation:
( )
1 12 12 1(
)
1 0,
N
i
i i i i i i
i
U W A R A y
− − = ∂ = ′ − = ∂
∑
µ β µβ (13)
where Wi=diag
{
R wi1 i1, , R wiT iT}
is a diagonal matrix of event specific weights.A consistent estimator for
β
can be obtained by solving Equation (13), underthe correct specification of the missing data model. Following [30] the score
equations to be solved are:
( )
1(
)
( )
12 12 1( ) ( )
{
( )
}
1 2 0,
N T
i i
i i i i i
i d id
I D d
U d A R A d y d d
w µ − + = = = ∂ = ∂ ′ − =
∑∑
µ ββ (14)
where y di
( )
and µi( )
d are the first d−1 elements of yi and µirespectively. Provided that the wid are correctly specified, IPWGEE provides
consistent estimates of the model parameters under a MAR mechanism. Estimators from IPWGEE enjoy robustness properties similar to the ones from ordinary GEE, that is., the correlation structure does not need to be correctly specified.
3.4. Double Robust Generalized Estimating Equations
The doubly robust method is an alternative approach that uses the inverse
probability weights (IPW) to refine estimates of the model parameters [11],
DOI: 10.4236/ojs.2018.85051 778 Open Journal of Statistics
models: 1) the first model is on the distribution of the complete data which include both the outcome and covariates, and 2) a model for the missingness mechanism. The doubly robust (DR) estimating equations method has been developed as an extension of the WGEE method, where the idea is to integrate the weights with the use of a predictive imputation model for the missing data given the observed data. Equation (13) has been extended toward so called
robustness [11] [31].
Tsiatis [9] and Scharfstein [31] showed that adding a term of expectation zero,
say γ
( )
. , to the inverse probability weighted estimators would still result inconsistent estimates under a MAR mechanism. These augmented equations give
rise to doubly robust estimators. Chen and Zhou [12] noted that the optimal
opt
γ for missing response is given by
(
0)
(
)
(
)
1
1 1
1 2 2
opt m| , , 11 ,
i i i i
i
i i i i i i
Y Y X R
E W A R A y
γ
− −
∂
′
= ∂ ′ − −
µ
µ
β
(15)where 1 and 1’ is a vector of 1’s of length Ti and its transpose respectively, and
m i
Y denote the missing component of Yi. Undefined variables and parameters
in Equation (15) are as defined before in section 0. The parameters
β
areestimated by solving the estimating equations,
( )
( )
1 12 12 1(
)
1 1 opt
1 1 0.
N N
i
i i i i i i i
i i
U
θ
Uθ
W A R A yγ
− −
= =
∂
= = ∂ ′ − + =
∑
∑
µ
µ
β
(16)The estimator for
β
in Equation (16) is doubly-robust in the sense that it isconsistent if at least one of the missing data models is correctly specified. In current application, we combine inverse probability weighting (IPW) with MI and the GEE as the analysis to construct DRGEE. The robustness of the imputation model is enhanced by ensuring necessary information is included in the model, while avoiding the bias from the final inference.
The aim of the DRGEE estimation; is to estimate the propensities for each incomplete variable conditional on the other variables, and impute the missing
values on that variable by the inclusion of propensity functions (i.e. IPW) into
the imputation model. Finally, the results of the analysis from M completed
(imputed) data are combined into a single inference using Rubin [5] rules. The
expectation of this method is to be readily robust, and by design it is aimed at handling incomplete data with any pattern of missingness.
4. Simulation Study
4.1. Data Generation and Simulation Designs
We simulated data in order to mimic an ordinal longitudinal clinical trial data. We simulated 1000 datasets based on the marginal model (17) for random
sample sizes N=100,300 and 500. We consider a study with Ti=4 repeated
ordinal measures (with four categories) and two covariates (one binary and the
DOI: 10.4236/ojs.2018.85051 779 Open Journal of Statistics
been assigned to two treatment arms (Higher dose = 1 and Mild dose = 0) and 2
x represent exposure period. The true marginal model is
(
c=1, , C−1; 1, ,i= N)
:(
)
0logitPr Yij≤c x| =βc+βxx′, for j=1,2,3,4 (17)
where the model parameters are β =
(
β β0c, x)
. Here x′ =(
x x1, 2)
is a vector ofpredictor variables. The parameter values used in the simulations are β = −01 0.4,
02 0.2
β = , β =03 0.5, β =1 0.5 and β = −2 0.1. The correlated ordinal response
were generated using the NORTA method [32] with a constant correlation
between the latent vectors as ρ =0.9. This method uses the probability integral
transformation to transform a d-variate normal random vector to the desired
multivariate distribution with specified marginals and correlation matrix. Probability integral transformation relates to the result that data values that are modelled as being random variables from any given continuous distribution can be converted to random variables having a uniform distribution. We used the R
package SimCorMultRes [32] which makes it easy to simulate correlated
categorical responses under the marginal model (17). The package implements marginal models for correlated binary responses as well as for correlated multinomial response categories taking into account the nature of response categories (ordinal or nominal).
For comparison purposes, standard GEE was considered to analyse the full datasets. Each estimate is an average of 1000 estimates from the different simulated datasets. After analysing the full data set we then create the dropouts. Dropouts were created on the complete simulated datasets using different
settings of missingness rate on response variable Yij and according to the
MCAR or MAR missing mechanism.
The dropout model is based on a logistic regression for the probability of
dropout at occasion j, given that the individual was in the study up to occasion
1
j− . This probability is denoted by P h y
(
ij; ij)
, and the outcome history hij isexpressed as hij=
(
yi1, , yi j, 1−)
. In this study, the assumption is that dropoutdepends only on the current observed measurement yij and the immediately
preceding measurement yi j, 1− . We therefore assume that dropout process is
modelled by a logistic regression of the form
(
)
(
)
0 1 , 1 2
logit , logit | , ,
,
ij ij i i ij ij
i j ij
Pr h y Pr D j D j h y
y y
ψ ψ − ψ
= = ≥
= + + (18)
with ψ0 denoting the intercept of regression, ψ1 and ψ1 are respectively the
coefficients of yi j, 1− and yij. The model (18) reduces to a MAR if ψ =2 0 (i.e.
the missingness process is related to the observed outcome prior to dropout) and
MCAR if ψ ψ1= 2=0. In both MAR and MCAR settings, after simulating a data
set without missing data, we adopted the following strategy. We assume that dropout can occur after the first time point. Thus in this study, four dropout
DOI: 10.4236/ojs.2018.85051 780 Open Journal of Statistics
third time point, 3) dropout at the fourth time point, 4) no dropout.
According to Satty [28], the data generated at time j and the subsequent times
were assumed to be dependent on the outcome measure at time j. The true
dropout model is written as:
(
, 1)
0 , 1logitPr Di = j D| i≥ j y, i j− =ψ +ψprev i jy − (19)
where j=2,3,4, ψ0=
(
2,2.3,2.3)
and ψprev=(
0.3, 0.2, 0.37− −)
. The valuesfor ψ0 and ψprev were used to generate different dropout rates. The
combination of this MAR logistic dropout model with the measurement model (18) defines our data generating model, which is hereinafter referred to as GM I.
We further consider a second data generating model, GM II, in which the outcomes are generated based on model (18) and random missingness is induced via the following MCAR logistic regression model:
(
, 1)
0 , 1logitPr Di= j D| i ≥ j y, i j− =ψ +ψprev i jy − (20)
where j=2,3,4, ψ0 =
(
3.2,1.5,1.2)
and ψprev=0.After creating the dropouts, the incomplete data sets were analysed using the three (3) extensions of GEE namely; MIGEE, IPWGEE and DRGEE. The performances of these methods were assessed in terms of mean squared error (MSE) and bias.
4.2. Performance Measures for Evaluating Different GEE Methods
In the evaluation, inferences are drawn on the complete data before the dropouts are created. Complete-data results are used as the standard against which those obtained from applying IPWGEE, MIGEE and DRGEE approaches are
compared. R software [33] was used to perform statistical analysis and to
produce the results.
The performance of the three methods were evaluated using bias and mean
squared error(MSE). These criteria were recommended in [34] and [35]. First we
defined the bias as
ˆ
Bias= β β− , (21)
where
β
is the true value for the estimate of interest, 1ˆ
ˆ S s
s S
β
β =
∑
= is theaverage estimate of interest, S is the number of simulation replications
performed, and βˆs is the estimate of interest within each of the s=1, , S
simulations. The mean squared error (MSE) was given by
( )
2 2
ˆ ˆ
MSE= β β− +SE β , (22)
where SE
( )
βˆ denotes the empirical standard error (SE) of the estimate over allsimulations [35]. SE is calculated as the standard deviation of the estimates of
DOI: 10.4236/ojs.2018.85051 781 Open Journal of Statistics
average of the estimated within simulation SE for the estimate of interest
( )
1
ˆ SE s S
s S
β
=
∑
could be used, where SE( )
βˆs denotes the standard error of theestimate of interest within each simulation. Normally, small values of MSE are desirable [36].
5. Simulation Results and Analysis
In this section, we discuss the result of simulation study that compares the three techniques namely; MIGEE, IPWGEE and DRGEE for different sample size and different missingness rates on the response variable. The measurement at first time point were assumed to be observed for each individual. Note that the primary focus was to compare MIGEE, IPWGEE and DRGEE, but we extend the results to include those obtained from full datasets using standard GEE. The imputation model considered here is the imputation using chained equations
[37], with the number of multiple imputation set to M=5. This number of
imputations was chosen to account for the fraction of missing information and to get efficient parameter estimates. We incorporate weights to analyze the IPWGEE. The simulation study also considers the correct specified model for the imputation model for both the MIGEE and DRGEE. We considered a correct propensity score model for DRGEE. The logistic regression was used to estimate the propensity scores for the DRGEE, which was then used in the imputation model. The incomplete data set were multiply imputed and analyzed by MIGEE and DRGEE techniques respectively.
A better method is expected to produce parameter estimates closer or similar to the true values, hence yielding small bias. Likewise, a small MSE denotes a
better or precise method. Results are presented in Tables 1-3 for 8%, 25% and
33% dropout rates respectively, under MAR mechanism. For MCAR mechanism,
[image:12.595.210.538.552.728.2]results are presented in Table 4 and Table 5.
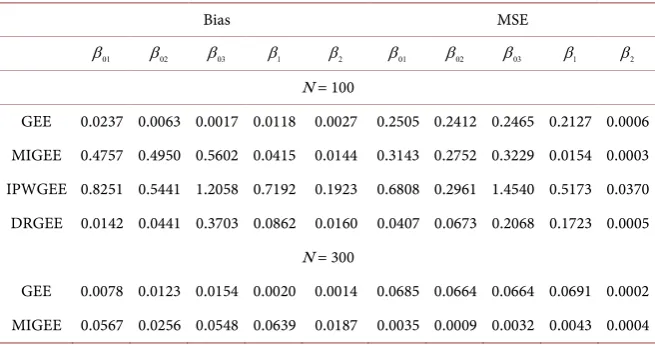
Table 1. Bias and mean squared error (MSE) estimates from MIGEE, IPWGEE and DRGEE under MAR mechanism for 1000 simulations of incomplete data of sizes: N = 100, 300, 500.
Bias MSE
01
β β02 β03 β1 β2 β01 β02 β03 β1 β2
N = 100
GEE 0.0237 0.0063 0.0017 0.0118 0.0027 0.2505 0.2412 0.2465 0.2127 0.0006 MIGEE 0.4757 0.4950 0.5602 0.0415 0.0144 0.3143 0.2752 0.3229 0.0154 0.0003 IPWGEE 0.8251 0.5441 1.2058 0.7192 0.1923 0.6808 0.2961 1.4540 0.5173 0.0370 DRGEE 0.0142 0.0441 0.3703 0.0862 0.0160 0.0407 0.0673 0.2068 0.1723 0.0005
N = 300
DOI: 10.4236/ojs.2018.85051 782 Open Journal of Statistics Continued
IPWGEE 0.7325 0.4520 1.0329 1.0138 0.1948 0.5588 0.2286 1.0990 1.0484 0.0382 DRGEE 0.2769 0.1347 0.0645 0.0945 0.0121 0.0779 0.0189 0.0044 0.0092 0.0001
N = 500
GEE 0.0025 0.0068 0.0100 0.0057 0.0006 0.0390 0.0384 0.0388 0.0385 0.0000 MIGEE 0.0461 0.1154 0.1126 0.2283 0.0067 0.0114 0.0195 0.0177 0.0679 0.0000 IPWGEE 0.6949 0.5496 1.1140 1.0700 0.2281 0.5166 0.3445 1.2860 1.1615 0.0520 DRGEE 0.1641 0.2591 0.0189 0.1784 0.0012 0.0276 0.0716 0.0173 0.0627 0.0000
[image:13.595.213.538.88.205.2]Notes: Also estimates from full datasets (GEE). Approximately (8%) missing values on the outcome varia-ble.
Table 2. Bias and MSE estimates from MIGEE, IPWGEE and under MAR mechanism for 1000 simulations of incomplete data of sizes: N = 100, 300, 500.
Bias MSE
01
β β02 β03 β1 β2 β01 β02 β03 β1 β2
N = 100
GEE 0.0237 0.0063 0.0017 0.0118 0.0027 0.2505 0.2412 0.2465 0.2127 0.0006 MIGEE 0.3192 0.3373 0.2830 0.7887 0.0284 0.1025 0.1143 0.0805 0.6221 0.0008 IPWGEE 0.9322 0.1136 0.7884 1.4709 0.2109 0.8694 0.0134 0.6220 2.1653 0.0445 DRGEE 0.4259 0.3067 0.1236 0.0054 0.0082 0.1822 0.0945 0.0156 0.0195 0.0007
N = 300
GEE 0.0078 0.0123 0.0154 0.0020 0.0014 0.0685 0.0664 0.0664 0.0691 0.0002 MIGEE 0.0757 0.0244 0.0159 0.1344 0.0054 0.0644 0.0573 0.0674 0.0445 0.0007 IPWGEE 0.3794 0.8610 1.4330 0.8438 0.2269 0.1447 0.7420 2.0543 0.7120 0.0515 DRGEE 0.4050 0.2510 0.3149 0.3018 0.0289 0.3161 0.1624 0.1461 0.1089 0.0014
N = 500
GEE 0.0025 0.0068 0.0100 0.0057 0.0006 0.0390 0.0384 0.0388 0.0385 0.0000 MIGEE 0.0080 0.0220 0.0347 0.2257 0.0063 0.0006 0.0012 0.0036 0.0613 0.0000 IPWGEE 0.6705 0.4881 1.1094 0.9383 0.2109 0.4500 0.2385 1.2310 0.8807 0.0445 DRGEE 0.1210 0.0257 0.0535 0.0751 0.0178 0.2981 0.2068 0.1534 0.0451 0.0003
Notes: Also estimates from full datasets (GEE). Approximately (25%) missing values on the outcome varia-ble.
Table 3. Bias and MSE estimates from MIGEE, IPWGEE and DRGEE under MAR mechanism for 1000 simulations of incomplete data of sizes: N = 100, 300, 500.
Bias MSE
01
β β02 β03 β1 β2 β01 β02 β03 β1 β2
N = 100
[image:13.595.209.539.274.570.2]DOI: 10.4236/ojs.2018.85051 783 Open Journal of Statistics Continued
IPWGEE 0.5056 0.7440 1.2986 0.7512 0.2035 0.2556 0.5535 1.6863 0.5644 0.0414 DRGEE 0.1678 0.0255 0.1731 0.1542 0.0156 0.1385 0.0898 0.1133 0.0803 0.0011
N = 300
GEE 0.0078 0.0123 0.0154 0.0020 0.0014 0.0685 0.0664 0.0664 0.0691 0.0002 MIGEE 0.2929 0.2695 0.2568 0.1196 0.0208 0.0893 0.0880 0.0705 0.0201 0.0004 IPWGEE 0.7047 0.5080 1.1535 0.8065 0.2020 0.4972 0.2586 1.3312 0.6507 0.0408 DRGEE 0.7620 0.4790 0.3708 0.2186 0.0555 0.5837 0.2300 0.1400 0.0489 0.0031
N = 500
[image:14.595.205.537.333.741.2]GEE 0.0025 0.0068 0.0100 0.0057 0.0006 0.0390 0.0384 0.0388 0.0385 0.0000 MIGEE 0.2859 0.1804 0.1412 0.4514 0.0011 0.0819 0.0326 0.0200 0.2043 0.0000 IPWGEE 0.9661 0.2342 0.8597 1.1017 0.2041 0.9395 0.0603 0.7457 1.2159 0.0417 DRGEE 0.1506 0.1027 0.1002 0.3607 0.0074 0.0229 0.0109 0.0103 0.1303 0.0000
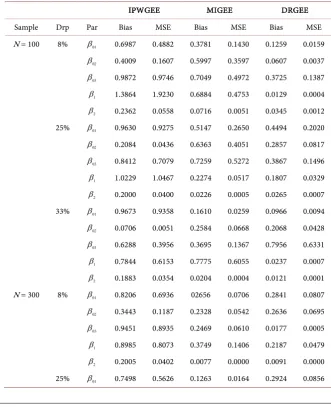
Table 4. Bias and MSE estimates from MIGEE, IPWGEE and DRGEE under MCAR mechanism for 1000 simulations of incomplete data of sizes: N = 100, 300.
IPWGEE MIGEE DRGEE
Sample Drp Par Bias MSE Bias MSE Bias MSE N = 100 8% β01 0.6987 0.4882 0.3781 0.1430 0.1259 0.0159
02
β 0.4009 0.1607 0.5997 0.3597 0.0607 0.0037
03
β 0.9872 0.9746 0.7049 0.4972 0.3725 0.1387
1
β 1.3864 1.9230 0.6884 0.4753 0.0129 0.0004
2
β 0.2362 0.0558 0.0716 0.0051 0.0345 0.0012 25% β01 0.9630 0.9275 0.5147 0.2650 0.4494 0.2020
02
β 0.2084 0.0436 0.6363 0.4051 0.2857 0.0817
03
β 0.8412 0.7079 0.7259 0.5272 0.3867 0.1496
1
β 1.0229 1.0467 0.2274 0.0517 0.1807 0.0329
2
β 0.2000 0.0400 0.0226 0.0005 0.0265 0.0007
33% β01 0.9673 0.9358 0.1610 0.0259 0.0966 0.0094
02
β 0.0706 0.0051 0.2584 0.0668 0.2068 0.0428
03
β 0.6288 0.3956 0.3695 0.1367 0.7956 0.6331
1
β 0.7844 0.6153 0.7775 0.6055 0.0237 0.0007
2
β 0.1883 0.0354 0.0204 0.0004 0.0121 0.0001 N = 300 8% β01 0.8206 0.6936 02656 0.0706 0.2841 0.0807
02
β 0.3443 0.1187 0.2328 0.0542 0.2636 0.0695
03
β 0.9451 0.8935 0.2469 0.0610 0.0177 0.0005
1
β 0.8985 0.8073 0.3749 0.1406 0.2187 0.0479
2
DOI: 10.4236/ojs.2018.85051 784 Open Journal of Statistics Continued
02
β 0.5852 0.3429 0.1906 0.0367 0.0910 0.0084
03
β 1.1789 1.3903 0.1987 0.0399 0.4986 0.2486
1
β 0.6393 0.4089 0.1273 0.0162 0.2175 0.0473
2
β 0.2032 0.0413 0.0110 0.0001 0.0193 0.0004
33% β01 0.8742 0.7645 0.1347 0.0188 0.3772 0.1424
02
β 0.3449 0.1192 0.0192 0.0006 0.0978 0.0097
03
β 0.9912 0.9828 0.0345 0.0014 0.7059 0.4985
1
β 1.0100 1.0193 0.0371 0.0014 0.3549 0.1259
2
β 0.2045 0.0418 0.0044 0.0000 0.0156 0.0002
[image:15.595.209.539.310.602.2]Notes: Also estimates from full datasets (GEE). Approximately (33%) missing values on the outcome varia-ble.
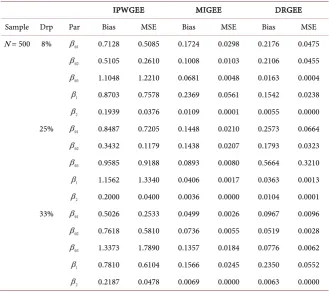
Table 5. Bias and MSE estimates from MIGEE, IPWGEE and DRGEE under MCAR mechanism for 1000 simulations of incomplete data of size: N = 500.
IPWGEE MIGEE DRGEE
Sample Drp Par Bias MSE Bias MSE Bias MSE N = 500 8% β01 0.7128 0.5085 0.1724 0.0298 0.2176 0.0475
02
β 0.5105 0.2610 0.1008 0.0103 0.2106 0.0455
03
β 1.1048 1.2210 0.0681 0.0048 0.0163 0.0004
1
β 0.8703 0.7578 0.2369 0.0561 0.1542 0.0238
2
β 0.1939 0.0376 0.0109 0.0001 0.0055 0.0000
25% β01 0.8487 0.7205 0.1448 0.0210 0.2573 0.0664
02
β 0.3432 0.1179 0.1438 0.0207 0.1793 0.0323
03
β 0.9585 0.9188 0.0893 0.0080 0.5664 0.3210
1
β 1.1562 1.3340 0.0406 0.0017 0.0363 0.0013
2
β 0.2000 0.0400 0.0036 0.0000 0.0104 0.0001 33% β01 0.5026 0.2533 0.0499 0.0026 0.0967 0.0096
02
β 0.7618 0.5810 0.0736 0.0055 0.0519 0.0028
03
β 1.3373 1.7890 0.1357 0.0184 0.0776 0.0062
1
β 0.7810 0.6104 0.1566 0.0245 0.2350 0.0552
2
β 0.2187 0.0478 0.0069 0.0000 0.0063 0.0000
5.1. Simulation Results for MAR Missing Data
Examining Table 1, considering bias, it can be observed that largest values are
obtained under the IPWGEE. Similar trend was observed under MSE. This was consistent for all samples. Comparing MIGEE and DRGEE, it can be seen that DRGEE produces better estimates in terms of bias than MIGEE, except for
1, 2
β β (N=100) and β β01, 02 (N=500). Same trend was observed under
DOI: 10.4236/ojs.2018.85051 785 Open Journal of Statistics
performs better than DRGEE in terms of bias and MSE except for β2. Looking
at GEE, it can be seen that bias was smaller for all samples, hence it implies that estimates were closer to true parameter values.
Shifting focus to Table 2, with a 25% dropout rate, the scenario observed in
Table 1 is slightly changed. Here, it can be seen that largest bias are recorded
IPWGEE under the sample size 100 for all β′s except β02 where MIGEE
gives the largest bias. Similar trend was observed under the sample size 300
where DRGEE recorded the largest bias for β01. Looking at MSE, IPWGEE
produced the largest values for all cases except for β02 (N=100) and β01
( N=300 ) which were produced by MIGEE and DRGEE respectively.
Comparing MIGEE and DRGEE, for sample N=100 and N=300, the trends
are similar to what was observed in Table 1. But for N=500, we notice
different scenario from Table 1 as MIGEE produced better estimates than
DRGEE except for β1.
In Table 3, with a 33% dropout rate, for sample 100 and 300, the previous
trend for both bias and MSE in Table 2 are repeated. Comparing MIGEE and
DRGEE, for all samples, the trends are largely similar to what was observed in
Table 1.
As expected, it can be seen that in most cases IPWGEE was more biased compared to the MIGEE and DRGEE. In addition, IPWGEE has larger MSE values than the other methods. It can be seen that for sample size 300, MIGEE performed better than DRGEE for different dropout rates, except for 25% dropout rate where MIGEE was better than DRGEE for sample size 300 and 500. Generally, the bias was negligible for all methods showing asymptotically parameter estimates. In sum, although all methods performed equally well in terms of bias and MSE, DRGEE provided better parameter estimates than the single robust counterparts.
5.2. Simulation Results for MCAR Missing Data
In Table 4, under the sample size of 100, we notice that DRGEE produced smallest values of bias showing asymptotically unbiased estimates, except for
03
β under 33% dropout rate. It can also be noticed that the MSE based on
DRGEE was marginally smaller than the MIGEE and IPWGEE, except for β03
under 33% dropout setting. However, under the sample size of 300, MIGEE performed better than DRGEE and IPWGEE in terms of bias and MSE. In addition, it can be seen that IPWGEE produces largest values of bias and MSE for all cases.
Now shifting focus to Table 5, for IPWGEE method, we notice that the trends
are largely similar to what was observed in Table 4. Comparing DRGEE and
DOI: 10.4236/ojs.2018.85051 786 Open Journal of Statistics
5.3. Application to a Real Dataset
The dataset used is from a homoeopathic clinic in Dublin, made available in
[38]. The data was collected from 60 patients who were suffering from arthritis.
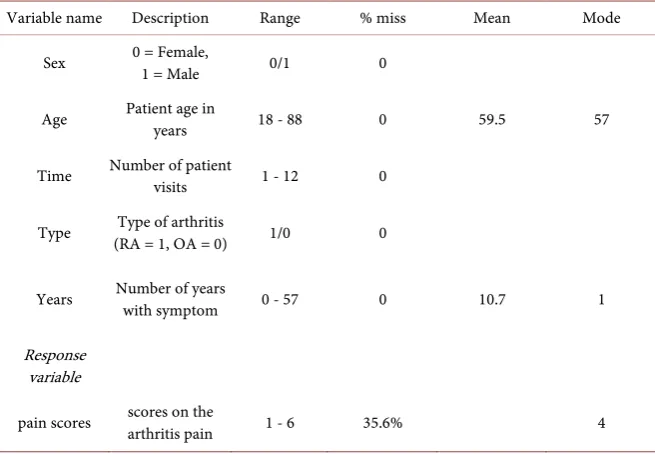
There were 12 males and 48 females between the ages of 18 and 88 years in the study. These patients were followed up for a month (in 12 visits). Pain scores was assessed during a monthly followup and it was graded from 1 to 6 (high indicating worse pain score recorded). Out of 60 patients only two had all scores for the 12 visits. At initial visit, baseline information were recorded, such as age, sex (male/female), arthritis type (RA = rheumathoid arthritis, OA = ostheo-arthritis), and the number of years with the symptom. All patients were under treatment for arthritis, and only those with a baseline pain score greater than 3 and a minimum of six visits are reported.
We think the MAR mechanism may be reasonable because, for instance, a patient’s visit to a clinic may depend on his/her previous observed pain score: if s/he scored a high pain score on his/her last visit, s/he may be likely to attend the next visit to treat the disease efficiently. Both monotone dropouts pattern and nonmonotone missingness were observed in the data. The amount of monotone dropouts was considerable (33.8%), while that of nonmonotone missigness was much smaller (1.8%). Overall, approximately 36% of the pain score data were missing/not observed. Some descriptive statistics of the dataset are summarized in Table 6.
For the ordinal response scale, we used the following proportional odds model
(
)
0logitPr Yij≤c x| ij =βc+βx cij′, =1, ,5, j=1, ,12, (23)
where Yij is the pain score status of the ith patient at jth visit, xij is the covariate
vector at time j. Here, the covariate vector is formed by Sex, Age, Time, Type
and Years.
DRGEE was applied to the real dataset. The reason why we chose DRGEE as an optimum method was: 1) simulation results showed that it performed better than MIGEE and IPWGEE under MAR and 2) MAR mechanism was observed in the arthritis data. When dealing with DRGEE it is necessary to correctly specified inverse probability weighting and imputation model, in order to obtain
consistent estimates of
β
. The weights were based on a logistic regressionmodel for dropout:
(
)
0logitP Di= j D| i≥ j v, ij =ψ j+ψv jij′, =1, ,12, (24)
where vij include sex, age, type, history of observed pain scores. Here, Di =1
if the pain score was observed and 0 otherwise. We incorporate weights obtained in Equation (24) in the imputation model, in order to get double robust estimates. Available data was analysed without alteration or any attempts to impute data missing on the response variable. This was under ordinary GEE.
Results from the two approaches are shown below in Table 7. The first one is the
DOI: 10.4236/ojs.2018.85051 787 Open Journal of Statistics
Table 6. Descriptive statistics for arthritis data.
Variable name Description Range % miss Mean Mode
Sex 0 = Female, 1 = Male 0/1 0
Age Patient age in years 18 - 88 0 59.5 57
Time Number of patient visits 1 - 12 0
Type (RA = 1, OA = 0) Type of arthritis 1/0 0
Years Number of years with symptom 0 - 57 0 10.7 1
Response variable
pain scores scores on the arthritis pain 1 - 6 35.6% 4
Note: Missing values on the response variable. Type of arthritis (RA = rheumathoid arthritis, OA = os-theo-arthritis).
Table 7. Parameter estimates (Est), standard errors (SE) and p-value obtained from Arthritis data.
GEE DRGEE
Parameter Est SE Pr t> Est SE Pr t>
Sex −0.3366 0.5073 0.5070 0.5627 0.2780 0.0429 Age −0.0253 0.0139 0.0708 −0.0278 0.0087 0.0007 Time 0.2115 0.0422 <0.0001 0.2719 0.0249 <0.0001 Type −0.8775 0.3372 0.0093 −0.6069 0.2288 0.0079 Years −0.0048 0.0149 0.7454 0.0026 0.0094 0.7768
Note: Approximately (36%) data missing on the response variable. Available data analyzed using GEE.
The results showed that Time effect was significant and the variable Years was non significant for both methods. It can be noticed that p-value for Age goes from non-significant (0.07) in the ordinary GEE to a significant one in DRGEE. Similar trend was observed for the variable Sex. Both methods provide the same conclusion for effects of type of arthritis a patient is diagnose with. The negative effect for Type means that the chance of a patient to feel/record minimal pain is lower among the patients who had rheumathoid arthritis type compared to those
who had ostheo-arthritis (the estimated odds e−0.6069 =0.5450 in the DRGEE
method). Both methods provided the same conclusion for the effect of Age. That is, each unit increase in Age, the odds of feeling mild pain or minimal pain
[image:18.595.209.539.381.528.2]DOI: 10.4236/ojs.2018.85051 788 Open Journal of Statistics
the standard error produced by DRGEE are marginally smaller than one produced by usual GEE. Overall, it can be seen that there is gain in using DRGEE method due to its doubly robust property.
6. Discussion and Conclusion
In this paper, the focus was to compare three techniques for handling incomplete ordinal outcome based on GEE under MCAR and MAR dropouts in longitudinal data. Three methodologies were used, namely: multiple imputation, inverse probability weighting and its doubly robustness counterpart. First, dropouts were created at different rates on simulated datasets of various sample sizes and the three methods were applied to these incomplete datasets. Then the optimum method was used on the Arthritis data as an application to real data. The dropout rates in simulated data were diverse, ranging from 8% to 33% with the aim to investigate the performance of the approaches when different amount of data are missing. The sample sizes were varied to see how these methods will behave. The performances of the three approaches were evaluated in terms of mean squared error and bias.
For multiple imputation, we make sure that the imputed values bore the structure of the data, uncertainty about the structure and included any
knowledge about the process that led to the data missing [37]. An important
aspect in the case of IPWGEE is the specification of the model for missingness to construct the weights (IPW) for the subjects. These probabilities must be
hemmed away from zero as to avoid trouble of division by zero [28] [39].
Double robust method combines ideas from weighting and imputation and has been applied elsewhere for estimation of means, casual inference and in the
context of longitudinal binary response data [10] [12].
Generally, the results from simulation study showed that all the methods can be satisfactorily used for incomplete ordinal outcomes with the assumption of MAR and MCAR mechanism. It is worth mentioning that almost all methods that are valid under MAR hold under MCAR. This is because MCAR is a special case of MAR. Consequently, ignoring missigness under MCAR will not introduce systematic bias, but will increase the standard error of the sample estimates due
to the reduced sample size [40]. For this reason, MCAR poses less threat to
statistical inferences than MNAR or MAR.
Specifically, when we consider both bias and MSE, a better performance was observed for DRGEE over single robustness alternatives MIGEE and IPWGEE in
the simulation study. This is consistent with the results reported in [10] [13].
DRGEE is more powerful or appealing because of its doubly robust property compared to single robust counterparts. Considering the performance of MIGEE and IPWGEE, the findings generally favoured MIGEE over IPWGEE. This agrees with the theoritical results in that IPW can be less powerful and efficient than Bayesian approach like MI under a well specified parametric model, see
DOI: 10.4236/ojs.2018.85051 789 Open Journal of Statistics
IPWGEE, it has been found by other researchers that MIGEE provides more
efficient results over IPWGEE in longitudinal binary data [27] [28]. Nevertheless,
the misspecification of imputation model cannot be disregarded in practice and
biased results can be expected when the imputation model is incorrect [37] [41].
On the Arthritis data application, the predictive model was correctly specified and this made the doubly estimates have a great potential of reducing bias when the MAR assumption is correct.
In this study, missing values were only on the response variable. However, this does not limit the applicability of DRGEE, MIGEE and IPWGEE to that case only. These methods can be extended to situation where missing values are on the response and covariates variables. It is also important to note that DRGEE, MIGEE and IPWGEE all rely on the assumption that the missingness is MAR (and hence necessarily under MCAR). Typically, the possibility that the missing mechanism is MNAR cannot be ruled out. Whence, caution should be exercised in interpreting results from any of these procedures. Under MNAR, researchers
are always encouraged to do sensitivity analysis [42] [43].
In conclusion, based on the results of this simulation, the DRGEE is recommended because consistency is guaranteed under the MAR (and hence necessarily under MCAR) if at least one of the missing data models is correctly specified. It became clear that the IPWGEE method does not always yield the best results, even if the MAR mechanism holds. In addition, it is advisable to include few and necessary auxiliary variables when constructing weights for individuals, while too many variables can be harmful. For instance, when the number of individuals is small, we run the risk of giving too much weight to one specific subject.
Acknowledgements
Sincere acknowledgements to the African Union for giving me the opportunity to do this research.
Conflicts of Interest
The authors declare no conflicts of interest regarding the publication of this pa-per.
References
[1] Barnard, J. and Meng, X.-L. (1999) Applications of Multiple Imputation in Medical Studies: From AIDS to NHANES. Statistical Methods in Medical Research, 8, 17-36.
https://doi.org/10.1177/096228029900800103
[2] Little, R.J. and Rubin, D.B. (2002) Bayes and Multiple Imputation. Statistical Analy-sis with Missing Data, 200-220.
[3] Rubin, D.B. (1976) Inference and Missing Data. Biometrika, 63, 581-592.
https://doi.org/10.1093/biomet/63.3.581
Re-DOI: 10.4236/ojs.2018.85051 790 Open Journal of Statistics
search Methodology, 12, 293-304. https://doi.org/10.1080/13645570802394003
[5] Rubin, D.B. (1978) Multiple Imputations in Sample Surveys—A Phenomenological Bayesian Approach to Nonresponse. Proceedings of the Survey Research Methods
Section of the American Statistical Association, 1, 20-34.
[6] Liang, K.-Y. and Zeger, S.L. (1986) Longitudinal Data Analysis Using Generalized Linear Models. Biometrika, 73, 13-22. https://doi.org/10.1093/biomet/73.1.13 [7] Little, R.J. and Rubin, D.B. (2014) Statistical Analysis with Missing Data. John Wiley
& Sons, Hoboken.
[8] Robins, J.M., Rotnitzky, A. and Zhao, L.P. (1995) Analysis of Semiparametric Re-gression Models for Repeated Outcomes in the Presence of Missing Data. Journal of
the American Statistical Association, 90, 106-121.
https://doi.org/10.1080/01621459.1995.10476493
[9] Tsiatis, A. (2007) Semiparametric Theory and Missing Data. Springer Science & Business Media, New York.
[10] Aluko Omololu, S. and Mwambi, H. (2017) A Comparison of Three Different En-hancements of the Generalized Estimating Equations Method in Handling Incom-plete Longitudinal Binary Outcome. Global Journal of Pure and Applied
Mathe-matics, 13, 7669-7688.
[11] Bang, H. and Robins, J.M. (2005) Doubly Robust Estimation in Missing Data and Causal Inference Models. Biometrics, 61, 962-973.
https://doi.org/10.1111/j.1541-0420.2005.00377.x
[12] Chen, B. and Zhou, X.-H. (2011) Doubly Robust Estimates for Binary Longitudinal Data Analysis with Missing Response and Missing Covariates. Biometrics, 67, 830-842. https://doi.org/10.1111/j.1541-0420.2010.01541.x
[13] da Silva, J.L.P., Colosimo, E.A. and Demarqui, F.N. (2015) Doubly Robust-Based Generalized Estimating Equations for the Analysis of Longitudinal Ordinal Missing Data. arXiv preprint arXiv:1506.04451.
[14] Toledano, A.Y. and Gatsonis, C. (1999) Generalized Estimating Equations for Or-dinal Categorical Data: Arbitrary Patterns of Missing Responses and Missingness in a Key Covariate. Biometrics, 55, 488-496.
https://doi.org/10.1111/j.0006-341X.1999.00488.x
[15] Donneau, A.F., Mauer, M., Molenberghs, G. and Albert, A. (2015) A Simulation Study Comparing Multiple Imputation Methods for Incomplete Longitudinal Ordinal Data. Communications in Statistics-Simulation and Computation, 44, 1311-1338.
https://doi.org/10.1080/03610918.2013.818690
[16] Kombo, A.Y., Mwambi, H. and Molenberghs, G. (2017) Multiple Imputation for Ordinal Longitudinal Data with Monotone Missing Data Patterns. Journal of
Ap-plied Statistics, 44, 270-287.https://doi.org/10.1080/02664763.2016.1168370
[17] Agresti, A. (1989) Tutorial on Modeling Ordered Categorical Response Data.
Psy-chological Bulletin, 105, 290.https://doi.org/10.1037/0033-2909.105.2.290
[18] Lui, I. and Agresti, A. (2005) The Analysis of Ordered Categorical Data: An Over-view and a Survey of Recent Developments. Test, 14, 1-73.
https://doi.org/10.1007/BF02595397
[19] McCullagh, P. (1980) Regression Models for Ordinal Data. Journal of the Royal Sta-tistical Society. Series B (Methodological), 42, 109-142.
DOI: 10.4236/ojs.2018.85051 791 Open Journal of Statistics
Journal, 10, 124.https://doi.org/10.1186/1475-2891-10-124
[21] Bender, R. and Grouven, U. (1998) Using Binary Logistic Regression Models for Ordinal Data with Non-Proportional Odds. Journal of Clinical Epidemiology, 51, 809-816.https://doi.org/10.1016/S0895-4356(98)00066-3
[22] Wedderburn, R.W. (1974) Quasi-Likelihood Functions, Generalized Linear Models, and the Gauss-Newton Method. Biometrika, 61, 439-447.
[23] McCullagh, P. and Nelder, J.A. (1989) Generalized Linear Models. No. 37 in Mono-graph on Statistics and Applied Probability, Chapman & Hall, London.
[24] Lipsitz, S.R., Kim, K. and Zhao, L. (1994) Analysis of Repeated Categorical Data Using Generalized Estimating Equations. Statistics in Medicine, 13, 1149-1163.
https://doi.org/10.1002/sim.4780131106
[25] Touloumis, A., Agresti, A. and Kateri, M. (2013) GEE for Multinomial Responses Using a Local Odds Ratios Parameterization. Biometrics, 69, 633-640.
https://doi.org/10.1111/biom.12054
[26] Schafer, J.L. (2003) Multiple Imputation in Multivariate Problems When the Impu-tation and Analysis Models Differ. Statistica Neerlandica, 57, 19-35.
https://doi.org/10.1111/1467-9574.00218
[27] Beunckens, C., Sotto, C. and Molenberghs, G. (2008) A Simulation Study Compar-ing Weighted EstimatCompar-ing Equations with Multiple Imputation Based EstimatCompar-ing Equations for Longitudinal Binary Data. Computational Statistics & Data Analysis, 52, 1533-1548.https://doi.org/10.1016/j.csda.2007.04.020
[28] Satty, A., Mwambi, H. and Molenberghs, G. (2015) Different Methods for Handling Incomplete Longitudinal Binary Outcome Due to Missing at Random Dropout.
Sta-tistical Methodology, 24, 12-27.https://doi.org/10.1016/j.stamet.2014.10.002
[29] Xie, F. and Paik, M.C. (1997) Multiple Imputation Methods for the Missing Cova-riates in Generalized Estimating Equation. Biometrics, 53, 1538-1546.
https://doi.org/10.2307/2533521
[30] Moleberghs, G. and Verbeke, G. (2005) Models for Discrete Longitudinal Data. Springer, Berlin.
[31] Scharfstein, D.O., Rotnitzky, A. and Robins, J.M. (1999) Adjusting for Nonignora-ble Drop-Out Using Semiparametric Nonresponse Models. Journal of the American Statistical Association, 94, 1096-1120.
https://doi.org/10.1080/01621459.1999.10473862
[32] Touloumis, A. (2016) Simulating Correlated Binary and Multinomial Responses under Marginal Model Specification: The SimCorMultRes Package. The R Journal, 8, 79-91. https://journal.r-project.org/archive/2016/RJ-2016-034/index.html [33] R Core Team (2013) R: A Language and Environment for Statistical Computing. R
Foundation for Statistical Computing. http://www.R-project.org/
[34] Collins, L.M., Schafer, J.L. and Kam, C.-M. (2001) A Comparison of Inclusive and Restrictive Strategies in Modern Missing Data Procedures. Psychological Methods, 6, 330-351.https://doi.org/10.1037/1082-989X.6.4.330
[35] Burton, A., Altman, D.G., Royston, P. and Holder, R.L. (2006) The Design of Simu-lation Studies in Medical Statistics. Statistics in Medicine, 25, 4279-4292.
https://doi.org/10.1002/sim.2673
[36] Schafer, J.L. and Graham, J.W. (2002) Missing Data: Our View of the State of the Art. Psychological Methods, 7, 147-177.https://doi.org/10.1037/1082-989X.7.2.147
DOI: 10.4236/ojs.2018.85051 792 Open Journal of Statistics Fully Conditional Specification. Statistical Methods in Medical Research, 16, 219-242.https://doi.org/10.1177/0962280206074463
[38] Pawitan, Y. (2001) In All Likelihood: Statistical Modelling and Inference Using Li-kelihood. Oxford University Press, Oxford.
[39] Hogan, J.W., Roy, J. and Korkontzelou, C. (2004) Handling Drop-Out in Longitu-dinal Studies. Statistics in Medicine, 23, 1455-1497.
https://doi.org/10.1002/sim.1728
[40] Dong, Y. and Peng, C.-Y.J. (2013) Principled Missing Data Methods for Research-ers. SpringerPlus, 2, 222.https://doi.org/10.1186/2193-1801-2-222
[41] Jolani, S., Van Buuren, S. and Frank, L.E. (2013) Combining the Complete-Data and Nonresponse Models for Drawing Imputations under MAR. Journal of Statistical
Computation and Simulation, 83, 868-879.
https://doi.org/10.1080/00949655.2011.639773
[42] Rotnitzky, A., Robins, J.M. and Scharfstein, D.O. (1998) Semiparametric Regression for Repeated Outcomes with Nonignorable Nonresponse. Journal of the American Statistical Association, 93, 1321-1339.
https://doi.org/10.1080/01621459.1998.10473795