Device-Dependent Readability for Improved Text Understanding
A-Yeong Kim
Hyun-Je Song
Seong-Bae Park
Sang-Jo Lee
School of Computer Science and Engineering
Kyungpook National University
Daegu, 702-701, Korea
{
aykim,hjsong,sbpark
}
@sejong.knu.ac.kr, [email protected]
Abstract
Readability is used to provide users with high-quality service in text recommendation or text visualization. With the increasing use of hand-held devices, reading device is regarded as an important factor for readability. There-fore, this paper investigates the relationship between readability and reading devices such as a smart phone, a tablet, and paper. We sug-gest readability factors that are strongly related with the readability of a specific device by showing the correlations between various fac-tors in each device and human-rated readabil-ity. Our experimental results show that each device has its own readability characteristics, and thus different weights should be imposed on readability factors according to the device type. In order to prove the usefulness of the results, we apply the device-dependent read-ability to news article recommendation.
1 Introduction
Readability is a function that maps a given text into a readability score by considering “how easily the text is read and understood” (Richards et al., 1992; Zamanian and Heydari, 2012). Normally, the readability score is formulated as a combination of various factors. These factors reflect the easiness and understanding of the text and include text presentation format, font size, av-erage ratio of annotated images, and sentence length (Hasegawa et al., 2008; Kitson, 1927; Ma et al., 2012; ¨Oquist, 2006). Therefore, readability can be used to provide satisfiable services in text recommendation or text visualization.
The study on readability has begun in the education field to measure the level of a text. With the success of using readability in education (Franc¸ois and Fairon, 2012; Heilman et al., 2008; Ma et al., 2012), read-ability has been used in a range of domains recently. For example, in document retrieval, readability is used to provide documents to non-expert users so that they can read the retrieved documents easily (Jameel et al., 2012; Yan et al., 2006). In text mining, readability has been employed to analyze the characteristics of text. Especially, Hillbom showed the differences in
readabil-ity between broadsheet newspapers and tabloids that share a similar political stance (Hillbom, 2009).
There is one important issue of readability that has not been studied in natural language processing. It is a reading device. That is, previous studies focused only on text printed on paper. However, with the increasing use of hand-held devices, people in these days use var-ious reading devices such as a tablet and a smart phone as well as a paper. Readability score can be different according to the device type, because each device has its own idiosyncrasy. For example, assume that a sys-tem recommends the same news article to both user A who reads it in her smart phone and user B who reads it on paper. Although both users read the same article, user A might believe that her article is more difficult to read than user B because of the screen size of her smart phone.
This paper explores the relationship between reading devices and readability. For this purpose, we first inves-tigate whether readability changes according to device type or not. Then, we analyze which readability fac-tors are affected by reading devices. To see the rela-tionship between readability factors and devices, var-ious well-known readability factors are computed for news articles collected from an Internet portal. At the same time, the readability of each article is also man-ually rated. When the readability is rated manman-ually, it is done three times for different reading devices of a smart phone, a tablet, and paper. The factors that af-fect the readability actually in each device are found out through the correlations between the factors and the manually-labeled readability. Some factors are impor-tant to the readability of smart phone, but insignificant to that of paper. Therefore, we discover the importance of each readability factor for each device by analyzing the correlations.
The usefulness of the device-dependent readability is proven by applying it to news article recommenda-tion. That is, different importance weights for read-ability factors are considered according to device type when recommending news articles. Our experimental results show that the performance of news article rec-ommendation gets best when the device used for read-ing news articles is identical to the device used for mea-suring readability. Therefore, it is essential to consider different importance weights according to device type
in news article recommendation. It also proves that the proposed device-dependent readability reflects the characteristics of reading devices well.
The rest of this paper is organized as follows. We first review related studies on readability. Next, we introduce various readability factors and propose the device-dependent readability. Then, the news article recommendation using the device-dependent readabil-ity is explained. This recommendation is prepared to prove the usefulness of the device-dependent readabil-ity. In the experiments, we present the experimental results on the relationship between reading devices and readability. We also describe the experiments on news recommendation using the device-dependent readabil-ity and present their results. Finally, we summarize our research.
2 Related work
The history of readability studies began in the 1800s. Early studies focused on the frequency of easy words, sentence length, and word length (Huld´en, 2004). Flesch designed a formula to calculate “reading ease” using only the average word length and sentence length (Flesch, 1948). He adjusted the relative importance between word length and sentence length using 100 words selected randomly from a corpus. This formula is called the Flesch-Kincaid formula, and is generally used in measuring the readability of a textbook (Kin-caid et al., 1975). Dale and Chall (1949) defined a list of 3,000 easy words. Then, they used the average sen-tence length and the percentage of words not included in the list. These studies simply used superficial fac-tors, and thus do not reflect syntactic factors.
Recent studies on readability use various factors in-cluding syntactic ones, and combine them to produce a highly predictive model of readability. Franc¸ois and Faircon (2012) proposed a readability formula with 46 textual factors for French as a foreign language. The factors represent lexical, syntactic, and semantic char-acteristics of sentences, and the specificities of French. They are extracted from 28 French Foreign Language (FFL) textbooks written for adults learning FFL. On the other hand, Pitler and Nenkova (2008) showed the rela-tion between readability factors and readability. They used human ratings from the Wall Street Journal cor-pus, and computed the correlations between the read-ability factors and the average human ratings. Accord-ing to their results, the average number of verb phrases in a sentence, the number of words in an article, the likelihood of the vocabulary, and the likelihood of the discourse relations are highly correlated with human ratings. However, these studies did not consider the reading devices, but focused on how well a text is writ-ten. Since the readability can be differentiated accord-ing to readaccord-ing device, a readaccord-ing device should be con-sidered when computing the readability of a given text. To the best of our knowledge, there are few studies on the readability on mobile devices that do not
con-sider language-related aspects. Most studies on mobile devices focused on the development of new text format and layout to help users read documents easily. ¨Oquist (2006) proposed a new text presentation format called the dynamic Rapid Serial Visual Presentation. Accord-ing to his experimental results, this format helps to re-duce eye movements. On the other hand, Hasegawa et al. (2008) evaluated the readability of documents on mobile devices with regard to screen and font size. They reported that the readability is improved when the characters are vertically enlarged. Readability on mo-bile devices is not reflected only by the visualization factors, but also by textual factors. Therefore, this pa-per explores the readability factors that reflect the lexi-cal and grammatilexi-cal complexity of text and are affected by reading devices.
3 Readability Factors
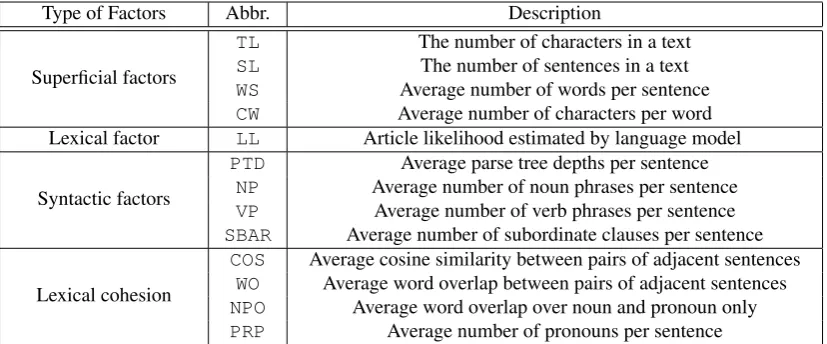
Table 1 lists the readability factors used in this paper. Basically, they are based on the factors proposed by Pitler and Nenkova (2008). However, some factors are excluded and some new factors are added. This is be-cause some of their factors are computationally infeasi-ble and language-dependent. As a result, we have thir-teen readability factors. These readability factors are divided into four types: superficial, lexical, syntactic factors, and lexical cohesion.
3.1 Superficial Factors
Superficial factors were used in most early readability studies (Dale and Chall, 1949; Flesch, 1948; Kincaid et al., 1975), and reflect the construction of a text. We in-vestigate four factors: text length (TL), sentence length (SL), average number of words per sentence (WS), and average number of characters per word (CW). Since longer text is perceived as “harder-to-read” than short one, these factors are all reciprocally related with read-ability.
The first two factors are related to length.TLcounts the number of characters in a text, whereasSL com-putes the number of sentences. When a writer attempts to write many topics in a text, she tends to use many kinds of words simultaneously. As a result, the text be-comes longer and more complex. Such long length of text disturbs a reader’s comprehension of the text, and then it is more difficult for the reader to read the text (Heilman et al., 2008).
Type of Factors Abbr. Description
Superficial factors
TL The number of characters in a text
SL The number of sentences in a text
WS Average number of words per sentence
CW Average number of characters per word Lexical factor LL Article likelihood estimated by language model
Syntactic factors
PTD Average parse tree depths per sentence
NP Average number of noun phrases per sentence
VP Average number of verb phrases per sentence
SBAR Average number of subordinate clauses per sentence
Lexical cohesion
COS Average cosine similarity between pairs of adjacent sentences
WO Average word overlap between pairs of adjacent sentences
NPO Average word overlap over noun and pronoun only
[image:3.595.93.507.62.234.2]PRP Average number of pronouns per sentence
Table 1: Description of readability factors
One is “Daehanminguk” meaning Korea and the other is “Jungboo” meaning a government. The two are con-catenated to form a compound noun and become a long single word. In addition, many difficult words such as domain-specific terms tend to be long. Such lengthy words make it difficult to read a text.
3.2 Lexical Factor
Lexical factor determines whether a given text con-sists of frequent words. Texts that express a new trend in various fields often use many newly coined words. Such neologisms make it difficult to read and under-stand a text. Therefore, an easily-underunder-standable text is composed of widely-used words rather than unusual words.
In order to compute the use of frequent words in a text, a unigram language model is used as in the work of Pitler and Nenkova (2008). In this model, the log likelihood of texttis computed by
X
w∈t
C(w)·logP(w|B). (1)
whereP(w|B)is the probability of a wordwaccording to a background corpusB, andC(w)is the number of times thatwappears int.
This factor examines the familiarity of the words used in the text. The more frequently a word appears in the background corpus, the more familiar it is re-garded. The frequency of a wordw is then reflected into P(w|B) computed from the independent back-ground corpusB. Therefore, the factorLLis positively related with readability.
3.3 Syntactic Factors
Syntactic factors reflect sentence complexity directly that affects human processing of a sentence. We con-sider the average parse tree depth per sentence (PTD), the average number of noun phrases per sentence (NP), the average number of verb phrases per sentence (VP), and the average number of subordinate clauses per
sen-tence (SBAR) as syntactic factors. These four factors were defined by Schwarm and Ostendorf (2005).
A reader regards a text as difficult when the sen-tences in the text have large parse tree depths or many subordinate clauses. Thus,PTDandSBARare related negatively with readability. On the other hand, the re-lationship ofNPandVPto readability are not one way. The large number of noun phrases in a text requires a reader to remember more items (Barzilay and Lap-ata, 2008; Pitler and Nenkova, 2008). However, it also makes the text more interesting. The texts written for adults actually contain more entities than those writ-ten for children (Barzilay and Lapata, 2008). The same is true forVP. The large number of verb phrases in a sentence makes the sentence more complex. However, people feel that a text is more easier to comprehend when related clauses are grouped together (Bailin and Grafstein, 2001).
3.4 Lexical Cohesion
Lexical cohesion denotes how the sentences in a text are semantically connected. People usually bring con-tinuous sentences into their mind at the same time, and interpret them as a single unit (Okazaki et al., 2005). In other words, a reader prefers text whose sentences are smoothly connected to text whose sentences are inde-pendent of one another. Therefore, sentence continuity plays a primary role in understanding an entire text.
3.5 Measurement of Readability
When a reading device d is given, the readability of textt, represented asR(t|d), is formulated as a com-bination of readability factors with their corresponding weight in the device. We assume thatwi|d, the weight
of a readability factorfi, is dependent on the reading
deviced. Following the previous work of Pitler and Nenkova (2008), we also assume that each readabil-ity factor affects readabilreadabil-ity independently. Therefore, readability is calculated as a weighted linear sum of all readability factors. That is,R(t|d)is computed by
R(t|d) = X i∈{1,2,...,M}
wi|d·fi(t) (2)
whereM is the number of readability factors.
Each weightwi|d is determined from a set of news
articlesT. We collected a large number of news arti-cles from an Internet news portal. The readability of each article was manually labeled. This is done three times, since we have three different devices of a smart phone, a tablet, and paper. Since human rating of each article t ∈ T is available for each device, wi|d’s can
be estimated by linear regression. These weights are different according to the devices.
4 News Article Recommendation by
Device-Dependent Readability
The fact that the weightswi|din Equation (2) are
differ-ent for each devicedimplies that the readability mea-surement should be different depending on the device type. In order to see the usefulness of this device-dependent readability, we apply it to news article rec-ommendation. News article recommendation aims to provide a user with news articles that interest the user. Thus, it selects a few articles that meet user preference from a gigantic amount of news events. Various meth-ods have reported notable results in news article rec-ommendation (Das et al., 2007; Li et al., 2010; Liu et al., 2010). In addition, with the recent interest in hand-held devices, the demand for news recommendation on hand-held devices is increasing. However, there has been, at least as far as we know, no study on the read-ability of hand-held devices.
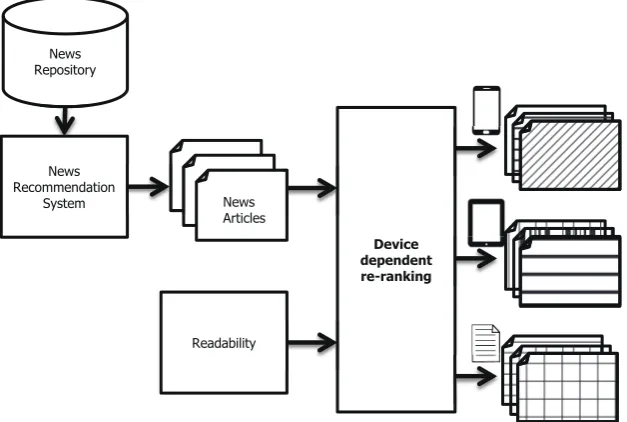
Device-dependent readability is reflected into news article recommendation through a re-ranking frame-work. Figure 1 depicts the overall process of suggest-ing news articles for a specific device with the device-dependent readability. The point of this figure is to measure how appropriate a news article is for a spe-cific reading device. For this, a news recommendation system first chooses a set of news articles from a news repository based on its own criterion. Then, we re-rank them by the device-dependent readability to obtain the final set of ranked news articles for the device.
Formally, a news article recommendation ranks a set of articles,A={a1, a2, ..., am}, whereai represents
thei-th article. The order between ranksa1 a2
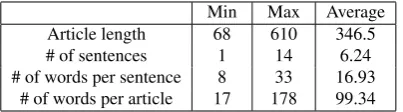
Min Max Average Article length 68 610 346.5
# of sentences 1 14 6.24
[image:4.595.317.519.62.118.2]# of words per sentence 8 33 16.93 # of words per article 17 178 99.34
Table 2: Statistics of the news article data
... am should be satisfied by the criterion of the
recommendation system. That is, assuming that the system has a score function score(ai), score(ai) > score(aj)has to be met if ai aj. Then, the top
k(k≤m)articles ofAby the score function are sug-gested as appropriate news articles. After that, the se-lected articles are re-ranked by another criterion, the device-dependent readability. That is, the final rank of an article within the selected set is determined by an-other function,rerank. Since this function has to re-flect the device-dependent readability, it takes two pa-rameters. One is an article, and the other is a device type. The re-rank function is modeled as
rerank(a, d) = R(a|d)
= X
i∈{1,2,...,M}
wi|d·fi(a). (3)
As a result, the readability-based re-ranking module suggests the news articles based on how easily the ar-ticles are read on a specific reading device. Note that even the same article would be ranked differently ac-cording to the device type because the article is re-ranked by the device-dependent readability. At last, the topk∗(k∗≤k)re-ranked articles among them are sug-gested as final news articles.
5 Experiments
5.1 Experiments on Readability Factors 5.1.1 Experiment Settings
For the experiments of analyzing relationship between readability factors and readability, we collected a Ko-rean news corpus from Naver News1. This corpus
con-tains news articles from June 10, 2013 to June 25, 2013. We selected 74 articles randomly from the cor-pus which were used for readability formula and show-ing the relationships between readability factors. All selected articles belong to one of three categories: ‘Pol-itics’, ‘Entertainment’, and ‘Sports’. A set of these 74 news articles becomesT, and is used to compute the weights in Equation (2). Table 2 describes a simple statistics of the selected news articles. The shortest ar-ticle consists of 68 characters, whereas the longest one has 610 characters. The average length of article is 346.5. The shortest article is written in one sentence, and the longest has 14 sentences. One article has ap-proximately 6.24 sentences on average. In addition, the
1A Korean news portal of which web address is
News Repository
Device dependent re-ranking News
Articles News
Recommendation System
[image:5.595.143.457.65.276.2]Readability
Figure 1: Overall process of re-ranking news articles based on device-dependent readability
number of words per sentence ranges from 8 to 33, and the average is 16.93. The minimum number of words in an article is 17, and the maximum number of words is 178. An article is composed of 99.34 words on aver-age.
In order to compute the lexical factorLLby Equa-tion (1), a background corpusBis required. Since this corpus should be independent from the news articles explained above, the Naver News is adopted again to generate B. For the background corpus B, we col-lected news articles from January 1, 2013 to September 6, 2013, but excluded the articles from June 10 to June 25, because they are already used. This corpus consists of 298,729 articles with 3,264,104 distinct words.
The readability score for each article was manually labeled by three undergraduate students. To investigate the relationship between reading devices and readabil-ity, each article was read using three different reading devices. The Galaxy Note 1 with a 5-inch screen is used as the smart phone, Galaxy Tab 10.1 with a 10.1-inch screen is used as the tablet, and A4-size paper is used for the paper. That is, the human annotators read and rated 74 articles per device. The order of the devices where the annotators evaluated readability is smart phone, tablet, and paper. This order was main-tained for all the experiments. All aspects but content texts were under control. For instance, font = “Gothic, 12 pt” (this is most commonly used font and size that most Korean web pages and textbooks use), font color = “black”, alignment = “both” were used for all three devices. In addition, the non-content aspects were ex-actly same for devices because the annotators of ability and the recommended articles shared the read-ing devices. Although these aspects affect readability and many previous studies already proved it, it is not our concern. We only attempt to capture how
read-Reading device Min Max Average Smart phone 1.67 5 3.423±0.741
Tablet 1.33 5 3.531±0.837
Paper 2 5 3.360±0.594
Table 3: Readability scores given by human annotators
ability is affected by the content in different types of devices.
Human annotators can remember the content of news articles when they read articles with three de-vices. The human annotators were asked to read and evaluate many articles within a relatively short period. Therefore, before the main experiments, we performed a pilot experiment on the memory effects of previously read articles and verified it empirically. We hired three undergraduate students who were not involved in our main experiments. The students read the same 250 ar-ticles four times, and these also come from Naver News corpus which are not included the previous 74 articles. After their first reading, they read the articles again in 3, 7, and 14 days later. After 3 days, two students membered the articles somewhat, but one student re-membered them vaguely. Since they almost forgot the articles after 7 days, we placed 7 days interval between devices.
Smart phone Tablet Paper Factor Value Factor Value Factor Value
SL -0.394 SL -0.370 NP 0.298
TL -0.293 WS 0.321 WS 0.278
WS 0.288 LL 0.253 LL 0.268
LL 0.249 NP 0.240 VP 0.244
Table 4: Pearson correlation coefficients of important readability factors
reason, four questions can be summarized in two ques-tions. The two questions used are
• How well-written is this article?
• How interesting is this article?
For these two questions, each annotator assigns a score between 1 and 5 to each article. Here, 1 point means that the article is worst and 5 point implies that it is best. A readability score of one human annotator is composed with the average of two questions (well-written, interesting). We used the average of three hu-man annotators’ readability scores in our experiments. Table 3 shows the readability scores of the articles for each device. According to this table, the readability score ranges from 1.67 to 5 for the smart phone, 1.33 to 5 for the tablet, and ranges from 2 to 5 for the paper. The average readability is 3.423 for the smart phone, 3.531 for the tablet, and 3.360 for the paper. To see the inter-judge agreement among annotators, the Kappa coefficient (Fleiss, 1971) is used. The Kappa values for the ‘smart phone’, ‘tablet’, and ‘paper’ are 0.342, 0.333, and 0.361, respectively. All these values corre-spond tofair agreement.
5.1.2 Experimental Results
In order to see the importance of each factor in a spe-cific device, we adopt the Pearson correlation coeffi-cients between readability factors and reading devices. Table 4 lists the four most important factors in each device and their Pearson correlation coefficients. Espe-cially,p-value is smaller than 0.05 for all factors in this table.
For the smart phone,SL, the number of sentences in a text, is the most important readability factor. Its cor-relation with the smart phone is -0.394.TL, the number of characters, is the second important factor and has a negative correlation of -0.293. These results imply that readers are negatively sensitive to the length of an arti-cle because of the small display size of a smart phone. That is, in the smart phone, longer articles are recog-nized as difficult to read compared to shorter ones. The number of words per sentence,WS, is the third impor-tant factor with correlation of 0.288. The log-likelihood of an article,LL, is also positively related with the read-ability, which proves that widely-used words make it easy to understand an article. The top three factors are superficial with regard to text length. Therefore, the su-perficial factors are more important than other types of factors for the smart phone.
SLis the most critical readability factor even for the tablet. It affects readability with high correlation of -0.370. The second important factor isWSwith correla-tion of 0.321. Both of these factors are superfical. The third important factor, LL, is positively related with readability as expected. The fourth factor that affects readability is the number of noun phrases,NP. It is nat-ural forNPto be positively related with the readability. Finally, for the paper,NPis most strongly related to readability with correlation of 0.298. The second im-portant factor isWS, whose correlation is 0.278. LLis the third important factor and shows a positive relation-ship. Note that WSandLL are important readability factors for all devices. The next important readabil-ity factor for the paper is the average number of verb phrases (VP). The articles with many noun phrases and verb phrases are perceived as easier-to-read for the pa-per. Note that the importance of superficial factors is limited for the paper. We expected thatWSis negatively related, but, it is positively related with readability for all three devices. The reason for this could be that the annotators thought the articles with higherWSare more interesting.
The important factors for the smart phone are differ-ent from those for the paper. On the other hand, the tablet shares many factors with both the smart phone and the paper. Because the screen size of a tablet is similar to the size of an A4 paper, the tablet and the pa-per share readability factors. However, length-related factors play a more important role than syntactic fac-tors in the smart phone because a smart phone has a smaller screen.
5.2 Experiments on News Recommendation 5.2.1 Experiment Settings
Experiments for news article recommendation were performed to see the effectiveness of device-dependent readability. The process of news recommendation with device-dependent readability is as follows. For a spe-cific device,
1. Select top-knews articles from a news repository by the criterion of the recommendation system. 2. Re-rank thekarticles by the readability of the
de-vice using Equation (3).
3. Select top-k∗news articles by the new rank. 4. Human annotators read and rate the k∗ articles
with the device.
5. Compare the ranks of k∗ articles by device-dependent readability with those by human rat-ings.
Since we have three types of devices, this process is performed three times with a different device.
Min Max Average Article length 277 6,077 990.68 # of sentences 4 199 22.85 # of words per sentence 4 100 15.73 # of words per article 71 2,034 301.61
Table 5: Statistics of news data for recommendation
Reading device Min Max Average Smart phone 1 5 3.513±0.962
Tablet 1 5 3.344±0.852
[image:7.595.310.518.74.232.2]Paper 1 5 3.250±0.907
Table 6: Scores of news articles by human annotators in news recommendation
used as the news repository. The number of times that a news article was actually read by its anonymous read-ers at the portal site is used as the criterion for the rec-ommendation system. Since this criterion is provided on a daily basis and news articles were collected for three days, the process explained above is performed three times. The top twenty articles were selected by the criterion every day. That is,k= 20. Table 5 shows the statistics of the total 60 articles. The shortest arti-cle consists of 277 characters, and the longest artiarti-cle has 6,077 characters. On average, an article is writ-ten with 990.68 characters. The minimum number of sentences in an article is 4, and the maximum number of sentences is 199. An article is composed of 22.85 sentences on average. The average number of words in a sentence is 15.73, whereas a sentence length ranges from 4 to 100 words. The shortest article has 71 words, and the longest article has 2,034 words. One article has approximately 301.61 words on average.
[image:7.595.308.519.301.458.2]Three human annotators labeled the scores of the news articles manually. The annotators were the same persons who labeled the readability scores. Similar to the previous experiments, 7 days intervals was placed among devices to reduce the memory effect. The same two questions used in the previous section were used again for this experiment. The annotators assigned a score between 1 and 5 to every article for each ques-tion. The final score of an article was obtained by aver-aging six scores (two questions from three annotators). Table 6 summarizes the scores of the articles by the human annotators. As shown in this table, the article scores vary for all reading devices. The average scores for smart phone, tablet, and paper are 3.513, 3.344, and 3.250 respectively. The Kappa value for the ‘smart phone’ is 0.402, and that for both the ‘tablet’ and the ‘paper’ is 0.393. Thus, the value of ‘smart phone’ falls intomoderate agreement, whereas those of the ‘tablet’ and ‘paper’ correspond tofair agreement. The perfor-mance of the news article recommendation is evaluated with the Normalized Discounted Cumulative Gain at topP(NDCG@P) (J¨arvelin and Kek¨al¨ainen, 2002).
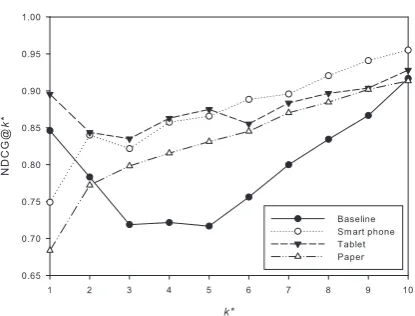
Figure 2: NDCG@k∗ scores with variousk∗ for the smart phone.
Figure 3: NDCG@k∗ scores with variousk∗ for the tablet.
5.2.2 Experimental Results
For the a baseline criterion, we use the news article recommendation system in Naver, which recommends news article by the number of article hits. Figures 2 to 4 show the NDCG@k∗scores with1 ≤k∗≤10for the three devices. Each graph in these figures compares the performance of various devices when the readability for a specific device is used. That is, Figure 2 depicts the NDCG@k∗scores for the recommended news arti-cles when the artiarti-cles are shown in the smart phone, the tablet, and the paper respectively. In computing their NDCG@k∗ scores, the news articles are re-ranked by readability for the smart phone. Therefore, in this fig-ure we expect that the NDCG@k∗score for using the smart phone is higher than those for using the tablet and paper. In the same way, Figure 3 and Figure 4 compare the NDCG@k∗ scores when the readabilities for the tablet and paper are used.
Figure 4: NDCG@k∗ scores with variousk∗ for the paper.
news articles is the same as the device used for read-ability. In Figure 2, the use of the smart phone outper-forms those of other devices whenk∗≥6. This proves that the quality of highly ranked news articles is much better for the smart phone than for other devices, when the readability for smart phone is used.
Figure 3 shows the NDCG@k∗scores for using var-ious devices when the news articles are re-ranked by readability for the tablet. In this figure, the use of the tablet as a reading device is better than using the smart phone or the paper. The performance difference is largest atk∗ = 3. The difference becomes smaller ask∗increases up to 10, but the performance of tablet is still higher than those of others. In Figure 2 and 3, whenk∗ = 1, the baseline outperforms other devices. We believe this happens because the baseline chooses news articles by user-hit. Therefore, many articles rec-ommended by the baseline are interesting because peo-ple tend to click more often when an article is inter-esting. As noted, readability reflects users’ interests, which leads to high performance of the baseline. The performance of paper is best in Figure 4, since the ar-ticles are re-ranked by the readability for paper. Paper outperforms all other devices for allk∗s. Note that the performances of the baseline are always lowest regard-less of reading device.
From all results above, we can infer that the use of device-dependent readability is helpful to news article recommendation. This is because the readability fac-tors that affect the readers of news articles are different according to the reading device. Therefore, it is im-portant to reflect the characteristics of a reading device when recommending news articles.
6 Conclusion
In this paper, we have proposed a device-dependent readability. Since a reading device is one of the most important features of readability, different weights have
been assigned to the readability factors according to de-vice type. We have shown that the important readabil-ity factors are distinct according to the reading device by investigating the correlation between the readability factors and the reading device. Through the correlation, we found that tablet shares many important factors with both smart phone and paper.
The experiments on the news articles collected from an Internet portal proved that readability is actually af-fected by the reading device. In addition, the validity of the device-dependent readability was shown by apply-ing it to the news article recommendation. The news articles were first ranked by the criterion of the recom-mendation system. Then, they were re-ranked by the device-dependent readability. Our experiments showed that the recommendation performance of the re-ranked articles gets best when the device used for readability is the same as the reading device. These two types of ex-periments proved the importance and effectiveness of the device-dependent readability.
Acknowledgments
This work was supported by the IT R&D program of MSIP/KEIT (10044494, WiseKB: Big data based self-evolving knowledge base and reasoning platform) and the Industrial Strategic Technology Development Pro-gram (10035348, Development of a Cognitive Planning and Learning Model for Mobile Platforms) funded by the Ministry of Knowledge Economy(MKE, Korea).
References
Alan Bailin and Ann Grafstein. 2001. The linguistic assumptions underlying readability formulae: A cri-tique.Language & Communication, 21(3):285–301. Regina Barzilay and Mirella Lapata. 2008. Modeling local coherence: An entity-based approach. Compu-tational Linguistics, 34(1):1–34.
Edgar Dale and Jeanne Chall. 1949. The concept of readability.Elementary English, 26(1):19–26. Abhinandan Das, Mayur Datar, Ashutosh Garg, and
Shyam Rajaram. 2007. Google news personaliza-tion: scalable online collaborative filtering. In Pro-ceedings of the 16th International Conference on World Wide Web, pages 271–280.
Joseph Fleiss. 1971. Measuring nominal scale agree-ment among many raters. Psychological bulletin, 76(5):378–382.
Rudolph Flesch. 1948. A new readability yardstick. Journal of Applied Psychology, 32(3):221–233. Thomas Franc¸ois and C´edrick Fairon. 2012. An
Michael Halliday and Ruqaiya Hasan. 1976.Cohesion in English. Longman Group Ltd.
Satoshi Hasegawa, Kazuhiro Fujikake, Masako Omori, and Masaru Miyao. 2008. Readability of charac-ters on mobile phone liquid crystal displays. In-ternational Journal of Occupational Safety and Er-gonomics (JOSE), 14(3):293–304.
Michael Heilman, Kevyn Collins-Thompson, and Maxine Eskenazi. 2008. An analysis of statistical models and features for reading difficulty prediction. InProceedings of the Third Workshop on Innovative Use of NLP for Building Educational Applications, pages 71–79.
Kristina Hillbom. 2009. Newspaper Readability: a Broadsheet vs. a Tabloid. Ph.D. thesis, University of G¨avle.
M˚ans Huld´en. 2004. Linguistic complexity in two major american newspapers and the associated press newswire, 1900–2000. Master’s thesis, ˚Abo Akademi University.
Shoaib Jameel, Wai Lam, and Xiaojun Qian. 2012. Ranking text documents based on conceptual dif-ficulty using term embedding and sequential dis-course cohesion. InProceedings of the The 2012 IEEE/WIC/ACM International Joint Conferences on Web Intelligence and Intelligent Agent Technology-Volume 01, pages 145–152.
Kalervo J¨arvelin and Jaana Kek¨al¨ainen. 2002. Cu-mulated gain-based evaluation of IR techniques. ACM Transactions on Information Systems (TOIS), 20(4):422–446.
J. Peter Kincaid, Robert Fishburne Jr., Richard Rogers, and Brad Chissom. 1975. Derivation of new read-ability formulas (automated readread-ability index, fog count and flesch reading ease formula) for navy en-listed personnel. Technical report, DTIC Document. Harry Kitson. 1927. The mind of the buyer.
MacMil-lan Company.
Lihong Li, Wei Chu, John Langford, and Robert E. Schapire. 2010. A contextual-bandit approach to personalized news article recommendation. In Pro-ceedings of the 19th International Conference on World Wide Web, pages 661–670.
Jiahui Liu, Peter Dolan, and Elin R. Pedersen. 2010. Personalized news recommendation based on click behavior. InProceedings of the 15th International Conference on Intelligent User Interfaces, pages 31– 40.
Yi Ma, Eric Fosler-Lussier, and Robert Lofthus. 2012. Ranking-based readability assessment for early pri-mary children’s literature. In Proceedings of the 2012 Conference of the North American Chapter of the Association for Computational Linguistics: Hu-man Language Technologies, pages 548–552.
Naoaki Okazaki, Yutaka Matsuo, and Mitsuru Ishizuka. 2005. Improving chronological ordering of sentences extracted from multiple newspaper ar-ticles. ACM Transactions on Asian Language Infor-mation Processing (TALIP), 4(3):321–339.
Gustav ¨Oquist. 2006. Evaluating readability on mo-bile devices. Ph.D. thesis, Uppsala University. Emily Pitler and Ani Nenkova. 2008. Revisiting
read-ability: A unified framework for predicting text qual-ity. In Proceedings of the Conference on Empiri-cal Methods in Natural Language Processing, pages 186–195.
Jack Richards, John Platt, Heidi Platt, and Christophe Candlin. 1992. Longman Dictionary of Language Teaching and Applied Linguistics, volume 78. Long-man London.
Sarah Schwarm and Mari Ostendorf. 2005. Reading level assessment using support vector machines and statistical language models. InProceedings of the 43rd Annual Meeting on Association for Computa-tional Linguistics, pages 523–530.
Xin Yan, Dawei Song, and Xue Li. 2006. Concept-based document readability in domain specific infor-mation retrieval. InProceedings of the 15th ACM In-ternational Conference on Information and Knowl-edge Management, pages 540–549.