Setvectors for Memory Phase Classification
Michael Zwick, Marko Durkovic, Florian Obermeier and Klaus Diepold
∗Abstract—Phase classification has frequently been discussed the recent years as a method to guide scheduling, compiler optimizations and program sim-ulations. In this paper, we propose a new classifica-tion method calledsetvectors. We show that the new method outperforms classification accuracy of state of the art methods by approximately 6 to 25 percent, while it has comparable computational complexity to the fastest state of the art methods. As a second con-tribution, we introduce a new method called PoEC
(Percentage of Equal Clustering) to objectively com-pare phase classification techniques.
Keywords: Computer systems, cache memory, phase classification
1
Introduction
It is well known that the execution of computer programs shows cyclic, reoccuring behavior over time. In one time interval, a program may get stuck waiting for I/O, in another time interval, it may likely stall on branch mis-prediction or wait for the ALU (Arithmetic Logic Unit) to complete its calculations. These intervals of specific behavior are called phases. Phase classification is the method that analyzes programs and groups program in-tervals of similar behavior to equalphases. [12, 8, 7, 5]
To identify phases, programs are split into intervals of an fixed amount of instructions. Then, these intervals are analyzed by some method to predict its behavior. In-tervals showing similar behavior are grouped together to form a specific class of aphase. Therefore a phase is a set of intervals that show similar behavior while discarding temporal adjacency. The phase information of a program can be used to guide scheduling, compiler optimizations, program simulations, etc.
Several phase classification techniques have been pro-posed the recent years, many of which rely on code met-rics such asbasic block vectors [12] anddynamic branch
counts[3]. Since code related methods only have low
cor-relation with memory hierarchy behavior, several mem-ory related phase classification methods have been pro-posed to predict L1 and L2 cache misses, such aswavelet
based phase classification [5], activity vectors [11] and
stack reuse distances [4].
∗Lehrstuhl f¨ur Datenverarbeitung, Technische Universit¨at
M¨unchen, Arcisstr. 21, 80333 M¨unchen, Germany, {zwick, durkovic, f.obermeier, kldi}@tum.de
In this paper, we propose a new method for phase classifi-cation to predict L2 cache performance calledsetvectors. On the basis of ten SPEC2006 benchmarks, we show that the mean accuracy of our method outperforms the
activ-ity vector method by about 6%, thestack reuse distance
method by about 18% and thewavelet based method by about 24%. Further, we introduce a new metric called
PoEC (Percentage of Equal Clustering) to objectively evaluate different phase classification methods and make them comparable to one another.
The remaining of this paper is organized as follows: Sec-tion 2 describes state of the art phase classificaSec-tion tech-niques, section 3 presents oursetvectormethod, section 4 introducesPoEC as our methodology to evaluate phase classification accuracy, section 5 presents our results and section 6 concludes the paper.
2
Phase Classification Techniques
In this section, we describe state of the art techniques we compared oursetvectormethod to. Since we focus on phase classification for L2 cache performance prediction, we exclusively consider memory based techniques.
All the methods we apply use the same tracefiles com-prised of memory references we gatherd using thepin tool
described in [9], as it has been done in [5]. For cross val-idation, we use our MCCCSim (Multi Core Cache Con-tention Simulator) simulator [14] to obtain the hitrates for each interval. Since we initially started the evalua-tion of our method in comparison to the wavelet tech-nique presented by Huffmire and Sherwood [5], we chose the same interval size of 1 million instructions as they did to make the results better comparable. All methods were evaluated on ten SPEC2006 test benchmarks, each comprised of 512 million instructions.
2.1
Wavelet based Phase Classification
In [5], Huffmire and Sherwood use haar wavelets [13] to perform phase classification.
First, they create 16×16 matrices for each interval of 1 million instructions. Therefore, they split each set of 106 instructions into 20 subsets of 106/20 = 50,000 in-structions forming 20 column vectors. They determine the elements of every such column vector by calculating
and M = 16k the modulo size that has been matched to the L1 cache size. By iterating over each address of the 50k instructions, they fill up the rows of the col-umn vectors by summing up the occurences of each m
(0≤m <400) in a histogram manner. After having cal-culated each of the 20 400×1 column vectors, they scale the resulting 400×20 matrix to a 16×16 matrix using methods from image scaling.
In a second step, they calculate thehaar wavelet trans-form [13] for each 16×16 matrix and weight the coeffi-cients according to [6].
In a third step, they apply the k-means clustering algo-rithm [10] on the scaled wavelet coefficients and compare the clusters with the hitrates of the corresponding inter-vals, gained by a cache simulator.
In our implementation of the wavelet technique, we fol-lowed Huffmire’s and Sherwood’s description except for the following: we split each 106 instructions in 16 inter-vals of 64k instructions each to omit the scaling from 20 to 16 columns and use our MCCCSim [14], that is based on Huffmire’s and Sherwood’s cache simulator anyway. Everything else we implemented as presented in [5].
Since the top-left element of the coefficient matrix corre-sponds to the mean value of the original matrix, we also clustered all top-left elements of the coefficient matrices and compared the results of the clustering process to the L2 hitrates of the corresponding intervals.
As the wavelet transform seems not an obvious choice of algorithm for this problem, yet it achieved good re-sults shown by Huffmire and Sherwood, we decided to replace the wavelet transformation by a SVD (singular value decomposition)M=UΣVTin another experiment to probe if a more general method could find more infor-mation in the data matrix. We clustered both columns and rows ofUandVrespectively but could not find any impressive results, as we will show in Section 5.
2.2
Activity Vectors
In [11], Settle et al. propose to use “activity vectors” for Enhanced SMT (simultaneous multi-threaded) job scheduling. The activity vectors are used like a phase classification technique to classify program behavior with respect to memory hierarchy performance. The activity
vectormethod has been proposed as an “online
classifica-tion method” that relies on a set of on-chip event counters that count memory accesses to so-calledsuper sets.
We implemented the activity vector method in software and applied the same tracefile data that we applied to all our other simulations mentioned in this paper.
To use the activity vector method as a phase classification method, we clustered a) the vectors and b) the length of
each vector and compared the clustering results with the L2 cache performance of the corresponding intervals.
In section 5 we show that the activity vector method on average achieves better results than the wavelet method.
2.3
Stack Reuse Distances
In [1], Beyls and D’Hollander propose to use the “stack reuse distance” as a metric for cache behavior. They define the stack reuse distance of a memory access as “the number of accesses to unique addresses made since the last reference to the requested data” [1].
In section 5 we show that, on average, the classifica-tion performance of the stack reuse distance method lies between the wavelet and the activity vector method, whereas its calculation takes a huge amount of time.
2.4
Other techniques
Although many other techniques for phase classification have been proposed such as basic block vectors [12], lo-cal/global stride [8], working set signatures [2], we omit-ted to compare oursetvectortechnique to those methods since it has been shown that they are outperformed by other methods, for example thewavelet method [5].
3
Setvector based Phase Classification
In this section, we describe our setvector based phase classification method.
The setvectors are as easily derived as they are
effec-tive: For all addresses of an interval and an n-way set-associative cache, determine the number of addresses
with different key that are mapped to the same cache
set.
That means: Given a L2 cache with 32 bit address length that usesb bits to code the byte selection,sbits to code the selection of the cache set andk= 32−s−b bits to code the key that has to be compared to the tags stored in the tag RAM, do the following:
• Extract the set number from the address, e.g. by shifting the address k bits to the left and then unsigned-shifting the result k+b bits to the right.
• Extract the key from the address, e.g. by unsigned-shifting the addresss+b bits to the right.
• In the list for the given set, determine whether the given key is already present.
• If the key is already present, do nothing and process the next address.
More formally written: Starting with a tracefile
T={ai|1≤i≤t}
made up of memory addresses a1...at that are grouped into intervals of a fixed amount of instructions, we split the tracefile into a set of access vectors ai, each
repre-senting an interval of severalai:
T=a1 . . . ac
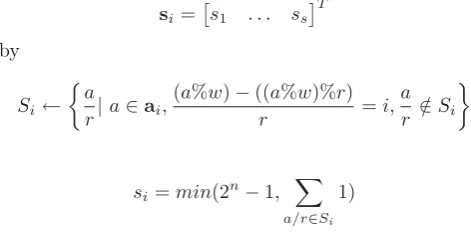
Now, for eachai and caches with a row size ofr byte and a way size ofw byte, we derive the set vector
si=
s1 . . . ss
T
by
Si←
a
r|a∈ai,
(a%w)−((a%w)%r)
r =i,
a r ∈/Si
si =min(2n−1,
a/r∈Si
1)
with ‘%’ representing the modulo operator and n the maximum number of bits allowed to code the set vector elements, if there should be such a size constraint.
This way, each element of a set vector contains for each corresponding interval the number of addresses that be-long to the same cache set, but have a different cache-key – saturated byn, the number of bits at most to be spent for each vector element.
Due to this composition, the setvectors directly represent cache set saturation, a measure that is highly correlated with cache misses.
In section 5, we show that on average, the setvector
method outperforms all methods mentioned in section 2.
4
Metrics to Compare Phase
Classifica-tion Techniques
In [8], Lau et al. define theCoefficient of Variation(CoV) as a metric to measure the effectiveness of phase classifi-cation techniques. CoV measures the standard deviation as percentage of the average and can be calculated by
CoV =
phases
i=1
σi
averagei·intervalsi
total intervals . (1)
Huffmire and Sherwood adapt this metric by omitting the division by the average, resulting in theweighted standard deviation
σweighted=
phases
i=1
σi·intervalsi
total intervals. (2)
Being derived from standard deviation, both CoV and
σweighteddenote better clustering performance by smaller
values. However, theCoV metric (σweightedas well) may describe the standard deviation of the L2 cache perfor-mance in each phase, but not the correlation between L2 cache performance and the different phases, what should be the key evaluation method for phase classification. Therefore, we developed thePoEC (Percentage of Equal Clustering) metric that can be calculated as follows:
Consider the cluster vectorγ as a vector that holds, for each index, the phase of the corresponding 16×16 scaled matrix. In a first step, we sort the elements of the cluster vectorγ according to its phases, such that∀i∈1..indeces:
γi≤γi+1.
In a second step, we calculate the percentage of equal clustering (PoEC) by
P oEC = 2·
min
indeces
i=1 (γh,i==γx,i)
indeces ,0,5
−0,5
(3)
This way, high correlation between L2 cache performance and the cluster vectors result in PoEC values near 1 and low correlation corresponds to values near 0, with 0 ≤
[image:3.595.39.275.275.391.2]P oEC≤1.
Figure 2 shows the difference between those metrics by clustering some SPEC2006 benchmarks in two phases (“good ones” and “bad ones”) using the wavelet method and plotting the phases (each ring corresponds to one interval) against the L2 hitrate of the corresponding in-tervals. As L2 cache hitrates of the same magnitude should be classified into the same class, a good cluster-ing is achieved if one class contains higher hitrates and the other contains lower hitrates, as it is the case for the “milc”, “soplex”, “lbm” and “bzip2” benchmarks.
In Figure 2a), we calculated theCoV value according to formula 1 for each benchmark and arranged the plots ac-cording to theirCoV value. While analyzing Figure 2a), one can observe the following: There are benchmarks that achieve good clustering, such as “soplex”, “milc”, “bizp2” and “lbm”. And there are benchmarks that do not cluster well at all, such as “hmmer”, “libquantum”, “gobmk”. But the point is: The clustering qualitydoes notfit theCoV value the plots are arranged by. Although not plotted in this place, theσweightedmetric shows sim-ilar behavior.
PoEC value. Although the clustering is the same, this time the clustering qualitydoes fit the PoEC value the plots are arranged by.
Therefore we decided to omit both σweighted and CoV and to perform our evaluation using our newPoEC met-ric.
5
Results
In this section we discuss the results gathered from our simulations.
5.1
Classification Accuracy
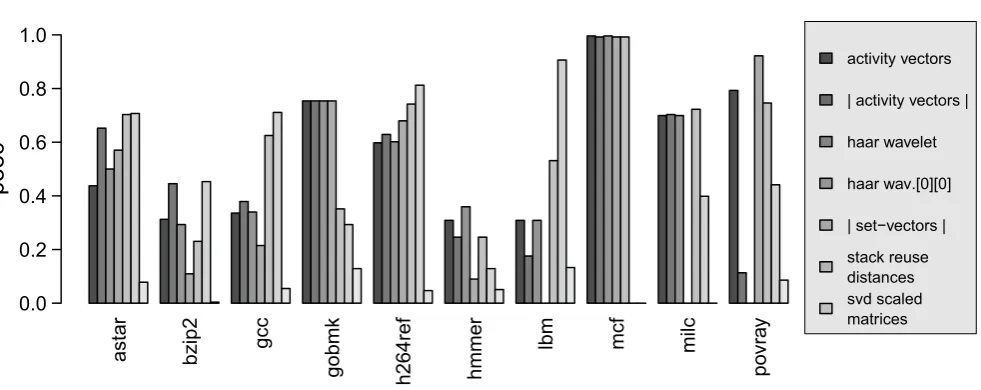
In Figure 1, we plotted thePoEC values for each of the mentioned methods for ten SPEC2006 benchmarks. For
theactivity vectors, we clustered a) the vector itself and
b) the magnitude |activity vector| of the activity vec-tor. For the haar wavelet method, we clustered both the scaled matrix and the left-top matrix element “haar wav.[0][0]”. For the setvectors, we clustered the mag-nitude of the setvectors; for the stack reuse distances, we clustered the stack distance vector, and for theSVD
scaled matricesthe results shown originate from the
col-umn space ofU. Column/Rowspace ofV didn’t achieve any better results. PoEC values near 1 indicate good classification performance,PoEC values near 0 indicate poor classification performance. The benchmarkmcf for example shows superior performance for theactivity vec-tors method, the wavelet method and the setvector ap-proach and poor classification performance for thestack
distance andSVD method.
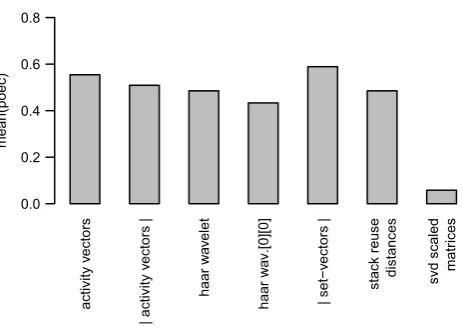
Figure 3 depicts the mean classification performance of each method averaged on the ten SPEC2006 benchmarks.
The setvector approach outperforms all other methods
and achieves about 6% better classification performance than the next best method, theactivity vectors method, that performs just slighly better than thestack reuse
dis-tancemethod. While thewavelet method still shows fair
results, the singular value decomposition of the scaled matrix has apparantely not been a good idea at all.
5.2
Computational Performance
The computational performance of the mentioned meth-ods can not easily be compared in this paper, because the methods have been implemented in different pro-gramming languages. The setvector and activity vector
methods have completely been implemented in slow Ruby 1.8.6, the wavelet and SVD methods have been imple-mented in a mixture of Ruby and R and thestack reuse
distances method has completely been implemented in C
for performance reasons.
The calculation of the scaled matrices used by thewavelet
method has been timed for 14μs per simulated instruc-tion. The calculation of wavelet coefficients in Ruby was
activity v
[image:4.595.305.537.102.266.2]ectors
| activity v
ectors |
haar w
a
v
elet
haar w
a
v.[0][0]
| set−v
ectors |
stack reuse distances svd scaled
matr
ices
mean(poec)
0.0 0.2 0.4 0.6 0.8
Figure 3: Mean PoEC classification performance
about 15ns, the calculation of the kmeans algorithm in R was about 2.5ns, including data exchange over the Ruby-R-bridge in both cases.
The setvector method suffered as the wavelet method
from the slow Ruby interpreter and took about 3.97μs
per instruction. The magnitude calculation and the clus-tering algorithm for the setvectors finished in less than 0.5ns. The better clustering performance originates from using scalars (vector magnitues) rather than vectors of dimensionality 16·16 = 256, as it has been done in the
wavelet technique.
The by far worst computational performance was demon-strated by thestack reuse distancemethod, that also took about 3.97μsof time per simulated instruction, but this time the method was implemented in C-code to finish the simulation in just some days instead of months.
Comparing the ruby wavelet implementation (about 14,0175μs per simulated instruction) to the execution time measued by [5] (about 10ns per simulated instruc-tion), allows the setvector method to be estimated for about 5−10nsper instruction when implemented on a C code basis; i.e. thesetvector method has about the same magnitude of calculation complexity as the other men-tioned methods, except thestack reuse distance method. All values have been averaged over several executions or files.
6
Conclusions
In this paper we introduced a new method for phase clas-sification calledsetvectors. The method is similar to the
activity vectors method proposed by [11], but it differs
astar bzip2 gcc
gobmk h264ref hmmer
lbm mcf milc
po
vr
a
y
poec
0.0 0.2 0.4 0.6 0.8 1.0
[image:5.595.51.542.96.291.2]activity vectors
| activity vectors |
haar wavelet
haar wav.[0][0]
| set−vectors |
stack reuse distances svd scaled matrices
Figure 1: Accuracy of phase classification techniques measured by the PoEC metric
same computational constraints. As a second contribu-tion, we introduced the PoEC metric that can be used to objectively evaluate phase classification methods in a more intuitive way than the known metrics CoV and
σweighted. Although we proved the better performance
of the PoEC method compared to the CoV/σweighted method just qualitatively “by inspection”, it obviously is a more reasonable approach.
References
[1] K. Beyls and E. H. D’Hollander. Reuse distance as a metric for cache behavior. 2004.
[2] A. S. Dhodapkar and J. E. Smith. Managing multi-configuration hardware via dynamic working set analysis. In International Symposium on Computer Architecture (ISCA’02), May 2002.
[3] E. Duesterwald, C. Cascaval, and S. Dwarkadas. Char-acterizing and predicting program behavior and its vari-ability. In 12th International Conference on Parallel Architectures and Compilation TEchniques (PACT’03), 2003.
[4] C. Fang, S. Carr, S. ¨Onder, and Z. Wang. Reuse-distance-based miss-rate prediction on a per instruction basis. InProceedings of the 2004 workshop on Memory system performance, 2004.
[5] T. Huffmire and T. Sherwood. Wavelet-based phase classification. InParallel Architectures and Compilation Techniques (PACT’06), September 2006.
[6] C. Jacobs, A. Finkelstein, and D. Salesin. Fast mul-tiresolution image querying. InProceedings of the 22nd annual conference on Computer graphics and interactive techniques, 1995.
[7] J. Lau, J. Sampson, E. Perelman, G. Hamerly, and B. Calder. The strong correlation between code signa-tures and performance. In IEEE International Sympo-sium on Performance Analysis of Systems and Software. March 2005.
[8] J. Lau, S. Schoenmackers, and B. Calder. Structures for phase classification. 2004.
[9] C.-K. Luk, R. Cohn, R. Muth, H. Patil, A. Klausner, G. Lowney, S. Wallace, V. J. Reddi, and K. Hazelwood. Pin: Building customized program analysis tools with dynamic instrumentation. In Programming Language Design and Implementation, ACM, 2005.
[10] J. MacQueen. Some methods for classification and anal-ysis of multivariate obervations. In Proceedings of the Fifth Berkeley Symposium on Mathematical Statistics and Probability, volume 1, pages 281–297, 1967. [11] A. Settle, J. L. Kihm, A. Janiszewski, and D. A. Connors.
Architectural support for enhanced smt job scheduling.
Proceedings of the 13th International Conference of Par-allel Architectures and Compilation Techniques, Septem-ber 2004.
[12] Sherwood, Perelman, Hamerly, and Calder. Auto-matically characterizing large scale program behavior.
ASPLOS-X: Proceedings of the 10th international con-ference on Architectural support for programming lan-guages and operating systems, 2002.
[13] E. Stollnitz, T. DeRose, and D. Salesin. Wavelets for computer graphics: A primer. InIEEE Computer Graph-ics and Applications.
a)
b)
1 2 0.65 0.75 0.85 0.95 libquantum, wavelet, poec = 0.00cluster L2 hitr ate 1 2 0.5 0.6 0.7 0.8 0.9 specrand, wavelet, poec = 0.12
cluster L2 hitr ate 1 2 0.90 0.92 0.94 0.96 hmmer, wavelet, poec = 0.19
cluster L2 hitr ate 1 2 0.0 0.2 0.4 0.6 gobmk, wavelet, poec = 0.19
cluster L2 hitr ate 1 2 0.80 0.85 0.90 0.95 povray, wavelet, poec = 0.22
cluster L2 hitr ate 1 2 0.4 0.6 0.8 gcc, wavelet, poec = 0.41
cluster L2 hitr ate 1 2 0.55 0.65 0.75 0.85 astar, wavelet, poec = 0.44
cluster L2 hitr ate 1 2 0.3 0.4 0.5 0.6 mcf, wavelet, poec = 0.56
cluster L2 hitr ate 1 2 0.2 0.4 0.6 0.8 milc, wavelet, poec = 0.94
cluster L2 hitr ate 1 2 0.75 0.85 0.95 soplex, wavelet, poec = 0.97
cluster L2 hitr ate 1 2 0.000 0.010 0.020 lbm, wavelet, poec = 0.97
cluster L2 hitr ate 1 2 0.0 0.2 0.4 0.6 0.8 1.0 bzip2, wavelet, poec = 1.00
cluster L2 hitr ate 1 2 0.90 0.92 0.94 0.96 hmmer, wavelet, cov = 0.02
cluster L2 hitr ate 1 2 0.75 0.85 0.95 soplex, wavelet, cov = 0.03
cluster L2 hitr ate 1 2 0.80 0.85 0.90 0.95 povray, wavelet, cov = 0.04
cluster L2 hitr ate 1 2 0.65 0.75 0.85 0.95 libquantum, wavelet, cov = 0.05
cluster L2 hitr ate 1 2 0.4 0.6 0.8 gcc, wavelet, cov = 0.07
cluster L2 hitr ate 1 2 0.2 0.4 0.6 0.8 milc, wavelet, cov = 0.09
cluster L2 hitr ate 1 2 0.5 0.6 0.7 0.8 0.9 specrand, wavelet, cov = 0.10
cluster L2 hitr ate 1 2 0.55 0.65 0.75 0.85 astar, wavelet, cov = 0.13
cluster L2 hitr ate 1 2 0.0 0.2 0.4 0.6 0.8 1.0 bzip2, wavelet, cov = 0.19
cluster L2 hitr ate 1 2 0.3 0.4 0.5 0.6 mcf, wavelet, cov = 0.21
cluster L2 hitr ate 1 2 0.0 0.2 0.4 0.6 gobmk, wavelet, cov = 0.52
cluster L2 hitr ate 1 2 0.000 0.010 0.020 lbm, wavelet, cov = 1.38
cluster
L2 hitr
[image:6.595.39.500.82.754.2]ate