Abstract—Greenhouse environment, used to grow plants under controlled climatic conditions for efficient production, forms an important part of the agriculture and horticulture sectors. Subsequently, environment monitoring system (EMS) has become a necessity of a green house plant for optimum growth, efficient water usage, improved yields, and better utilization of the resources. Many researchers have been making attempts to develop the green house EMS. The existing EMSs are bulky, very costly, difficult to maintain and less appreciated by the technologically less skilled work-force. In the present work an attempt has been made to devise a DSP processor based EMS to real time monitor the climatic parameters which, directly or indirectly, have a vital say in the growth of the greenhouse plant. The developed system is simple, cost effective, and easily installable. The parameters which are being real time monitor and recorded (for further analysis and usage) are temperature, humidity, soil moisture contents, illumination and CO2 concentration.
Index Terms—Environment Monitoring System (EMS),
Greenhouse Environment (GhE),DSP Processor.
I. INTRODUCTION
The crop cultivation in greenhouse is strongly influenced by the environmental conditions. The important environmental factors for the quality and optimal productivity of the plant growth are temperature, humidity,
illumination, moisture, and the CO2 concentration.
Continuous monitoring of these environmental factors gives relevant information pertaining to the individual effects of the various factors towards obtaining maximum crop production [1]. Since 1990s, several kinds of environment monitoring systems for greenhouse have been developed. But due to the lack of awareness & training for the implementation of such EMS, still these systems are beyond the imagination of the farmers. Further very high initial installation cost also de-motivates the farmers [2, 3].
Manuscript received 5 June, 2009.
Anuj Kumar, Research Student, at Instrument Design Development Centre, Indian Institute of Technology Delhi, New Delhi, India.(corresponding author phone: +91-11-26596725; e-mail: [email protected], [email protected]).
Abhishek Singh, Senior Lecturer, is with the Electronics and Communication Engineering Department, Radha Govind Engineering College, Meerut, U. P., India
I. P. Singh, Chief Design Engineer, is with the Instrument Design Development Centre, Indian Institute of Technology Delhi, New Delhi, India.
S. K. Sud, Emeritus Chief Design Engineer, is with the Instrument Design Development Centre, Indian Institute of Technology Delhi, New Delhi, India.
Taking into the consideration these bottleneck issues with the existing systems, an effort has been made to devise a simple, low cost, easily usable EMS using DSP processor. The proposed system for the greenhouse real time monitoring and recording the various environmental factors i.e. temperature, humidity, soil moisture contents, illumination, and CO2 concentration.
II. EXPERIMENTAL SETUP
The real time Greenhouse environment monitoring system measures the temperature, humidity, illumination, soil moisture, and concentration of CO2 using a sensor array
[image:1.595.333.530.382.520.2]and DSP processor is shown in figure 1.The description of the system has been divided into three parts: Sensors, Signal Processing, and DSP processor.
Figure 1. Block Diagram of Environment Monitoring System (EMS)
III. SENSORS
A sensor is a device that measures a physical quantity and converts it into an equivalent analog or digital signal which can be read by an observer or by an instrument. Monitoring of a greenhouse environment involves sensing the changes occurring inside it which can influence the rate of growth in plants. The parameters which are of importance are the temperature inside the greenhouse which affect the photosynthetic and transpiration process are humidity, moisture content in the soil, the illumination, and CO2
concentration etc [4-10]. In this paper we have used temperature, relative humidity, soil moisture, illumination, and CO2 sensors.
Prototype Greenhouse Environment Monitoring
System
A. Semiconductor Gas Sensors
A gas sensor detects particular gas molecules and produces an electrical signal whose magnitude is proportional to the concentration of the gas [4]. Till date, no gas sensor exists that is 100% selective to only a single gas. A good sensor is sensitive to the measured quantity but less sensitive to other quantities. Available gas sensors are based on five basic principles. These can be electrochemical, infrared, catalytic bead, photo ionization and solid-state [5, 6].
We have selected these sensors because they produce a strong signal for the selected variable especially at high gas concentrations with adequate sensitivity. They have a fast response time, high stability, long life, low cost, low dependency on humidity, low power consumption, and compact size [7 - 9].
IV. SIGNAL PROCESSING OF THE SENSORS
A. T
emperature SensorNational semiconductor’s LM 35 IC has been used for sensing the temperature. It is an integrated circuit sensor that can be used to measure temperature with an electrical output proportional to the temperature (in °C). The temperature can be measured more accurately with it than using a thermistor. The operating circuit is shown in figure 2. The output voltage of LM 35 is converted to temperature in °C is [7-10]
(
100
)
/
1
C
)
C
.(
°
=
V
out×
°
Temp
Figure 2. Temperature sensor circuit
B. H
umidityS
ensorThe sensor circuit develops a linear voltage vs. RH output that is ratio metric to the supply voltage. That is, when the supply voltage varies, the sensor output voltage follows in the same proportion. It can operate over a 4 to 5.8 supply voltage range. At 5V supply voltage, and room temperature, the output voltage ranges from 0.8 to 3.9V as the humidity varies from 0% to 100% (noncondensing).
The humidity sensor functions with a resolution of up to 0.5% of relative humidity (RH), with a typical current draw of only 200 μA, the HIH-4000 series is ideally suited for low drain, battery operated systems. The operating circuit is shown in figure 3. The change in the RH of the surroundings causes an equivalent change in the voltage output. The output is an analog voltage proportional to the supply voltage. Consequently, converting it to relative humidity (RH) requires that both the supply and sensor output voltages (At 25°C) [7 - 10]
(
)
(
/
sup−
0
.
16
)
/
0
.
0062
=
V
outV
plyRH
Figure 3. Humidity sensor circuit
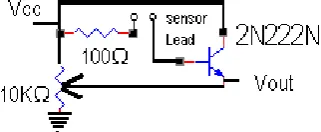
C. L
ightS
ensorAn LDR and a normal resistor are wired in series across a voltage, as shown in the circuit below. Depending on which is tied to the 5V and which to 0V, the voltage at the point between them, call it the sensor node, will either rise or fall with increasing light. If the LDR is the component tied directly to the 5V, the sensor node will increase in voltage with increasing light. The LDR's resistance can reach 10 k ohms in dark conditions and about 100 ohms in full brightness. The circuit used for sensing light in our system uses a 10 kΩ fixed resistor which is tied to +5V. Hence the voltage value in this case decreases with increase in light intensity. The sensor node voltage is compared with the threshold voltages for different levels of light intensity corresponding to the four conditions- Optimum, dim, dark and night. The relationship between the resistance RL and
light intensity Lux for a typical LDR is
Ω
=
LuxK
R
L500
/
With the LDR connected to 5V through a 10K resistor, the output voltage of the LDR is
(
10
)
/
5
0
=
×
R
LR
L+
V
In order to increase the sensitivity of the sensor we must reduce the value of the fixed resistor in series with the sensor. This may be done by putting other resistors in parallel with it. The LDR operating circuit is shown in figure 4 [10].
Figure 4. Light sensor circuit
D. S
oilM
oistureS
ensor [image:2.595.63.238.423.504.2]two copper leads act as the sensor probes. The soil moisture operating circuit is shown in figure 5. They are immersed into the specimen soil, whose moisture content is under test. The soil is examined under three conditions [10]:
a)
D
ryC
onditionThe probes are placed in the soil under dry conditions and are inserted up to a fair depth of the soil. As there is no conduction path between the two copper leads the sensor circuit remains open. The voltage output of the emitter in this case ranges from 0 to 0.5V [10].
b)
O
ptimumC
onditionWhen water is added to the soil, it percolates through the successive layers of it and spreads across the layers of soil due to capillary force. This water increases the moisture content of the soil. This leads to an increase in its conductivity which forms a conductive path between the two sensor probes leading to a close path for the current flowing from the supply to the transistor through the sensor probes. The voltage output of the circuit taken at the emitter of the transistor in the optimum case ranges from 1.9 to 3.4V approximately [10].
c)
E
xcessW
aterC
ondition [image:3.595.316.496.202.325.2]With the increase in water content beyond the optimum level, the conductivity of the soil increases drastically and a steady conduction path is established between the two sensor leads and the voltage output from the sensor increases no further beyond a certain limit. The maximum possible value for it is not more than 4.2V [10].
Figure 5. Soil Moisture sensor circuit
E. CO2 SENSOR
The sensor operating circuit is shown in figure 6. In general, the correlation of the reducing gas concentration (C) in ppm and sensor resistance (RS) is [4]-
2 1
0
]
)
1
[(
S KR
R
C
=
−
R0 = Electrical resistance of sensor at zero ppm,
RS = Electrical resistance of the sensor,
C = Gas concentration in ppm, K = A constant for particular,
The relationship between output voltage and gas concentration in ppm
2
0
]
1
)
1
)
/
(
[(
K
R
R
V
R
V
c
=
C L OUT−
L−
RL = Load resistance
VOUT = Output voltage
VC = Input voltage
The Power dissipation is calculated by PS =
(Vc)2.R
S/(Rs +RL)2. The standard circuit conditions are the
heater voltage 5.0 V±0.2V, maximum sensing material voltage 5–24V (DC only) and the specification of electrical characteristics are sensor resistance RS (5 KΩ– 15KΩ),
[image:3.595.81.242.460.526.2]heater resistance 30 ± 3 Ω [5, 7, 9].
Figure 6. CO2 sensor circuit
V. FUNCTIONING OF THEDSP PROCESSOR
The real time monitoring of Greenhouse environment using DSP processor is shown in figure 7. An analog multiplexer, filter, and signal transformer for level shifting are all included on the DSP kit. These transfer the multiple signals from the sensors to the digital signal processor (TMS320C5510). Subsequently, the output signals are fed to ADC channels and converted to a digital form. For real time processing, the data collected (temperature, humidity, illumination, soil moisture, and concentration level of CO2)
using the sensors is stored in DSP board memory, as well as displayed on the monitor.
Figure 7. Functioning of the DSP Processor
VI. RESULTSAND ANALYSIS
The main target of this paper is to implement the EMS, which is capable of measuring temperature, humidity, illumination, soil moisture, and CO2 concentration of
greenhouse using a sensor array and the DSP (TMS320C5510) board. Hardware implementations modules have been successfully developed.
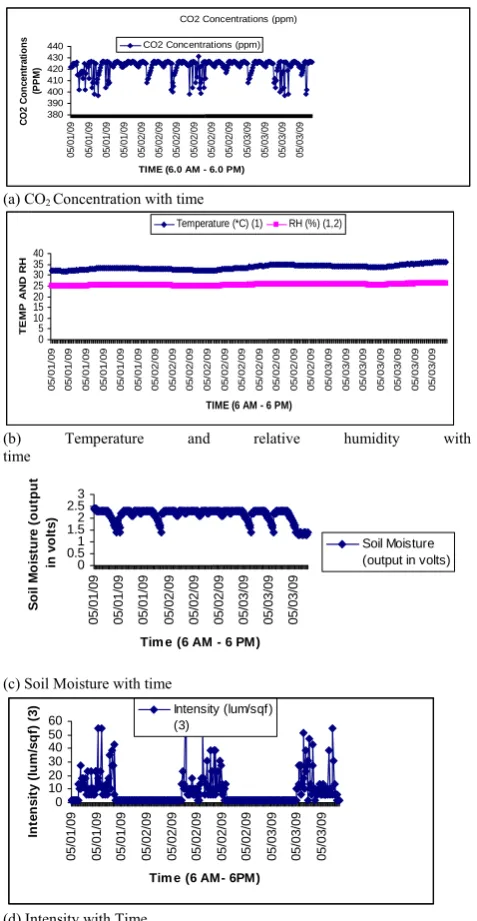
The sets of field measurements of temperature, humidity, illumination, soil moisture, and CO2 sensors were recorded
[image:3.595.335.530.480.609.2]shows the temperature, humidity, illumination, soil moisture, concentration levels of CO2 in the greenhouse
over a certain period of time (1May – 3 May 2009). To verify these results data generated with standard data-loggers (HOBO) were compared with the data of EMS. Data recorded by EMS shows reasonable accuracy with ± 5% variation to standard data.
CO2 Concentrations (ppm)
380 390 400 410 420 430 440 05/ 01/ 0 9 05/ 01/ 0 9 05/ 01/ 0 9 05/ 01/ 0 9 05/ 02/ 0 9 05/ 02/ 0 9 05/ 02/ 0 9 05/ 02/ 0 9 05/ 02/ 0 9 05/ 02/ 0 9 05/ 03/ 0 9 05/ 03/ 0 9 05/ 03/ 0 9 05/ 03/ 0 9
TIME (6.0 AM - 6.0 PM)
C O 2 C o n c en tr at io n s (P P M )
CO2 Concentrations (ppm)
(a) CO2 Concentration with time
0 5 10 15 20 25 30 35 40 05/ 01/ 09 05/ 01/ 09 05/ 01/ 09 05/ 01/ 09 05/ 01/ 09 05/ 01/ 09 05/ 02/ 09 05/ 02/ 09 05/ 02/ 09 05/ 02/ 09 05/ 02/ 09 05/ 02/ 09 05/ 02/ 09 05/ 02/ 09 05/ 02/ 09 05/ 02/ 09 05/ 03/ 09 05/ 03/ 09 05/ 03/ 09 05/ 03/ 09 05/ 03/ 09 05/ 03/ 09 05/ 03/ 09
TIME (6 AM - 6 PM)
T E M P AND RH
Temperature (*C) (1) RH (%) (1,2)
(b) Temperature and relative humidity with time 0 0.51 1.52 2.53 05 /01 /09 05 /01 /09 05 /01 /09 05 /02 /09 05 /02 /09 05 /02 /09 05 /03 /09 05 /03 /09 05 /03 /09
Tim e (6 AM - 6 PM)
S o il M o is tu re ( out put in vo lt s) Soil Moisture (output in volts)
(c) Soil Moisture with time
0 10 20 30 40 50 60 05 /01/ 09 05 /01/ 09 05 /01/ 09 05 /02/ 09 05 /02/ 09 05 /02/ 09 05 /02/ 09 05 /02/ 09 05 /03/ 09 05 /03/ 09 05 /03/ 09
Tim e (6 AM- 6PM)
In te n s it y ( lu m /s q f) ( 3
) Intensity (lum/sqf)
(3)
[image:4.595.44.283.172.633.2](d) Intensity with Time
Figure 8. (a, b, c, and d) Data Analysis of real time record data of CO2
Concentration, Temperature and relative humidity, and Soil Moisture and Intensity
VII. MEASUREMENT ERRORS
The various sources of errors occur from the large noise exists in: (i) sensor output because the sensors are very sensitive to environmental parameter (temperature and humidity); (ii) the base line of sensors shift with time; (iii) sources of error signal are the current overload circuit; (iv)
signal quantization error (introduce analog to digital converter); (v) when the output digital to analog converter resolution is less than the internal resolution of the DSP, its also adds a certain amount of noise to the output signal; (vi) discretization process in the implementation of a digital filter. A DSP system can easily adapt to some change in environmental variables and used in noise cancellation (Set of filter characteristics) is beyond the practical scope of adaptive signal processing (time varying environment). Adaptive systems are usually operates in a real time environment with stringent computational complexity, storage requirement and parameter variations reproduce the environment changes.
VIII. LIMITATIONS AND DISADVANTAGE OF THE PROTOTYPE SYSTEM
DSP based prototype systems are limited data storage capacity (32 bits, 1200 MHz speed), high power consumption, cost effective, no high flexibility and reusability, no easy upgrading (due to the usage of abstract hardware description language) but do provide only suboptimal processing speed due to the execution of software programs.
IX. COMPATIBILITY WITH EXISTIN SYSTEM
Schlindwein et al in 1998 developed a real time measurement and control of the environment monitoring system (specification 16 -32 bits/20 – 100 MHz speed / < 4 Mb RAM) by using the ASM/C/C++ language. They used K-NN, Neural Fuzzy system of the real time data processing of the system [11]. Chung and Lee (2001) developed the multi-channel, gas leakage monitoring system for local area monitoring of an urban region, using a complex programmable logic device [CPLD] [12]. Martin and Reich (2001) developed and modelled the theoretical response function of a sensor array for sensing of a mixture of gases, based on data from commercial sensors. They designed an appropriate pattern recognition scheme for the identification of the gas and its concentration [13].
The prototype real time Greenhouse environment monitoring system measures the temperature, humidity, illumination, soil moisture, and concentration of CO2 using
a sensor array and DSP processor and this is very fast (high speed system), and thus the specifications of the prototype implemented system are 32 bits, 1200 MHz, and 2048Kb SDRAM.
X. CONCLUSIONS
DSP processor makes the system to be used for real time application. The implemented system is successful in measuring the temperature, humidity, soil moisture, illumination, and concentration of CO2 gases. Initial results
of the study are encouraging. But this has its own limitations, as these results are based on small number of measurements. To increase the level of accuracy we are planning to conduct more measurements in different greenhouse environments. The information of the system easily exchange between farmer and expert.
XI. FUTURE WORKS
1. This EMS needs some more field work and field experiments to increase the accuracy level.
2. This can be extended by adding more sensors for other
pollutant gases (SOx, NOx, CO, and O3) and
environmental parameter temperature and relative humidity.
3. Another useful improvement to the system is developing a “wireless link”.
REFERENCES
[1] J. H. Shin, W. S. Hahn, and Y. M. Lee, “Development of the environmental control network system in greenhouse,” Agriculture Information Technology in Asia and Oceania, 1998, pp. 82-83. [2] A. Pawlowski, J. L. Guzman, F. Rodriguez, M. Berenguel, J.
Sanchez, and S. Dormido, “Simulation of climate monitoring and control with wireless sensors network and event based control,” Journal of Sensors, vol. 9, 2009, pp. 232 – 252.
[3] B. M. Kiernan, C. Fay, S. Beirne, and D. Diamond, “Development of an autonomous greenhouse gas monitoring system,” Proceedings of World Academy of Science, Engineering and Technology, vol. 34, Oct. 2008, pp. 153 – 157.
[4] D. D. Lee and D. S. Lee, “Environment gas sensors,” IEEE Sensors J., vol. 1, no. 3, Oct. 2001, pp. 214-215.
[5] N. Kularatna and B. H. Sudantha, “An environmental air pollution monitoring system based on the IEEE 1451 standard for low cost requirements,” IEEE Sensors J., vol. 8, no. 4, April 2008, pp. 415 – 422.
[6] G. Neri, “Metal doping in semiconductor gas sensors,” Sensors Encyclopedia, vol. 6, 2006, pp. 1 – 13.
[7] “Figaro gas sensors technical reference,” Figurearo Eng., Wilmette, IL, 1992.
[8] “Sensor industry development and trends,” Sensors express, Nov.2002. Available:www.sensorsmag.com
[9] http://www.intlsensor.com/solidstate.pdf.
[10] Amit Radhakrishnan, Poonam Bansal, Prabhat Kumar, Smitha P., Chinmayananda Das, and Ricky, “Monitor and control of greenhouse environment.
[11] F. S. Schlindwein, P. I. J. Kecton, “DSP chips in real time measurement and control, IEE Colloquim, vol 9, 1998, pp. 1-6. [12] Chung, W. Y., and Lee, D. D., “Real-time multi-channel gas leakage
monitoring system using CPLD chip”, Sensors and Actuators B, 77, 2001, pp. 186-189.

![figure 4 [10].](https://thumb-us.123doks.com/thumbv2/123dok_us/1306144.660503/2.595.63.238.423.504/figure.webp)