Abstract—The nervous control of the cardiovascular system has been the subject of intensive research investigations during the last decades. This nervous control usually involves two or more nervous reflex mechanisms that act at the same time, increasing a lot the complexity of the system. Although many aspects are currently known regarding some reflex mechanisms (e.g. the baroreflex), others remain in a veil of uncertainties. This is the case of the vestibular-sympathetic reflex, which has not been characterized at a quantitative level yet. In this context, the aim of this paper is to take a first step in a quantitative model of the vestibular sympathetic reflex, by developing an interpolative model of the Vestibular Nucleus first. The model was built based on experimental data available in the literature. This interpolative model will allow a more thorough analysis of the dynamic behavior of the Vestibular Nucleus, and also a coupling with the output of the Vestibular receptors.
Index Terms— vestibular nucleus, interpolative model, vestibular-sympathetic reflex, frequency characteristics.
I. INTRODUCTION
The last three decades of research on the neurophysiologic functions of the Vestibular System have been marked by an intensive study of techniques, ideas and new tools for describing the information processing that takes place at this level. These studies have focused both on the peripheral and central part of the Vestibular System, both in terrestrial and microgravity environments. These studies have emerged from the findings of several reflex mechanisms governed by or with the help of the Vestibular System – from the vestibular spinal reflex, to vestibular-ocular reflex, and most recently to the vestibular-sympathetic reflex.
There are numerous reports in the literature that confirm the presence of a vestibular-sympathetic reflex that contributes to the nervous control of the cardiovascular system (e.g. [5] and [6]). Despite all these advances, quantitative models that embed this reflex mechanism have not been reported yet. Moreover, if for the Vestibular Receptors (VR) the literature presents quite a few models, the Vestibular Nucleus has not been modeled in a quantitative manner. The current paper aims in taking a first step in the
Manuscript received November 12, 2009.
Alexandru Codrean (corresponding author, e-mail: alexandrucodrean@yahoo.com) and Vlad Ceregan (e-mail: ceregan_vlad@yahoo.com ) are students in Control System and Informatics, Toma-Leonida Dragomir (e-mail: tldragomir@yahoo.com ) is a professor at the Department of Automation and Applied Informatics and Adrian Korodi (e-mail: adrian.korodi@aut.upt.ro ) is an associate professor at the same department. All authors are with “Politehnica” University of Timisoara, 300223 Timisoara, Bd. V. Parvan No. 2, Romania.
direction of a quantitative modeling of the vestibular-sympathetic reflex. Interpolative generators will be developed for the Vestibular Nucleus (the central part of the Vestibular System) frequency characteristics, which will later permit us to obtain a time domain model that could be further coupled with one of the existing models for the Vestibular Receptors (peripheral part of the Vestibular System).
The paper is organized into five sections. Section I introduces the current context of vestibular research and the need for developing a model of the Vestibular Nucleus. Section II highlights the role of the Vestibular Nucleus and its place in the vestibular reflex mechanism, which in turn contributes to the nervous control of the cardiovascular system. Section III describes the proposed model for generating the Vestibular Nucleus frequency characteristics. Section IV shows the simulation results, while Section V draws some conclusions and states the possibilities for future work.
II. THEVESTIBULARNUCLEUS
The Vestibular Nucleus (VN) represents the first level of information processing for the vestibular-sympathetic reflex. Although it is considered to have many neurological functions, with strong interconnections with other nervous centers, for the current presentation only its contribution to the vestibular-sympathetic reflex is of interest. In this context, it is necessary to determine how the outputs of the Vestibular Nucleus manage to influence the nervous control of the cardiovascular system (CVS), through the sympathetic nervous activity. At the level of the central nervous system, the outputs of the Vestibular Nucleus converge with the outputs of the Nucleus Tractus Solitarius (NTS), which represents the first level of information processing for the baroreflex mechanism. This convergence is believed to take place at the level of the Ventrolateral Medulla (VLM).The need for integrating these two reflex mechanisms – the vestibular-sympathetic reflex and the baroreflex – is crucial for developing a complete model of the nervous control of the CVS in orthostatic stress scenarios, which represents the long term goal of the authors. Recent evidence in the literature confirm this point of view, the vestibular-sympathetic reflex being considered the earliest nervous control mechanism that influences the heart rate, before the baroreflex ([7]).
A pathway of the information processing for neural cardiovascular regulation which is generally accepted in the literature (e.g. [2], [3]) is presented in fig. 1. The input signal for the Vestibular Nucleus – svr – represents the vector
Interpolative Frequency Characteristics
Generators for the Vestibular Nucleus Activity
associated to postsynaptic potentials (the synapses are considered to be part of the VR block), nbr and ncr represent the firing rates of the baroreceptors and cardiopulmonary receptors, while ns and np , the outputs of VLM and NA/DMNX, are in the same time the input signals for the Sympathetic and Parasympathetic Systems. The output of the Vestibular Nucleus - nvn – represents the firing rate of the Vestibular Nucleus neurons.
Fig. 1 Nervous centers in the MO involved in the nervous control of the CVS
The reference signal nr, coming from Higher Nervous Centers, provides a variable set-point for blood pressure. As the figure suggests, the Higher Nervous Centers may influence the behavior of the Ventrolateral Medulla (VLM) and the Nucleus Ambiguous/Dorsal Motor Nucleus of the Vagus (NA/DMNX), depending on certain conditions, like psychological factors for example.
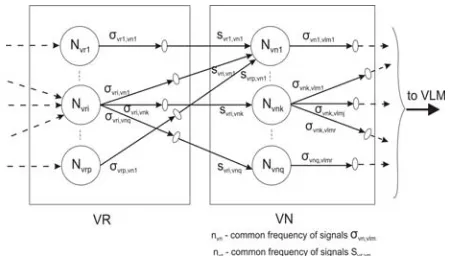
[image:2.595.61.286.501.629.2]From a neurophysiologic point of view, the Vestibular Receptors sense a change in head acceleration (a) based on a micro mechanical mechanism, at the level of the Semicircular canals and Otolith organs. After an electro-mechanic transduction, the signals reach the receptor neurons. These generate action potentials, which propagate to the neurons from the Vestibular Nucleus. The Vestibular Nucleus neurons will then further transmit action potentials to the VLM.
Fig. 2 Simplified representation of the interconnections between vestibular receptor neurons (part of VR) and
Vestibular Nucleus neurons
A hypothetical representation of the interconnections between p receptor neurons and q Vestibular Nucleus neurons is presented in fig.2. For reasons of simplicity, only the interconnections of neuron Nvri with the neurons of the VN and neuron Nvn1 with the neurons of the VR are represented. The synapses between the neurons are represented by ellipses. The signals σ and s represent presynaptic and postsynaptic nervous signals, which
the signals from this representation, and the one from fig. 1 is that the signal svr is associated to the svr,vnsignalsand the signal nvn is associated to the common frequency of the σvn,vlm signals.
The scarce availability of experimental data for the Vestibular Nucleus activity to certain stimuli, the complex information processing that takes place and the multiple roles that this nervous center might play have prevented scientists in developing a quantitative model. Most studies that are related to the vestibular-ocular reflex, describe in a qualitative manner the dynamics of the Vestibular Nucleus in terms of simple low-pass or high-pass filters. One of the most comprehensive experimental studies on the dynamic characteristics of the Vestibular Nucleus is presented in [1]. The paper focuses in particularly on the Medial Vestibular Nucleus, which represents a part of the Vestibular Nucleus ([4]). The Medial Vestibular Nucleus is considered to receive information also from theotolithorgans, the main vestibular receptors involved in the vestibular-sympathetic reflex ([8]). The dynamic behavior of this group of neurons, i.e. the dynamic of the channel svr→ nvn , is represented in [1] via a nonparametric model composed of a series of amplitude-frequency and phase-frequency characteristics, for different mean firing rates of the neurons. It is obvious from these characteristics that the dynamics cannot be described as simple as a low pass or high pass filter, but rather by a certain combination of these two, complemented by an adaptive engine.
The study from [1] is based on a small number of experimental characteristics, due the difficulty of obtaining them. Concurrently, the authors present in their paper characteristics calculated based on a model which is not revealed. These characteristics diverge on certain regions from the experimental ones. The aim of the current paper is to propose two interpolative type generators for the frequency characteristics of the channel svr → nvn, which use the experimental characteristics from [1]. This two generators can be regarded as models of interpolative type for Vestibular Nucleus.
Next, the presentation will be limited to the study of the input output relationships between the signals svr and nvn.Thus the developed model will have the signal svr as input,the signalnvn as output, and it will be in the future incorporated in the structure from fig. 1.
III. INTERPOLATIVEGENERATORSFOR FREQUENCYCHARACTERISTICSOFTHE
VESTIBULARNUCLEUS
A certified fact is that many systems were designed guided by an expert knowledge. Often, there is no other way to describe various functioning patterns and they are best expressed through information taken over from experiments. Therefore, mathematical models of different nature can be obtained using the data provided by an expert.
According to chapter II, the Vestibular Nucleus is required to be modeled in order to have a complete and correct representation of the vestibular-sympathetic reflex.
depending on the information provided by an expert. The expert provides experimental data which can be processed and used to develop the model. In order to provide a mathematical model for the channel svr → nvn of the Vestibular Nucleus, the experimental data provided in [1] was considered the only appropriate knowledge that could constitute a starting point to develop a proper model to generate frequency characteristics through approximations for the mentioned channel.
In this context Fig. 3 and Fig.4 show the experimental Amplitude –frequency and Phase- frequency characteristics obtained in [1], which was used as expert knowledge, and also as a starting point, for developing the new model.
The vector svr associated to the postsynaptic potentials has
two synthetic components: ⎥
⎦ ⎤ ⎢
⎣ ⎡
π =
) t n 2 sin( S
) t ( s s
vr 0
mfr
vr . The first
component smfr(t), with a slow variation in time, corresponds to the mean firing rate (spikes/sec). The second component,
) t n 2 sin(
S0 π vr , synthesizes the periodical time evolution of signals svr,vn . In [1] these components were experimentally implemented by electrical currents.
The synthetic signal nvn is imagined as a scalar sinusoidal signal nvn(t)=Nvn0sin(2πnvrt+ϕvn) whose amplitude
0 vn
N represents the value of the amplitude of the σvn,vlm signals common frequency, and ϕvn describing the inertia that appears in the transmission of information.
In this context Fig. 3 illustrates some frequency characteristics of amplitude f (n )
S k
N
vr 1 0 exp
0
vn =
⋅ , where kexp
represents a normalizing factor, and Fig. 4 presents the correspondent phase characteristics ϕvn =f2(nvr) ; (Phi=
ϕ).
Fig. 3 Experimental Amplitude –frequency characteristics from [1]
A suitable and efficient method to develop a model, based on the above mentioned frequency characteristics, is represented by the interpolation.
An interpolative structure is based on interpolative tables, which implements an interpolation function given by a number of support points and an interpolation method. A support point P for an n-dimensional interpolative table is defined as a combination of (n+1) values,
(
1, 2, ..., n,)
P V V V R , the first n elements representing the
support place and the last element the support value
(
V1, , V2 ..., Vn)
R = f . Through the interpolation
method, the real, but unknown, input-output dependence between a support point and corresponding support value is approximated, based on the set of support places and the set of corresponding support values. Currently, the set of support is placed in the nodes of a Cartesian grid. For practical applications, Simulink offers a set of lookup-tables provided with different interpolation methods.
Fig. 4 Experimental Phase –frequency characteristics from [1]
[image:3.595.50.281.486.664.2]In order to obtain more frequency characteristics of the Vestibular Nucleus Activity, two interpolative generators will be used (see Fig. 4). Both interpolative generators, GIPAmplitude and GIPPhase, make use of two-dimensional lookup-tables that are constituted using the experimental data from [1]. The inputs of the interpolative tables are: the mean firing rate smfr and an instantaneous frequency signal nvr. The outputs are the amplitude Nvn0 and the phase ϕvn.
Fig. 5 Interpolative type generators for frequency characteristics of the Vestibular Nucleus Activity
When realizing the interpolative tables using the data from [1], respectively to process the experimental data, the following formula was used to obtain the non-normalized evolutions represented in Fig. 3:
mfr
s b
e a
kexp = ⋅ ⋅ , a = 15.31; b = - 0.008.
Table 1a Amplitude interpolative table
nvr→
↓smfr
0.1 0.2 0.3 0.4 0.5 0.6 0.7 0.8 0.9 1
10 13.59 13.84 14.01 14.17 14.26 14.42 14.51 14.67 14.76 14.84
24 12.4 12.46 12.53 12.62 12.63 12.74 12.80 12.86 12.92 12.98
28.5 12.18 12.21 12.30 12.33 12.41 12.50 12.50 12.58 12.64 12.67
34 11.66 11.70 11.66 11.66 11.66 11.61 11.61 11.57 11.57 11.57
49 10.2 10.25 10.30 10.35 10.4 10.45 10.50 10.54 10.58 10.63
[image:4.595.47.287.55.374.2]56 9.78 9.80 9.87 9.89 9.96 10.03 10.03 10.09 10.14 10.16
Table 1b Amplitude interpolative table
nvr→
↓smfr
2 3 4 5 6 7 8 9 10
10 14.84 13.67 11.95 9.794 7.89 6.07 5.49 5.49 5.49
24 13.39 13.63 13.72 13.67 13.5 13.44 13.30 13.23 13.23 28.5 13.09 13.40 13.63 13.63 13.66 13.49 13.29 13.06 12.78 34 11.74 11.83 12.15 12.33 12.55 12.73 12.82 12.64 12.24
[image:4.595.312.541.304.671.2]49 11.08 11.45 11.84 12.11 12.39 12.62 12.8 12.94 13.03 56 10.64 11.05 11.39 11.75 12.07 12.37 12.62 12.85 13.05
Table 2a Phase interpolative table
nvr
→ ↓smfr
0.1 0.2 0.3 0.4 0.5 0.6 0.7 0.8 0.9 1
10 4.22 5.79 6.85 8.43 10.00 11.06 12.11 13.70 14.75 16.85
24 3.94 3.64 3.03 2.72 2.11 1.51 0.912 0.60 0 0.608
28.5 2.812 2.5 2.5 1.87 1.87 1.87 1.56 1.25 0.93 0.62
34 3.15 3.15 3.15 3.15 2.715 2.715 2.715 2.715 2.715 2.715
49 1.56 1.87 1.87 2.18 2.5 2.81 2.81 3.12 3.12 3.12
[image:4.595.313.540.327.512.2]56 3.75 3.75 3.75 3.75 4.06 4.06 4.06 4.06 4.06 4.06
Table 2b Phase interpolative table
IV. SIMULATIONS
This section will cover the simulation scenario for the interpolative generators from Fig. 4 developed in section III. Through this scenario more frequency characteristics of the Vestibular Nucleus Activity will be obtained.
As was mentioned, the generators consist in two lookup tables implemented in the Matlab / Simulink environment.
The first input of each generator is the mean firing rate smfr, a signal with slow variation in time. Therefore, and according
to the experiment related in [1], next in the scenario, constant values will be considered for smfr, particularly: 10, 20, 30, 40, 50 and 60 spikes/sec. The first value is exactly the one from tables 1 and 2 and it helps to examine the quality of the interpolation methods. The last value was chosen in order to investigate the extrapolation features of the generators. The intermediate values differ, as well as the last one, from those produced in experiments and to obtain the corresponding frequency characteristic interpolation is required.
The second input for the generators, the instantaneous frequency signal nvr, takes in the related experiment from figures 3 and 4 values in the range 0.1 Hz to 10 Hz. This range was maintained in simulations because this is the physiological range of the head movement frequency. In simulations this range is generated via a simple ramp signal.
Figure 6 and 7 illustrate the amplitude-frequency characteristics generated with GIPAmplitude, while Figure 7 and 8 show the phase-frequency generated with GIPPhase obtained through linear, respectively spline interpolation. Two types of interpolations were used, linear and spline, in order to compare the accuracy of the results.
[image:4.595.314.541.487.670.2]Fig. 6 Amplitude- frequency characteristics obtained with linear interpolation using GIPAmplitude
Fig.7 Amplitude- frequency characteristics obtained with spline interpolation using GIPAmplitude
The ensemble of frequency characteristics highlights the hypothesis that the behavior of the neurons in certain conditions consists in jumps between characteristics corresponding to different mean firing rates.
One can observe in Fig. 6 and Fig. 7 that a rise in mean
nvr
→ ↓smfr
2 3 4 5 6 7 8 9 10
10 28.41 41.04 54.19 70.51 86.28 101.4 116.3 130.1 143.80
24 5.45 11.51 16.96 22.11 28.18 33.33 38.18 42.42 46.96
28.5 2.5 6.25 10.62 15.31 20 24.68 30 34.06 38.43
34 3.15 4.454 7.06 10.54 14.45 17.93 20.97 23.58 25.32
49 4.06 3.75 2.5 0.94 1.25 3.75 6.25 8.12 10.31
firing rate at low frequencies (0.1-1 Hz) results in a decrease in amplitude, while a rise in mean firing rate at high frequencies (1-10 Hz) corresponds to an increase in amplitude. This rise in amplitude at high frequencies with an increase in mean firing rate can be attributed to the predictive character of the vestibular system involved in the sympathetic reflex, which is mentioned in the literature [9].
[image:5.595.55.286.348.505.2]Fig.8 Phase- frequency characteristics obtained with linear interpolation using GIPPhase
Fig. 9 Phase- frequency characteristics obtained with spline interpolation using GIPPhase
Figures 8 and 9 show that a rise in the mean firing rate causes a decrease in phase at high frequencies, while a decrease in mean firing rate leads to a phase increase. Another aspect worth taking into consideration is that in most simulation cases the phase is positive, which also points out an anticipative behavior.
By comparing the results obtained with the two interpolation methods – linear and spline – it can be concluded that linear interpolation leads to smoother characteristics (which seem to be closer to the real characteristics of the physical system). This can be observed especially by looking at figures 8 and 9.
V. CONCLUSIONS
This paper has focused on developing interpolative generators for the Vestibular Nucleus, based on the experimental amplitude- frequency and phase-frequency characteristics presented in [1]. The simulations results show that the model exhibits the dynamic characteristics of a combination between a low pass and high pass filter, depending on the mean firing rate. The mean firing rate of a neuron or a group of neurons can be correlated to its current operating point.
Through these interpolative generators any frequency characteristic can be obtained, corresponding to any mean firing rate. This will allow a more elaborate study of the dynamics behavior of the Vestibular Nucleus neurons. Moreover, based on the amplitude-frequency and phase–frequency characteristics obtained through interpolation, a dynamic model of the Vestibular Nucleus in time domain can be conceived, using system identification tehniques.
Such a model may be coupled with the output of the vestibular receptors. This will later permit to obtain a complete model of the Vestibular System involved in the Vestibular-Sympathetic Reflex.
REFERENCES
[1] S. du Lac, S.G. Lisberger, “Cellular Processing of Temporal Informationin Medial Vestibular Nucleus Neurons”, The Journal of Neuroscience, pp. 8000-8010, December 1995.
[2] C.D. Balaban, B.S. Yates, “Vestibuloautonomic Interactions”, The Vestibular System, pp. 286-342, Springer-Verlag, New York, 2004. [3] N. Nisimaru, “Cardiovascular Modules in the Cerebellum”, Japanese
Journal of Physiology, pp. 431-448, Vol. 54, 2004.
[4] P. Brodal, “Central Nervous System, The: Structure and Function”, 3rd Edition, Oxford University Press, 2004.
[5] J.R. Carter, A.R. Chester, “Sympathetic responses to vestibular activation in humans”, Am. J. Physiol. Integr. Comp. Physiol., 294: R681-R688, 2008.
[6] A. Radtke, K. Popov, A.M. Bronstein, M.A. Gresty,
“Vestibulo-autonomic control in man: Short- and long-latency vestibular effects on cardiovascular function”, Journal of Vestibular Research, Vol. 13, Nr. 1, pag 25-37, 2003.
[7] M. Olufsen, J. Ottesen, H. Tran, L. Lipsitz, and V. Novak,”Modeling baroreflex regulation of heart rate during orthostatic stress”, Am. J. Physiol. Regulatory Integrative Comp. Physiol. 291: R1355- R1368, 2006.
[8] R. W. Baloh, V. Honrubia, “Clinical Neurophysiology of the Vestibular System”, 3rd Edition, pp. 53-107, Oxford University Press, 2001.