Ireland’s Competitiveness
Scorecard 2015
Introduction to the National Competitiveness Council
The National Competitiveness Council reports to the Taoiseach and the Government, through the Minister for Jobs, Enterprise and Innovation on key competitiveness issues facing the Irish economy and offers recommendations on policy actions required to enhance Ireland’s competitive position.
Each year the NCC publishes two annual reports.
Ireland’s Competitiveness Scorecard provides a comprehensive statistical assessment of Ireland's
competitiveness performance.
Ireland’s Competitiveness Challenge uses this information along with the latest research to outline the
main challenges to Ireland’s competitiveness and the policy responses required to meet them.
As part of its work, the NCC also publishes an annual Submission to the Action Plan for Jobs and other papers on specific competitiveness issues.
National Competitiveness Council Members
Prof Peter Clinch Chair, National Competitiveness Council
Liam Casey Chief Executive Officer, PCH International Ltd.
Kevin Callinan Deputy General Secretary, IMPACT Trade Union
Micheál Collins Senior Research Officer, NERI - Nevin Economic Research Institute
Isolde Goggin Chair, Competition and Consumer Protection Commission
John Herlihy Vice President, International SMB Sales and Head of Google Ireland
Declan Hughes Assistant Secretary, Department of Jobs, Enterprise and Innovation
Danny McCoy Chief Executive Officer, Ibec
Jane Magnier Joint Managing Director, Abbey Tours
Seán O'Driscoll Chairman and Chief Executive Officer, Glen Dimplex Group
Louise Phelan Vice President of Global Operations, Europe Middle East and Africa, PayPal
Heather Reynolds Director, Eishtec
Dave Shanahan Chief Executive, Adagio Ventures Commercialisation Partners
Martin Shanahan Chief Executive, IDA Ireland
Ian Talbot Chief Executive, Chambers Ireland
Siobhán Talbot Group Managing Director, Glanbia
Council Advisers
John Callinan Department of the Taoiseach
Ann Derwin Department of Agriculture, Food and the Marine
Maria Graham Department of Environment, Community and Local Government
Katherine Licken Department of Communications, Energy and Natural Resources
John McCarthy Department of Finance
Deirdre McDonnell Department of Education and Skills
Conan McKenna Department of Justice and Equality
David Moloney Department of Public Expenditure and Reform
Ray O’Leary Department of Transport, Tourism, and Sport
Research and Administration
Adrian Devitt Department of Jobs, Enterprise and Innovation
Conor Hand 23 Kildare Street, Dublin 2
John Maher Tel: 01 6312121
Email: [email protected]
Taoiseach’s Foreword
After several years of reform, the prospects for Ireland’s economy in 2015 and beyond look more promising than at any stage since the onset of the financial crisis and economic recession. A sustained programme of reform since my Government came into office in 2011 has stabilised the economy and delivered a platform for recovery and growth.
It has not been easy to get to where we are today. It is important that we take time to acknowledge the sacrifices made by so many and to recognise the progress made to date. Employment is now growing strongly, our exporting companies are confidently winning business in international markets, our reputation as a safe, secure and rewarding location in which to invest and do business has been restored, and the level of inward investment is stronger than ever.
While the economy is now growing, we cannot afford to pause in our efforts. Too many people are still without employment, too many of our young people have emigrated, and too many families are still struggling to make ends meet.
Protecting and improving Ireland’s competitiveness is vital to securing our future interests, to underpinning a strong and stable euro and to helping address the fiscal, economic and social challenges we face. As an exceptionally open economy, enormously dependent on international trade and investment, our competitiveness is critical to our future prosperity.
By ensuring that Ireland is highly competitive, we can continue to grow the economy in a sustainable manner from which everyone will benefit, increasing the spending power of individuals and families, and helping our firms to compete successfully in international markets.
With this in mind, my Government will continue to take the necessary action to improve Ireland’s competitiveness, through initiatives such as the multi-annual Action Plan for Jobs and a range of other strategies to encourage investment, entrepreneurship and job creation, across all regions of the country. Furthermore, as we look to a new Capital Expenditure Programme for the medium term, Ireland’s competitiveness will be a core driver of investment.
I would like to thank the National Competitiveness Council for producing this highly valuable report, which provides a solid analytical foundation for competitiveness policy development and delivery, and which will provide an extremely useful input to policymakers across all of the arms of Government.
Chairman’s Preface
After a traumatic and difficult period of economic adjustment, the Irish economic recovery appears to be becoming more secure. Several quarters of strong economic growth has been translated into significant employment growth, spread across most sectors.
Ireland’s ability to compete in international trade is a key determinant of wages, living standards and financing of social services like health, education and social protection. As a small open economy, Ireland’s ability to achieve sustainable growth is dependent on our ability to maintain international competitiveness. To date, improvements in our competitiveness have been one of the key factors in driving recovery and growth. And yet, there are causes for concern.
There is a clear sense that benign external factors – favourable exchange rates, low energy prices and the weak euro - are boosting Ireland’s international cost competitiveness. While these factors are currently working in our favour, they can be quickly reversed, eroding the gains made to date. They also serve to shield us from some harsh truths: Ireland’s continuing competitiveness is under threat, and indeed, there are indications that pressures are already emerging which are undermining our international ability to compete. In May 2015, we have seen Ireland’s international competitiveness ranking fall slightly (from 15th to 16th, according to the IMD), after a number of years of steady improvement. While one should not read too much into a change in a single metric, this fall should alert us all to the risks of complacency. Ireland’s recovery remains fragile and too reliant on external factors.
While a small, trade-dependent economy such as ours will always be buffeted by the rise and fall of global markets, ensure that Irish enterprise and the Irish economy are best placed to take advantage of global upturns and to survive global downturns. To achieve sustainable competitiveness, leading to sustainable growth, we must focus on policy areas within the control of domestic policymakers, and relentlessly pursue reforms that allow and assist Irish companies to aggressively compete for market share in the globalised economy. To avoid boom-bust economic cycles, we must deliver the necessary structural reforms required to support competitiveness and growth.
On the costs side, earlier this year the Council pointed out the significant risk that recent competitiveness gains will be eroded as economic growth strengthens. In the Costs of Doing Business in Ireland 2015 report, the Council noted that, relative to some of our key competitors, Ireland remains an expensive location in which to do business. The report highlighted that a number of upward domestic cost pressures are now emerging, particularly in relation to labour, property and business services. In addition, the report highlights the difficulty of achieving further cost reductions against a backdrop of low inflation throughout the EU.
Improved productivity performance offers the best pathway to prosperity. While cost competitiveness is absolutely essential, only productivity growth offers the opportunity over the medium term to grow incomes and employment sustainably. Productivity performance is, therefore, the crucial determinant of Ireland’s international competitiveness.
To achieve the productivity growth necessary to continue Ireland’s recovery, the Council’s analysis has identified a number of policy challenges:
i. There is a need to maintain fiscal stability, ensuring that the State’s finances are prudently managed –
this is a crucial element in providing a stable business environment in which enterprise can thrive. A stable and a prudent approach to fiscal policy is also key to ensuring that sufficient public funds are available for
investment in productivity-enhancing programmes and infrastructures.
As the country returns to growth, further targeted and prioritised investment and reform is required to address existing and likely infrastructural bottlenecks which could constrain growth in the economy by dampening productivity growth, increasing costs and limiting sectoral opportunities for foreign direct investment (FDI) and indigenous enterprise development. Capital expenditure, however, is not just about physical infrastructure. Investment and growth is increasingly driven by knowledge-based capital – investing in people and R&D must remain a key strategy to improve productivity and competitiveness.
iii. Investment in people is not a new concept – the skills and talent of the work force are essential
determinants of labour productivity. Training and upskilling of talent is associated with large increases in both productivity and output. From a national competitiveness perspective it is critical that industrial development and skills policies are adequately aligned and that labour/skills mismatches in the labour market are
minimised. Issues relating to labour force participation and participation in lifelong learning also need to be addressed urgently to support competitiveness.
iv. While Irish export performance remains robust, we should not ignore the fact that much of our recent
performance is dependent on a relatively small number of sectors selling a narrow range of products into a narrow range of markets. To minimise the adverse consequences from any potential external shocks, there is a need to broaden out into new products, markets and sectors, whilst maintaining the competitive advantages we enjoy in existing ones. We must also look to the domestic market, and ensure that we develop the most supportive environment possible to support entrepreneurship and enterprise development. A range of policy actions are likely to be required in this space, including improving access to finance for enterprise.
v. Finally, the Council’s analysis highlights the importance of innovation as a source of growth. While
Ireland’s overall innovation performance has improved in recent years, performance lags innovation leaders such as Denmark, Finland, Germany and Sweden with whom we aspire to compete.
This report provides the evidential base to assist policy makers to identify the key challenges confronting Irish enterprise. The Council will discuss these issues and put forward proposals to address them in its annual policy document Ireland’s Competitiveness Challenge which will be published later this year.
I would like to conclude by thanking the Council members and advisers for their valuable time commitment and helpful contributions throughout the development of this report. I would also like to acknowledge the invaluable work of secretariat in its preparation.
Professor Peter Clinch
Table of Contents
Taoiseach’s Foreword 4
Chairman’s Preface 5
Chapter 1: Introduction 8
Chapter 2: Sustainable Growth 20
Chapter 3: Essential Conditions 26
Chapter 4: Policy Inputs 37
Chapter 1: Introduction
International Competitiveness Rankings
Since 2011, Ireland’s relative international competitiveness as measured by a range of international indices
improved (Figure 1). We have moved from 24th to 16th in the IMD’s World Competitiveness Yearbook and from
29th to 25th in the WEF Global Competitiveness Report. In addition, the World Bank’s most recent “Doing
Business” report shows Ireland is now ranked 13th out of 189 countries, up two places since 2014 (Figure 40).
While welcoming the improvement in Ireland’s rankings over the period 2011-2014, the Council is concerned that hard won competitiveness gains are at risk of being eroded. International competitiveness is a dynamic process and competition in the global economy is intense and constant. The IMD’s World Competitiveness
Yearbook published in May 2015, shows that Ireland’s overall competitiveness ranking slipped from 15th in
2014 to 16th in 2015. Ireland’s decline in the IMD can be partially explained as a result of improved performance
amongst some of our key competitors (most notably Luxembourg), emphasising the relative nature of cross country competitiveness comparisons. While the drop in performance is relatively slight, it serves as a reminder about Ireland’s vulnerability, the fragile nature of our recovery, and the need to continually focus on policies to support and enhance competitiveness.
A Return to Growth
Following annual GNP growth of 1.1% and 3.3% in 2012 and 2013 respectively, initial estimates indicate that the Irish economy is for now the fastest growing economy in Europe with GNP increasing by 5.2% year on year
in 2014, and by 4.8% in GDP terms1. European economic growth resumed in 2014 after two years of negative
performance, euro area growth however was modest at 0.9% GDP with the EU28 growing by 1.4%. From an Irish perspective, GDP growth in the UK and US of 2.8% and 2.4% respectively is particularly welcome, given the importance of both countries as export destinations for Irish produced goods and services.
Ireland’s GDP per capita remains well above the euro area average (+24.5%) and is the fourth highest in the
OECD-32 (Figures 2 & 3). In GNP per capita terms, however (a better measure of living standards), the
differential is much narrower (+5%). Although, GDP and GNP are once again increasing, output and incomes remain approximately 11 per cent below their pre-recession peak. Despite the adverse impact of the recession,
life satisfaction in Ireland (6.8) is above the OECD-32 average (6.7) (Figure 9).
Indeed, the impact of renewed Irish competitiveness and economic growth in our key trading partners is reflected in Ireland’s buoyant export performance. Services exports, driven by computer sales (both hardware and software) are increasing strongly and, since 2013, services account for a larger share of exports than goods (Figure 18). This is evident in Ireland’s increasing share in world services trade (2.7%) and declining share of merchandise trade (0.6%) (Figure 15). The EU and US accounted for 55% and 22% of total merchandise exports in 2014, relatively unchanged year on year. Ireland’s current account surplus increased by almost €4 billion in 2014, suggesting that Ireland is now paying its way in the world, and offering the possibility of more sustainable growth to come (Figure 5). However, the positive current account data must be interpreted with
caution. Irish export levels must be considered in relation to the performance of foreign owned firms (Figure 19)2
Balanced and Sustainable Growth
Following some volatility in 2012 and 2013, the drivers of growth became more balanced in 2014 with a noticeable increase in the contribution made by consumption and investment, albeit from low bases (Figure 4). In 2014 consumption increased by over 1% year on year with retail sales continuing to show modest growth.
After sharp reductions in investment during the recession, gross fixed capital formation continues to recover, increasing by 11% in 2014, albeit from a very low base (Figure 12). Irish investment levels in all assets types almost halved between 2008 and 2013, falling from 22% of GDP to 11.2% of GDP. Over the same period, the euro area average declined by 18 %. In GNP terms, Irish private investment (17%) mirrors the euro area average (16.8%), while public investment (1.8%) is significantly below average (2.8%). Inadequate capital investment, left unaddressed, will choke competitiveness and future economic growth.
Commercial and residential real estate transactions and prices increased in 2014, particularly in Dublin. Likely as a consequence of increased demand - and hence prices - planning permissions granted for all types of construction returned to growth and increased by 14% year on year. However, this level remains well below historic growth trends. New construction output levels also remain significantly below peak and property supply constraints are emerging. As the market tightens, a sustained shortage of supply of commercial and residential property and increasing rents and purchase prices could adversely impact competitiveness.
From an international investment perspective, Ireland remains an attractive location, and exhibited a strong performance in 2014, in terms of both FDI investment levels and employment (Figure 13). Despite intensified international competition for globally mobile investment, Irish tax rates (on corporations and income) remain competitive, although the gap between Ireland and OECD countries is narrowing (Figures 33, 34 &35). Ireland’s stock of inward investment (173% of GDP) remains amongst the highest in the OECD, illustrating the significant dependence of the economy on FDI: inward FDI flows in 2013 amounted to 16.2% of GDP (Figure 13). Arising out of all of this activity, net employment amongst agency supported foreign owned firms increased by 7,131 in 2014 and now stands at 174,000.
From an indigenous enterprise perspective, performance was very strong in 2014 and exports from Irish owned Enterprise Ireland supported firms increased by approximately 10% to €18.6billion. It was also a year of record employment levels for Enterprise Ireland supported companies, with total direct employment
increasing to 180,072. Year on year, indigenous exports grew across all sectors and international markets. Irish-owned companies account for 12.2% of total development agency client exports. In export market share terms, “food and drink”, “traditional manufacturing” and “business services” are the largest indigenous sectors. While this unprecedented performance is very welcome, maintaining these hard won gains in a global market where competition for FDI and export share is increasingly intense cannot be taken for granted.
Balanced and Sustainable Public Finances
Economic growth has resulted in significant improvements in the Government finances. While debt levels remain very high - the Irish debt to GDP ratio has declined from 123.2% of GDP in 2013 to 109.7% in 2014, with a continued downward trajectory expected over coming years – the general Government deficit subject to
continued discipline, is on course to be eliminated by 20183 (Figure 6). This reflects substantial consolidation
on the expenditure side throughout the recession, as well as more buoyant tax revenues, reflecting
new/increased taxes and the improvement in the economy. The Department of Finance estimate tax revenue grew by 9.2% in 2014 with significant growth in capital gains, stamp duties, income, VAT and corporation tax receipts. As a result, a primary general government deficit (i.e. the difference between government revenue and expenditure excluding interest payments) of 0.1% of GDP is expected for 2014, with a surplus of 0.7%
forecast for 20154.
Stable and sustainable public finances are a prerequisite for competitiveness. Looking out over a longer time horizon, while Ireland faces a significant challenge to achieve a 60% general government debt to GDP ratio, the level of fiscal consolidation required will not mirror the level experienced in recent years (Figure 7). The Council recognises the budgetary challenges of reducing the deficit level while at the same time ensuring that fiscal policies accommodate sustainable economic growth, investment and employment. Further, the impact of demographic pressures on the public finances in areas such as health and pensions in the future is
acknowledged. The Council considers that policies which best facilitate and support competitiveness and growth while minimising the impact of cyclical factors are essential to maintain fiscal stability. Steering an appropriately balanced course between both revenue and expenditure, (and between current and capital expenditure), is essential if the State is to have sufficient resources to invest in productivity enhancing infrastructures and programmes.
Moving beyond the public finances, high levels of indebtedness amongst the business sector (non-financial corporations) and households continue to impose constraints on investment and consumption (Figure 8). Likewise the propensity for individuals and firms alike to rebuild their balance sheets (by repaying outstanding debts, and maintaining relatively high savings rates), while rational, also acts as an impediment to growth. The levels of non-performing household and business loans remain extremely high. It is positive that the value of impaired SME loans has been declining slowly in recent quarters- the Central Bank notes that there are
positive signals in relation to arrears workout, particularly with regard to mortgages5. However, the resolution
of non-performing loans (NPLs) by the Banks requires continued focus as the cost of making provisions for NPLs hinders credit supply to the economy as a whole.
A Need for Jobs-Rich Growth
The impact of Ireland’s improved competitiveness and the return to growth has fed through to the labour market (Figure 28). Employment has now grown for 3 consecutive years with seasonally adjusted data
showing a 2.1% increase in the year to Q1 2015. By comparison, the European labour market has been sluggish – employment in the euro area grew by 0.6% in 2014 (Figure 30). From a crisis level low of 1.825 million employed, in Q1 2012, employment has now rebounded to over 1.9 million. This figure, however, remains
3 See Table 10, Budgetary Projections 2015-2020 in Department of Finance, Stability Programme Update, April 2015
4 According to Department of Finance figures, a General Government Balance of 2.3% of GDP is forecast for 2015, declining to 1.7% of GDP in 2016 and -0.9% in 2017. See Department of Finance, Stability Programme Update, April 2015
some way short of peak employment of 2.1 million and provides an indication of the scale of the challenge which still confronts Ireland.
In a break with recent years, in 2014 full time employment accounted for all of the increase in employment in Ireland – indicating that employers are becoming more confident about the recovery, and that more hours paid employment are available. Equally importantly, employment growth is spread relatively equally across the different sectors of the economy. Growth was strongest in construction (7%), professional, scientific and technical (6%) and accommodation and food service activities (5%). At the same time, unemployment is
noticeably declining. In 2014 unemployment was at 213,000 people – or 114,000 people below peak6. As a
result, the standardised rate of unemployment in Ireland declined from a peak of 15.1% in 2011 to 10.4% in Q4 2014, and to 9.7% in June 2015. The Irish unemployment rate is now well below the euro area average (11.1% in May 2015).
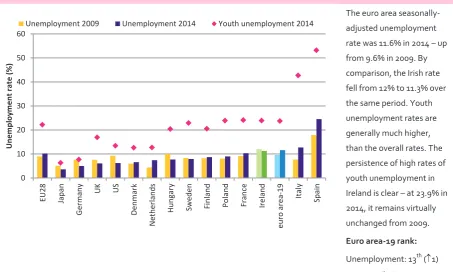
With strong employment growth, it is likely that labour and skills shortages will increase in the medium term. Despite a more positive outlook, a number of worrying trends persist. While the number of persons classified as long-term unemployed decreased by 32,000 (-20.6%) in the year to Q4 2014, long term unemployment continues to account for approximately 57% of Irish unemployment. At 6.7%, Irish long term unemployment remains above the euro area average (6.1%) Likewise, the persistence of high rates of youth unemployment in Ireland is common across the euro area (Figure 29). Youth unemployment in Ireland peaked at 31.1% in June 2012 but had decreased to 23.9% by 2014, marginally above the euro area average.
Interestingly in Ireland, the recession did not result in large scale changes in unemployment differentials between regions (Figure 31). The differential in unemployment rates across Ireland’s eight regions (15%) is amongst the lowest in the EU and has not changed significantly since 2009. With the onset of recovery, employment growth has occurred in most NUTS3 regions; however, employment growth across the Irish regions has been more uneven than was previously the case and the dispersion of employment rates between regions increased from 3% in 2008 to 5.1% in 2013.
The Irish labour force participation rate (59.8%) remains below the pre-crisis level (63.8% in Q4 2007), while the absolute size of the labour force has also decreased from 2.3 million to 2.15 million. This trend has continued in recent quarters - in the year to Q4 2014, the size of the labour force decreased. CSO data shows that this negative demographic effect is concentrated amongst 20 to 34 year olds, and is partly attributable to net outward migration. As a consequence of the recession, emigration returned as a feature of the Irish labour market in 2009 (Figure 50). Although net emigration in 2014 was at its lowest level since 2009, total net outward migration remains high at 21,400. More third level qualified people are leaving the country in recent years than are arriving (Figure 51).
In addition to the social loss associated with emigration, the migratory outflow of skills represents a significant loss of talent and undermines long term competitiveness. Competition for talent is global and intensifying. Despite significant increases in graduate numbers, skills shortages are emerging across multiple sectors— particularly, science, technology, engineering and ICT. Talent is increasingly mobile and Ireland’s ability to attract and retain talent is necessary to ensure sustainable competitive advantage. The attraction and retention of talented people will require broadening the policy focus on talent beyond the provision of
education and training, economic migration policies, remuneration and tax policy. While these factors remain critical, the regulatory, market and social landscapes in a country also facilitate talent attraction and retention. Quality of life considerations such as ease of mobility, cost of living and personal factors are central to talent attraction and retention. Social and cultural development and effective city planning as well as the effective marketing of localities, regions and clusters is increasingly important internationally in attracting and sustaining talent.
The Outlook and Challenges Ahead
Growth prospects for Ireland for 2015-2016 are expected to be strong (Table 1). Aided by generally positive forecasts in both the US and UK (Table 2) – our two principle trading partners outside of the euro area - and the continued weakness of the euro (evident in Ireland’s declining effective exchange rate), Irish exporting sectors are well positioned.
Table 1: Department of Finance Forecasts for the Irish Economy7, 2015-2020
2015 2016 2017 2018 2019 2020
Real GDP growth (%) 4.0 3.8 3.2 3.2 3.0 3.0
Real GNP growth (%) 3.9 3.5 2.7 2.6 2.5 2.5
Employment growth (%) 2.2 2.2 1.9 1.9 1.8 1.7
Employment (‘000) 1,960 2,000 2,040 2,080 2,115 2,155
Unemployment (%) 9.6 8.8 8.4 7.8 7.3 6.9
General government balance (% GDO)
-2.3 -1.7 -0.9 -0.1 0.7 1.7
General government debt (% GDP)
105.0 100.3 97.8 93.6 89.4 84.7
Table 2: European Commission GDP growth forecasts (%)8, 2015-2016
2015 2016
UK 2.6 2.4
Germany 1.9 2.0
Ireland 3.6 3.5
Euro area 1.5 1.9
EU28 1.8 2.1
US 3.1 3.0
World 3.5 3.9
On the other hand, the ongoing uncertainty in relation to the EU’s economic prospects and the UK’s continued membership of the EU represent significant downside risks. Nevertheless, the majority of economic indicators provide a cause for optimism in the short term. The challenge for Ireland is to ensure that the move towards more balanced growth, with contributions from all sectors of the economy, continues and is robust over the long term.
If Ireland is to take advantage of the upturn in the global economy however, policy action is required to address a number of constraints which are currently undermining our competitiveness. Specifically, the Council believes that to deliver the growth and jobs required to enhance Ireland’s prosperity, a range of issues must be addressed to enhance productivity, thus improving competitiveness. Most immediately, Ireland’s international competitiveness reflects our cost competitiveness vis-à-vis our competitors and trading partners. Costs, therefore, continue to be a major focus for the Council. In the medium term, however, productivity improvements must be the primary driver of Irish competitiveness. The challenges in improving the quantity and quality of human and productive capital, and enhancing total factor productivity (through technological change, innovation and the application of competition policy) are significant but key to achieving sustainable competitiveness resulting in economic growth, jobs and improved living standards. These challenges are considered below.
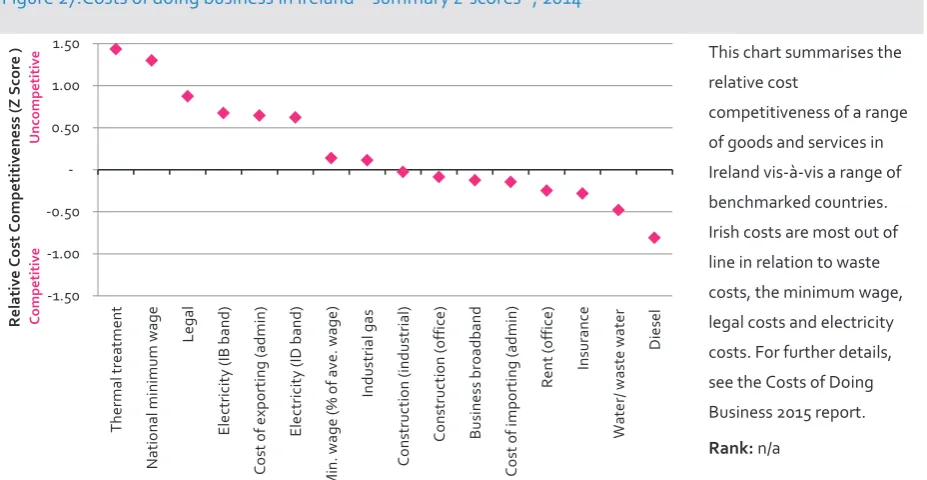
Costs
The Council recently published its 2015 Cost of Doing Business in Ireland report. This report (summarised in Figure 27) notes that Ireland’s cost base improved considerably in the period 2009-2014. This has made Irish firms more competitive internationally, and makes Ireland a more attractive location for firms to base operations. Increasingly, however, improvements in relative cost competitiveness have been driven by external factors beyond domestic policy control – in particular, the weak euro and low international fuel prices are the primary factors contributing to Ireland’s cost competitiveness (Figure 24). Ireland cannot rely on benign external factors to maintain competitiveness, and furthermore, there are significant risks that recent gains will be eroded as economic growth strengthens.
Despite the improvements achieved during the recession, Ireland remains a high cost location. In 2013, Ireland was the 3rd most expensive location in the euro area for consumer goods and services (Figure 22). Price levels were 16.8% above the euro area-18, and costs relative to national income (GNP) remain particularly high compared to the euro area average. From an enterprise perspective, in Q3 2014, business service prices were 6.5% above 2010 levels. Upward cost pressures are already emerging in Ireland, particularly in relation to labour, property, insurance and education, as well as a range of business services. In relation to labour costs, the concern is not that incomes are growing, but rather the extent to which these increases are supported by productivity (see Figure 26 and below).
The Costs report also highlighted the difficulty of achieving further cost reductions against a backdrop of low
inflation throughout the EU9, and the significant risk that recent competitiveness gains will be eroded as
economic growth strengthens and inflationary pressures begin to emerge. It is imperative, therefore, that Irish economic policies continue to be considered in terms of their impact on competitiveness and do not
unnecessarily result in cost increases.
Human Capital: Enhancing Employability and Skills
The Labour MarketAddressing weaknesses in Ireland’s labour market will remain a key priority and necessity for years to come. As well as ensuring that companies are in the optimum position to grow and create employment, there is a need to continue to target the most challenging parts of the labour market and to assist the most vulnerable members of society. The issue of youth and long term unemployment have already been highlighted above. There is also a need to address low levels of female labour force participation in Ireland (52.4% in Q1 2015) which remain well below the euro area average. Ireland has the fourth lowest female participation rate in the euro area.
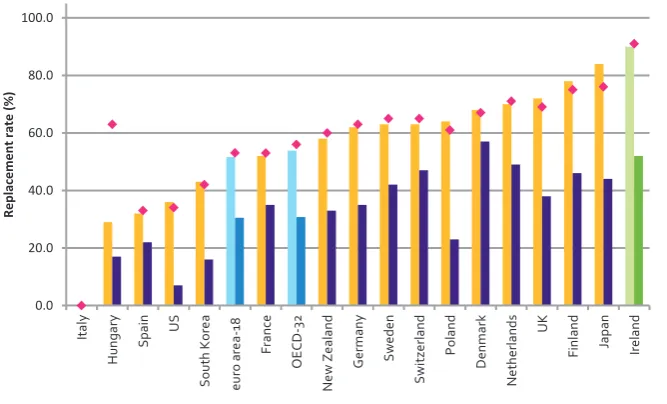
In addressing these issues, it is important that all of the factors impacting upon participation and the take up of employment are carefully considered. For instance, issues such as childcare costs, replacement rates, and levels of personal taxation are factors which influence labour market outcomes. Childcare costs in Ireland are among the highest in the OECD, and represent a major disincentive to work for lone parents, or parents seeking to return to work. In this regard, the replacement rate also plays a role in shaping the incentive to work for individuals (Figure 32). At present, replacement rates are significantly higher for lower income families in Ireland (i.e. those earning 67% of the average wage), than other OECD countries. Replacement rates, bands and thresholds for income tax have a direct impact on the labour market. Currently, the gap between what the employer pays and what a single employee earning 100% of the average wage receives has increased from 24.7% in 2009 to 28.2% in 2014 (Figures 34 & 35). However, this is still significantly below the OECD average of 35.7%. Generally, marginal tax rates in Ireland are lower for families with children than for single people. Attracting talent home is also an emerging issue. Marginal tax rates for higher earning and internationally mobile workers are less competitive.
At a broad level, as recovery deepens, policy makers must be cognisant of the interdependency of the taxation system, social welfare and replacement rates, and the impact that policy changes can have on labour market participation.
Skills and Talent
Productivity growth is the preferred mechanism to drive competitiveness in the medium to longer-term, as it delivers improvements in competitiveness in tandem with sustainable increases in income levels. Labour productivity is one of the primary determinants of overall productivity performance. Irish (GDP) productivity grew by an average of 2.6% per annum between 2008 and 2013, and in 2013, productivity levels exceeded the OECD average (Figure 20). In GNP terms, productivity levels are close to the OECD average.
Despite the positive trend in productivity performance, the Council has previously drawn attention to the impact changes to the composition of employment had on Irish productivity growth. In particular, the collapse in the labour intensive construction sector and Ireland’s large base of multinationals in high value added sectors serves to boost Ireland’s productivity level and disguises to a degree underperforming sectors. Ireland’s productivity performance (in common with many other countries) is built upon a narrow base of sectors, and indeed, in some cases, companies.
quantity and quality, as Ireland’s moves further along the path of becoming a knowledge-based economy. For example, the proportion of the Irish population aged 25-64 with a tertiary level degree has consistently increased over the past decade (Figure 45). In 2013, 41.5% of Irish adults aged 25-64 had attained a tertiary degree in 2013, an increase from 33.9% in 2008. Attainment levels are even higher for younger cohorts – amongst the population aged 25-34, 51% in Ireland have a third level qualification, compared with 41.6% in the OECD.
In terms of those skills most in demand from enterprise such as ICT, science, engineering and financial
vacancies, Ireland had 22.5 maths, science and computing graduates per 1,000 of the population aged 20-2910
(Figure 47). This is the 2nd highest level in the euro area, higher than the corresponding figures for the US (12.2). At second level, student ability as measured by the Programme for International Student Assessment (PISA) shows that Irish performance has improved since 2009 and that average test scores are above the OECD average in maths, reading and science. The early school leaving rate continues to decline in Ireland, from 11.7% in 2009 to 6.9% in 2014 and is well below the euro area average (11.7%).
Concerns remain, however, particularly in relation to the large proportion of adults who have left formal education with relatively low levels of attainment - the proportion of the population with less than upper secondary education remains high internationally (Figure 46)and this problem is compounded by low levels of participation in lifelong learning (Figure 49). More broadly, OECD research indicates that Irish people
(aged 15-64) perform below the OECD averages on mathematical and reading proficiency (Figure 48).
Investment to Drive Competitive Advantage
Access to Finance
Access to affordable finance is a critical determinant of enterprise’s ability to operate, invest and expand. For SMEs in particular, credit supply in the form of bank loans remains the key funding source. Across the euro area the volume of credit supplied to non-financial corporations (NFCs) has been weak as a result of low economic growth, structural adjustments in the banking system and weak demand for credit.
The Irish financial crisis saw significant public funds used to recapitalise the banking sector. Further, the State has intervened to boost the supply of credit to SMEs through a range of initiatives such as the Microenterprise Loan Fund, Credit Guarantee Scheme and the Strategic Banking Corporation of Ireland. Central Bank data shows that annualised gross new lending to non-financial, non-property related SMEs has increased from €1.9
billion in December 2013 to €2.1 billion in June 201411 and to €2.4 billion in December 201412. However, the
total stock of credit continues to fall (Figure 36). Long standing concerns about the cost of finance for enterprise also persist – with Irish firms paying higher interest rates than their peers elsewhere in the EU for loans of varying sizes (Figure 37 &38).
The proportion of firms borrowing for ‘growth and expansion’ purposes continues to increase. The agriculture, wholesale/retail and business and administrative services sectors account for the largest share of new lending activity. In parallel, SME rejection rates for bank finance declined to 14% (a drop of 5%) in 2014. While the
10 A recently published survey by the Expert Group on Future Skills needs found a range of “hard to fill” vacancies, primarily in IT, engineering, science, health, business and some construction-related occupations, as well as a number of associate professional occupations (including technicians and sales related). See EGFSN, Vacancy Overview 2014, May 2015; further, the most recent National Skills Bulletin identified a similar range of skills shortages but noted that “in most cases, shortages remained confined to specialised areas and were small in magnitude”. See EGFSN, National Skills Bulletin, July 2014 11 Central Bank of Ireland, SME Market Report, 2014 H2, December 2014
proportion of Irish SMES who consider access to finance a major concern has declined13, and the pillar banks returned to profitability in 2014, a number of weaknesses remain in the financial system.
As well as issues related to the availability of, demand for, and cost of credit for enterprise, the legacy of the financial crisis and the high proportion of non-performing loans in Ireland remains a cause for concern (Figure 39). Although the proportion is declining, such loans still account for 25.3% of gross loans in Ireland (compared to an OECD-32 average of 5.9%). The differential in interest rates charged to non-financial corporations between Ireland and the euro area also remains elevated and is concerning from a competitiveness
perspective14.
Broadening the Enterprise Base
The resilience of our exporting sector has been one of the economy’s greatest strengths in recent years. A more diversified and broad-based export oriented enterprise sector would enhance competitiveness and Ireland’s ability to withstand external economic shocks. The availability of finance referred to above, is an essential factor for firms seeking to expand or reorient their operations, and to move into new markets and develop new products. Finance, however, is not the only factor which impacts upon the development of the enterprise base. Notwithstanding the strong performance of Enterprise Ireland supported companies, the economic crisis severely impeded the level of start-up activity in Ireland. Data for 2012 shows more businesses closed than were created with gains in the ICT and financial services sectors offset by construction sector
losses (Figure 14). Ireland was ranked 15th in the euro area in terms of new business growth.
From a national competitiveness perspective, facilitating entrepreneurship by ensuring that the State does not place undue administrative burdens and costs on entrepreneurs and business owners is critical. While a range of recent structural reforms (e.g. the Companies Act and the Integrated Licensing Applications Service) will help to support entrepreneurship, other elements of Ireland’s environment for entrepreneurship are relatively poor in an international competitiveness context; in particular, reducing the time and complexity of
procedures associated with enterprise start-up must continue to be a policy priority.
The composition and range of goods exports from Ireland has changed considerably over the last decade. In contrast to global trends, goods exports in Ireland are increasingly concentrated in a relatively narrow base of
sectors15. The shift in Irish exports since 2000 is evident in the data: exports of office machinery and electrical
goods decreased from one third of all goods exported in 2000 to less than 10% of goods exports in 2014. Chemicals and pharmaceutical products’ are now the key driver of export growth and their share of total exports has been growing steadily since 2000; chemicals now account for 60% of the value of goods exported from Ireland, compared with approximately 11% of total global exports. While the total value of exports from this sector is high, these exports are dominated by a small number of foreign owned MNCs. Research indicates that the high level of import content and the relatively high returns to capital means the sector’s contribution
to Gross National Income is much lower than its export size16.
13 See ECB/EC’s Survey of SME Access to Finance
14 For loans up to and including €1 million, rates charged to Irish business were 5.02% in 2014, 43% higher than the euro area average. Interest rates on loans over €1 million are 50% higher. Interest rates on revolving loans and overdrafts, convenience and extended credit card debt available to Irish NFCs were 26% higher than the euro area average in 2014.
The impact made by foreign owned enterprises to exports from Ireland in terms of their contribution to
competiveness and productivity has been well documented17. Despite increasing competition and changing
FDI composition, Ireland remains highly competitive as a location for new and existing FDI. The challenge of sustaining investments from established investors, while at the same time diversifying Ireland’s FDI portfolio by tapping into new and emerging growth opportunities, is well recognised by IDA Ireland in its new strategy statement. Improving the linkages between indigenous and foreign owned firms also offers Ireland a potential source of competitive advantage.
Irish exports remain very dependent on strong trading activity with the euro area (35%), the UK (13%) and US (22%), accounting for 70% of goods exports in 2014. Trade with the UK is particularly important to the
indigenous enterprise sector. In value terms, 37% of Enterprise Ireland client companies’ exports are to the UK. As the Council has previously noted, Ireland’s trading patterns leave us vulnerable to external shocks,
particularly changes in the value of the euro. While exports to countries beyond these main trading partners have increased in recent years, the Council considers Irish exporters must diversify sustainably and
strategically into more markets to reduce reliance on particular countries or regions (Figure 17). In recent years import growth has been strongest in Asia and emerging economies underlining the importance of policies that support Irish enterprises, particularly SMEs in broadening and diversifying their export market focus.
Capital Investment
As noted previously, much of the Irish recovery has been driven by the growth of exports. To deliver a sustainable and balanced recovery, however, investment (both public and private) will need to contribute a greater proportion to overall growth in the future (Figure 8). The availability of competitively priced world class infrastructure (energy, telecoms, transport, waste and water) and related services is critical to support economic growth and enterprise development. Likewise, the provision of adequate housing supply (including social housing) is an essential determinant maintaining cost competitiveness.
Perceptions about the quality of Ireland’s infrastructure have improved since 2010, reflecting both the impact of a decade or more of investment, and the reduced capacity constraints as a result of the economic downturn (Figure 41). Ireland, however, still lags behind the OECD average and scores significantly less than leading performers. As the economy continues to improve, further investment growth is forecast for 2015. However, projected public investment levels are insufficient to address the emerging infrastructural needs of a growing economy and population, particularly as a significant proportion of public funds will be absorbed in
maintaining the existing stock, leaving less funding available for new investment. While recognising the importance of maintaining sustainable public finances, further additional targeted investment is urgently required to address constraints which could undermine the economy’s growth prospects, dampening productivity growth, increasing costs, and weakening Ireland’s attractiveness as an investment location (for both foreign and indigenous investors). To achieve the improvements required, prioritisation will be required such that over the medium term, investment is directed to those areas of the economy which can have the greatest impact upon competitiveness. It is critically important to put in place the appropriate policy and regulatory frameworks to facilitate this targeted approach.
Digital technologies facilitate increases in innovation and total factor productivity across all economic sectors. These are key drivers of competitiveness in the economy. However, the potential of digitalisation to support
competitiveness and grow employment is currently under-exploited across the EU18. As a result, the Council are particularly interested in Ireland’s international digital connectivity and our place in the global digital economy. Overall, Ireland performs relatively well in the European Commission’s Digital Agenda Scoreboard
(ranked 9th out of the EU28, but lagging behind leaders such as Denmark, Sweden, the Netherlands and
Finland). Likewise, Ireland is performing well in terms of fixed and mobile broadband subscriptions (7th out of
19 and well ahead of the euro area average; subscriptions to faster broadband of at least 30Mbps are also
growing rapidly) and in terms of broadband costs (ranked 5th out of 13) (Figures 43 & 44). Irish companies are
also demonstrating improvements in their engagement with the digital world – Ireland is one of the best performing countries in Europe in terms of businesses trading on line, with 24% of enterprises selling goods and services online in 2014 compared with a euro area average of 14% (Figure 42). Despite being an above average performer, growth in online sales is coming from a very low base.
Fostering Innovation
Capital expenditure, however, is not just about physical infrastructure. Investment and growth in OECD economies are increasingly driven by innovation, generated through the development of knowledge based capital. OECD research finds that the strongest evidence for private under-investment exists for R&D-related
spending – suggesting a continued important role for public investment19. Investment in knowledge
infrastructure can augment competitiveness through multiple channels. As well as facilitating indigenous employment growth and boosting productivity, research and development activity can also foster entrepreneurship and create new business models.
Ireland’s commitment to research, development and innovation has expanded significantly, both in terms of the level of investment and the human resources engaged in R&D activity over the past decade. While Ireland’s competitive performance is consistent and relatively strong it is not outstanding. According to the European Union’s Innovation Scorecard, Ireland’s overall innovation performance has improved incrementally
in recent years, and in 2014 was 20% above the EU average (compared with 10% in 2007). Ireland is ranked 8th
and performance lags innovation leaders such as Denmark, Finland, Germany and Sweden (Figure 53). Ireland leads the EU28 in how innovative firms are and in the economic impact of innovation in terms of employment, revenue and exports. A range of weakness (relating to community designs, non-R&D innovation expenditures, and R&D expenditures in the public sector) remain to be addressed.
Overall levels of investment in R&D in Ireland remain below the best performing countries such as Finland and Sweden (Figure 52). In 2012, Irish gross expenditure on R&D (GERD) accounted for 1.7% of GDP (2% of GNP),
below the OECD-32 average. Business expenditure on R&D (BERD20) accounted for 1.2% - it is noticeable,
however, that the multinational sector is the primary driver of BERD in Ireland, accounting for 70% of BERD in 2013 according to the CSO. On the other hand, the growing recognition amongst indigenous companies of the importance of R&D investment is also evident: in 2013, Irish owned firms spent 2.2% of sales revenue on in-house R&D, compared with an average of 1.5% amongst foreign owned firms (Figure 54). Investment alone is no guarantee of success. While the outcomes from R&D activity can sometimes be difficult to quantify, ensuring that the level and impact of R&D expenditure from both public and private sources over the coming years is maximised will remain a cornerstone of competitive advantage.
18 European Commission, Press Memo, 1.5 Million More Jobs Through Digital Entrepreneurship in Europe are possible, Brussels, 29 April 2014 19 OECD, New Sources of Growth: Knowledge-Based Capital Driving Investment and Productivity in the 21st Century, May 2012
Ireland’s Competitiveness Challenge
Ireland’s Competitiveness Scorecard does not propose the answers to these challenges. Rather, this report provides the evidential base to assist policy makers to identify the key challenges confronting Irish enterprise. The Council will put forward proposals to address them in its annual policy document Ireland’s
Chapter 2: Sustainable Growth
Figure 1: Overview of Ireland’s international competitiveness rankings (amongst OECD-32)
Figure 1 presents Ireland’s ranking from amongst 32 OECD member states across a range of
competitiveness indices - a ranking of 1 (i.e. close to the centre of the chart) would indicate that Ireland is the most competitive in the OECD. In general, Ireland is a mid-table performer across all of the indicators21.
Rank: n/a
Source: Miscellaneous
Figure 2: Gross domestic product, euros per capita, current market prices, 2013
Despite the recession related decline, Irish GDP per capita remains well above the euro area average (+24.5%). In GNP terms (i.e. removing the impact of the foreign owned sector), the differential is much narrower (+5%). The European Commission forecast per capita GDP growth of 4.5% in 2015 and 2.8% in 2016 for Ireland.
Euro area-18 rank: GDP: 4th (p2) GNP: 8th (p3)
Source: Eurostat
21 These indices cover a number of policy areas – some based on directly measureable aspects of policy (e.g. the World Bank Doing Business Index); others measure softer, more subjective issues such as reputation; indices such as the IMD and WEF competitiveness indices capture a mixture of both.
€0 €10,000 €20,000 €30,000 €40,000 €50,000 €60,000 €70,000
Swi
tzerland Denmark Swe
d
e
n
US
Ne
th
erland
s
Ire
la
n
d
Finl
an
d
G
ermany Japan France
Ire
la
n
d
G
N
P
UK
eu
ro are
a 1
8
EU2
8
It
al
y
Spain Pola
nd
Hu
ng
ar
y
GDP per
capit
a
(
€
)
Figure 3: Growth in gross domestic product at current market prices, PPS per capita, 2013
Between 2012 and 2013, Irish GDP per capita (in PPP terms) declined by 1.2%. Over the same period, GNP per capita increased by 1.9%. More recent national data, however, shows that incomes per capita are once again increasing on the back of stronger economic growth.
Euro area-18 rank:
GDP: 4th (p1) GNP: 8th (p1)
Source: Eurostat
Figure 4: Components of Irish economic growth, 1998-2014
Over the course of the recession, net exports (the value of a country's total exports minus the value of its total imports) were the primary positive driver of Irish growth. Following some volatility in 2012 and 2013, in 2014 the drivers of growth became more balanced with a noticeable increase in the contribution made by investment.
Rank: n/a
Source: CSO, National Accounts
-3.00% -2.00% -1.00% 0.00% 1.00% 2.00% 3.00% 4.00% 5.00% 6.00%
Po
la
n
d
UK
Ire
la
n
d
G
N
P
G
ermany Sw
ed
en US
EU2
8
Swi
tzerland
Spain
eu
ro are
a
18
France
Ne
th
erland
s
De
nmark Japan Irela
n
d
Ita
ly
Finl
an
d
Ave
rag
e annual
growt
h
rate
(%
)
2012-2013 2008-2012
-12% -10% -8% -6% -4% -2% 0% 2% 4% 6% 8% 10% 12%
1998 1999 2000 2001 2002 2003 2004 2005 2006 2007 2008 2009 2010 2011 2012 2013 2014
P
ercentage of
GDP
Growth
Figure 5: Balance of payments, current account balance (€millions), 1998-2014
The current account balance measures earnings from net exports, plus net factor income and other transfers. Since 2008, the current account has moved from deficit to surplus (partly reflecting improved cost competitiveness). The current account surplus for 2014 was €11,467m, an increase of €3,834m on 2013.
Rank: n/a
Source: CSO Balance of Payments
Figure 6: General government debt (% GDP) and general government balance (% GDP), 2014
In recent years, Ireland’s general government debt dramatically increased. Having peaked at 123% of GDP in 2013, EC data shows that the Irish debt to GDP ratio declined to 109.7% in 2014. A general government balance of -2.8% of GDP is expected for 2015.
Euro area-19 rank:
Debt/GDP: 16th GGB/GDP: 15th Source: European Commission (EC), European Economy 2/2015
-€15,000 -€10,000 -€5,000 €0 €5,000 €10,000 €15,000
1998 1999 20
00
20
01
20
02
20
03
20
04
20
05
20
06
20
07
20
08
20
09
20
10
20
11
20
12
20
13
20
14
Milli
ons (€)
Belgium
Germany
Ireland
Greece
Spain
France
Italy
Luxembourg Malta
Netherlands Austria Portugal
Finland
euro area
Denmark Hungary
Poland
Sweden UK EU28
0 20 40 60 80 100 120 140 160 180
-6 -5 -4 -3 -2 -1 0 1 2
Ge
neral governme
nt
gross
debt
(
%
GDP)
Figure 7: Required fiscal consolidation to achieve a 60% debt-GDP ratio22, 2010-2030
Figure 7 illustrates the average fiscal
consolidation required to achieve a 60% debt target by 2030. For nearly all countries, further consolidation is required. For Ireland, average consolidation of 1.8% of GDP is required - a level significantly below that undertaken over recent years.
OECD-30 rank: 2016-2030: 22nd
[image:24.595.77.529.112.564.2]Source: OECD
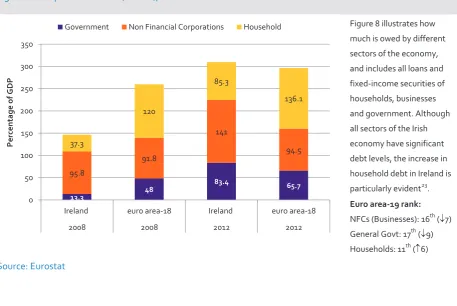
[image:24.595.74.532.388.694.2]Figure 8: Composition of debt (% GDP), 2008 and 2012
Figure 8 illustrates how much is owed by different sectors of the economy, and includes all loans and fixed-income securities of households, businesses and government. Although all sectors of the Irish economy have significant debt levels, the increase in household debt in Ireland is particularly evident23.
Euro area-19 rank:
NFCs (Businesses): 16th (p7) General Govt: 17th (p9) Households: 11th (n6)
Source: Eurostat
22 Consolidation is measured as the change in the underlying primary balance as a percentage of potential GDP. Over the projection period, countries with gross government debt ratios in excess of 60% of GDP are assumed to gradually reduce debt to this level, whereas other countries stabilise debt ratios at their current levels. Consolidation requirements from 2016 to achieve these objectives are measured as the difference between the underlying primary balance in 2015 and its average or its peak over the period to 2030 (or until the debt ratio stabilises).
23 According to Eurostat, the gross debt-to-income ratio of Irish households increased from 112% in 2002 to a peak of 209% in 2009, before declining somewhat to 198% in 2012. This was more than twice the euro area average. Figure 7 excludes the debt of financial corporations.
-4.0 -2.0 0.0 2.0 4.0 6.0 8.0 10.0 12.0
Ne
w Z
e
al
and
Swi
tzerland
Sou
th
K
o
re
a
Ne
th
erland
s
De
nmark
G
ermany Swe
d
e
n
eu
ro are
a-1
5
Finl
an
d
Ita
ly
OECD-3
0
Hungary Ire
la
n
d
Po
la
n
d
Fra
n
ce US
Spai
n
UK
Japan
Percent
a
ge of nomi
nal
GDP
Consolidation over 2016-30 to achieve debt target Consolidation 2010-2015
13.3
48 83.4 65.7 95.8
91.8
141
94.5 37.3
120
85.3
136.1
0 50 100 150 200 250 300 350
Ireland euro area-18 Ireland euro area-18
2008 2008 2012 2012
Percent
a
ge of GDP
Figure 9: OECD better life index24, 2014 and GDP per capita (PPP), 2013
This graph plots life satisfaction against GDP per capita (using
purchasing power parity to adjust for differences in the cost of living across countries). While Irish GNP per capita is slightly below the OECD-32 average, life satisfaction in Ireland (6.8) is above the OECD-32 average (6.7).
OECD-32 rank: Life
satisfaction: 18th (p5)
Source: OECD
Figure 10: Environmental performance index (Scale 0-100)25, 2014
Ireland’s environmental performance (EPI score) and rate of improvement lag the OECD average. Ireland performs well on indicators relating to health impacts and air quality but performs poorly in relation to biodiversity and protection of habitats, fisheries and water sanitation.
OECD-32 rank: EPI score: 18th
Source: Yale Centre for Environmental Law and Policy
24 The OECD Better Life Index compares well-being across countries across 11 topics (housing, income, jobs, community, education, environment, civic engagement, health, life satisfaction, safety and work-life balance). The data in the chart above is based on the life satisfaction metric which considers people's evaluation of their life as a whole. It is a weighted-sum of different response categories based on people's rates of their current life relative to the best and worst possible lives for them on a scale from 0 to 10. Change in ranking compares 2014 results with 2013 results.
25 The Environmental Performance Index (EPI) is constructed through the calculation and aggregation of 20 indicators reflecting national-level environmental data. These indicators are combined into nine issue categories, each of which fit under one of two overarching objectives (i.e. Environmental Health and Ecosystem Vitality. For more information see www.epi.yale.edu/
Denmark Finland France Germany Hungary Ireland Italy Japan South Korea Netherlands New Zealand Poland Spain Sweden Switzerland UK US OECD-32 Ireland GNP 4 4.5 5 5.5 6 6.5 7 7.5 8
$20,000 $25,000 $30,000 $35,000 $40,000 $45,000 $50,000 $55,000 $60,000
Le ss sa ti sf ie d M o re sa ti sf ie d OECD life satisfact ion index
GDP per capita, US$, PPS
0 1 2 3 4 5 6 7 8 0 10 20 30 40 50 60 70 80 90 100 Swi tzerland Sing ap ore G
ermany Spain Swe
d e n Ne th erland s UK De nmark Ne w Z e al and Finl an d OECD-3 2 Ire la n d Ita ly Japan France Hu ng ar y Po la n d US Sou th K ore a Brazi l Chi n a T e n year percent age ch ange Environme n ta l performance index
Figure 11: Percentage of energy from renewable sources, and per capita carbon dioxide emissions from fuel combustion, 2012
Renewable sources accounted for 6.1% of Ireland’s 2012 energy consumption – well below the OECD-32 average of 16.5%. In part, this reflects the limited hydro options in Ireland. Ireland’s level of CO2 emissions per capita have declined in recent years: in 2012 emissions were 20.5% below 2008 levels. CO2 emissions per unit of GDP have also.
OECD-32 rank:
Renewables: 24th CO2 emissions: 19th Source: OECD / International Energy Agency
0 2 4 6 8 10 12 14 16 18
0 5 10 15 20 25 30 35 40 45
Ne
w Z
e
aland
Swed
e
n
Finl
an
d
De
nmark
Swi
tz
erland
OECD-3
2
Ita
ly
Spain
G
ermany Po
la
nd
Hu
ng
ar
y
France
US
Ir
e
la
n
d
UK
Ne
th
erland
s
Ja
pa
n
Sou
th
K
ore
a
CO2 emiss
ions
-tonnes
/ capit
a
Rrenewables as
a
percent
a
geof
to
ta
l primary
energy s
u
pply
Chapter 3: Essential Conditions
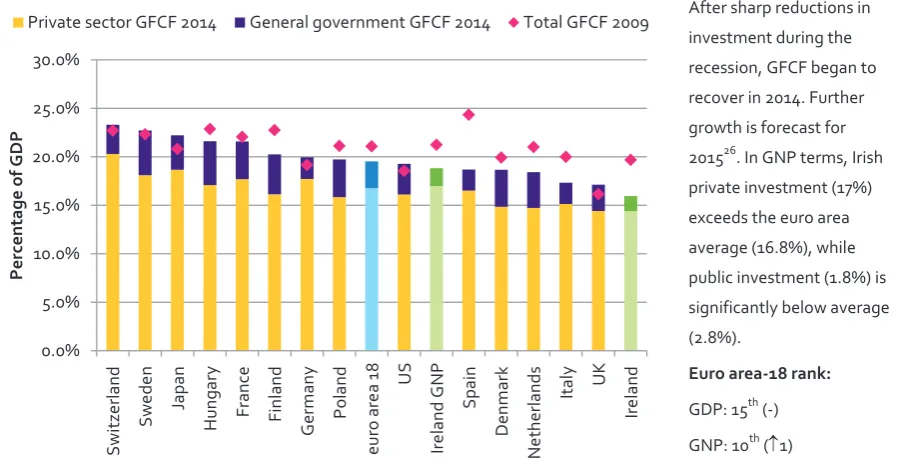
Figure 12: Gross fixed capital formation (GFCF), current prices (% GDP), 2014
After sharp reductions in investment during the recession, GFCF began to recover in 2014. Further growth is forecast for 201526. In GNP terms, Irish private investment (17%) exceeds the euro area average (16.8%), while public investment (1.8%) is significantly below average (2.8%).
Euro area-18 rank:
GDP: 15th (-) GNP: 10th (n1)
Source: European Commission, AMECO Database
Figure 13: Inward FDI stock and flow (% GDP), 2013
Ireland’s stock of inward investment, at 173% of GDP, remains amongst the highest in the OECD, illustrating the significant underpinning provided by FDI to the Irish economy. Inward FDI flows in 2013 amounted to 16.2% of GDP (19.2% of GNP), equivalent to €35.5 billion.
OECD-32 rank:
Stock (%GDP): 3rd (n2) Flow (%GDP): 1st (n30)
Source: UNCTAD, FDI/TNC database
26 Overall, Irish investment fell by more than 50% between peak levels in 2007 and 2013.Growth in 2015 is likely to be driven almost entirely by increases in private sector investment, according to AMECO.
0.0% 5.0% 10.0% 15.0% 20.0% 25.0% 30.0%
Swi
tzerland Swe
d
e
n
Japan
Hu
ng
ary
France Finl
an
d
G
ermany Po
la
n
d
eu
ro are
a
18 US
Ire
la
n
d
G
N
P
Spain
De
nmark
Ne
th
erland
s
Ita
ly UK
Ire
la
n
d
Percent
a
ge of GDP
Private sector GFCF 2014 General government GFCF 2014 Total GFCF 2009
euro area 19 Finland
Hungary
Ireland
Ireland GNP
Italy
Japan
Netherlands OECD-32
Poland
Singapore
Spain
Switzerland UK
US
-5 0 5 10 15 20 25 30
0.0 50.0 100.0 150.0 200.0 250.0 300.0
Inward FDI flows,
%
GDP
Figure 14: Net business population growth, 2012
In 2012 in Ireland, more businesses closed than were created. Gains in the ICT and financial services sectors were offset by construction losses. Ireland had one of the lowest business churn27 rates in the euro area in 2011.
Euro area-17 rank28:
Business population growth: 15th (p2)29
Source: Eurostat, CSO Business Demography
Figure 15: Ireland’s share of global export markets, 2000- 2013
Ireland has expanded its share of the world’s services market, reaching 2.7 per cent in 2013, up from 1.1% in 2000. However, Ireland’s share of global merchandise exports has declined to 0.6% in 2013 (down from a peak of 1.4% in 2002) as has our share of total global export markets (1% in 2013).
Rank: n/a
Source: World Trade Organisation
27 Business churn considers the total number of firm births and deaths as a proportion of the enterprise population. 28 Euro area 17 excludes Greece and Malta.
29 Change in ranking measured from 2009. Ranking based on euro area-18 which excludes Greece. Euro area-17 in the chart excludes Greece and Malta. 0 5 10 15 20 25 30 -8 -6 -4 -2 0 2 4 6 8 10 Ne th erland s Swe d e n France eu ro a re a-17 Finl an d Norw ay UK G ermany Po la nd De nmark It al y
Spain Irela
n d Hu ng ar y Bus iness ch
urn rate (%)
Net bu siness population growt h (%)
Net business population growth, 2012 Business churn: birth rate + death rate, 2011
0.0% 0.5% 1.0% 1.5% 2.0% 2.5% 3.0% 20 00 20 01 20 02 20 03 20 04 20 05 20 06 20 07 20 08 20 09 20 10 20 11 20 12 20 13 Percent a
ge of global
export
s
Figure 16: Ireland’s share of global export markets by sector30, 2013
This data examines Ireland’s share of world exports at a sectoral level. While Ireland’s market share in computer and information services held constant between 2008 and 2013 (as the sector grew rapidly globally), slight reductions in market share occurred in financial services and
pharmaceuticals. Larger reductions were recorded in the insurance sector.
Rank: n/a
Source: World Trade Organisation
Figure 17: Intra and extra-EU merchandise exports (% GDP), 2013
Ireland is one of the most open trading countries in the EU. Irish merchandise exports to the EU-28 amounted to 30% of GDP in 2013. Ireland also has significant trading links with non-EU countries (e.g. US). As a result of the importance of non-euro denominated trade, Irish firms are particularly influenced by exchange rate fluctuations.
Euro area-19 rank:
Merchandise exports:7th (-) Extra-EU trade: 3rd Source: Eurostat
30 Chemicals are a subset of the pharmaceutical sector – this is indicated by the lighter shade of green in the bar chart.
0% 2% 4% 6% 8% 10% 12% 14% 16% 18% 20% Co mputer & i n fo serv ic es In su ra n ce s er vic es Fina nc ia l se rvi ce s Co mmunic ati on s e rvi ce s Transpo rt se rv ic es Ph ar m ace ut ic al s Che mic als Agricul tu ral pro d u cts Of fi ce & te le co m eq uipment Ma ch in er y & tr an sp or t eq ui pm en t Percent a
ge of global
tr ade 2013 2008 0% 10% 20% 30% 40% 50% 60% 70% 80% 90% Ne th erland s Hu ng ar y Ire la n d G N P Ire la n d eu ro are a 19 Germany Po la n d De nmar k Swe d e n Finl an d Ita ly Spain UK France Percent a
ge of GDP