Proceedings of the 2019 EMNLP and the 9th IJCNLP (System Demonstrations), pages 85–90 85
HARE: a Flexible Highlighting Annotator for Ranking and Exploration
Denis Newman-Griffis†,‡ and Eric Fosler-Lussier†
†Dept. of Computer Science and Engineering, The Ohio State University, Columbus, OH ‡Rehabilitation Medicine Dept., Clinical Center, National Institutes of Health, Bethesda, MD
{newman-griffis.1, fosler-lussier.1}@osu.edu
Abstract
Exploration and analysis of potential data sources is a significant challenge in the appli-cation of NLP techniques to novel informa-tion domains. We describe HARE, a system for highlighting relevant information in docu-ment collections to support ranking and triage, which provides tools for post-processing and qualitative analysis for model development and tuning. We apply HARE to the use case of narrative descriptions of mobility informa-tion in clinical data, and demonstrate its utility in comparing candidate embedding features. We provide a web-based interface for annota-tion visualizaannota-tion and document ranking, with a modular backend to support interoperability with existing annotation tools.
1 Introduction
As natural language processing techniques be-come useful for an increasing number of new in-formation domains, it is not always clear how best to identify information of interest, or to evaluate the output of automatic annotation tools. This can be especially challenging when target data in the form of long strings or narratives of complex structure, e.g., in financial data (Fisher et al., 2016) or clinical data (Rosenbloom et al., 2011).
We introduce HARE, a Highlighting Annotator for Ranking and Exploration. HARE includes two main components: a workflow for supervised training of automated token-wise relevancy tag-gers, and a web-based interface for visualizing and analyzing automated tagging output. It is intended to serve two main purposes: (1) triage of docu-ments when analyzing new corpora for the pres-ence of relevant information, and (2) interactive analysis, post-processing, and comparison of out-put from different annotation systems.
In this paper, we demonstrate an application of HARE to information about individuals’
mo-bility status, an important aspect of functioning concerned with changing body position or loca-tion. This is a relatively new type of health-related narrative information with largely uncharacterized linguistic structure, and high relevance to overall health outcomes and work disability programs. In experiments on a corpus of 400 clinical records, we show that with minimal tuning, our tagger is able to produce a high-quality ranking of docu-ments based on their relevance to mobility, and to capture mobility-likely document segments with high fidelity. We further demonstrate the use of post-processing and qualitative analytic compo-nents of our system to compare the impact of dif-ferent feature sets and tune processing settings to improve relevance tagging quality.
2 Related work
Corpus annotation tools are plentiful in NLP re-search: brat (Stenetorp et al., 2012) and Know-tator (Ogren, 2006) being two heavily used ex-amples among many. However, the primary pur-pose of these tools is to streamlinemanual anno-tation by experts, and to support review and revi-sion of manual annotations. Some tools, including brat, support automated pre-annotation, but analy-sis of these annotations and corpus exploration is not commonly included. Other tools, such as Sci-KnowMine,1use automated techniques for triage, but for routing to experts for curation rather than ranking and model analysis. Document ranking and search engines such as Apache Lucene,2 by contrast, can be overly fully-featured for early-stage analysis of new datasets, and do not directly offer tools for annotation and post-processing.
Early efforts towards extracting mobility infor-mation have illustrated that it is often syntactically
1
https://www.isi.edu/projects/ sciknowmine/overview
SpaCy WordPiece
Num documents 400
[image:2.595.315.517.62.153.2]Avg tokens per doc 537 655 Avg mobility tokens per doc 97 112 Avg mobility segments per doc 9.2
Table 1: Statistics for dataset of mobility information, using SpaCy and WordPiece tokenization.
and semantically complex, and difficult to ex-tract reliably (Newman-Griffis and Zirikly, 2018; Newman-Griffis et al., 2019). Some characteriza-tion of mobility-related terms has been performed as part of larger work on functioning (Skube et al., 2018), but a lack of standardized terminologies limits the utility of vocabulary-driven clinical NLP tools such as CLAMP (Soysal et al., 2018) or cTAKES (Savova et al., 2010). Thus, it forms a useful test case for HARE.
3 System Description
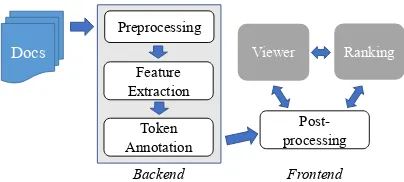
Our system has three stages for analyzing docu-ment sets, illustrated in Figure 1. First, data anno-tated by experts for token relevance can be used to train relevance tagging models, and trained mod-els can be applied to produce relevance scores on new documents (Section 3.1). Second, we pro-vide configurable post-processing tools for clean-ing and smoothclean-ing relevance scores (Section 3.2). Finally, our system includes interfaces for review-ing detailed relevance output, rankreview-ing documents by their relevance to the target criterion, and an-alyzing qualitative outcomes of relevance scoring output (Sections 3.3-3.5); all of these interfaces al-low interactive re-configuration of post-processing settings and switching between output relevance scores from different models for comparison.
For our experiments on mobility information, we use an extended version of the dataset de-scribed by Thieu et al. (2017), which consists of 400 English-language Physical Therapy initial as-sessment and reasas-sessment notes from the Reha-bilitation Medicine Department of the NIH Clin-ical Center. These text documents have been an-notated at the token level for descriptions and as-sessments of patient mobility status. Further in-formation on this dataset is given in Table 1. We use ten-fold cross validation for our experiments, splitting into folds at the document level.
3.1 Relevance tagging workflow
All hyperparameters discussed in this section were tuned on held-out development data in
cross-Docs
Backend
Preprocessing
Feature Extraction
Token Annotation
Post-processing Viewer Ranking
[image:2.595.75.287.63.112.2]Frontend
Figure 1: HARE workflow for working with a set of documents; outlined boxes indicate automated compo-nents, and gray boxes signify user interfaces.
validation experiments. We report the best settings here, and provide full comparison of hyperparam-eter settings in the online supplements.3
3.1.1 Preprocessing
Different domains exhibit different patterns in to-ken and sentence structure that affect preprocess-ing. In clinical text, tokenization is not a consen-sus issue, and a variety of different tokenizers are used regularly (Savova et al., 2010; Soysal et al., 2018). As mobility information is relatively un-explored, we relied on general-purpose tokeniza-tion with spaCy (Honnibal and Montani, 2017) as our default tokenizer, and WordPiece (Wu et al., 2016) for experiments using BERT. We did not ap-ply sentence segmentation, as clinical toolkits of-ten produced short segments that interrupted mo-bility information in our experiments.
3.1.2 Feature extraction
Our system supports feature extraction for indi-vidual tokens in input documents using both static and contextualized word embeddings.
Static embeddings Using static (i.e., non-contextualized) embeddings, we calculate input features for each token as the mean embedding of the token and 10 words on each side (truncated at sentence/line breaks). We used FastText (Bo-janowski et al., 2017) embeddings trained on a 10-year collection of physical and occupational ther-apy records from the NIH Clinical Center.
ELMo (Peters et al., 2018) ELMo features are calculated for each token by taking the hidden states of the two bLSTM layers and the token layer, multiplying each vector by learned weights, and summing to produce a final embedding. Com-bination weights are trained jointly with the token annotation model. We used a 1024-dimensional
Figure 2: Precision, recall, and F-2 when varying bi-narization threshold from 0 to 1, using ELMo embed-dings. The threshold corresponding to the best F-2 is marked with a dotted vertical line.
ELMo model pretrained on PubMed data4for our mobility experiments.
BERT(Devlin et al., 2019) For BERT features, we take the hidden states of the finalk layers of the model; as with ELMo embeddings, these out-puts are then multiplied by a learned weight vec-tor, and the weighted layers are summed to cre-ate the final embedding vectors.5 We used the 768-dimensional clinicalBERT (Alsentzer et al., 2019) model6 in our experiments, extracting fea-tures from the last 3 layers.
3.1.3 Automated token-level annotation
We model the annotation process of assigning a relevance score for each token using a feed-forward deep neural network that takes embedding features as input and produces a binomial softmax distribution as output. For mobility information, we used a DNN with three 300-dimensional hid-den layers, relu activation, and 60% dropout.
As shown in Table 1, our mobility dataset is considerably imbalanced between relevant and ir-relevant tokens. To adjust for this balance, for each epoch of training, we used all of the rele-vant tokens in the training documents, and sam-pled irrelevant tokens at a 75% ratio to produce a more balanced training set; negative points were re-sampled at each epoch. As token predictions are conditionally independent of one another given the embedding features, we did not maintain any sequence in the samples drawn. Relevant samples were weighted at a ratio of 2:1 during training.
After each epoch, we evaluate the model on all tokens in a held-out 10% of the documents, and calculate F-2 score (preferring recall over preci-sion) using 0.5 as the binarization threshold of model output. We use an early stopping
thresh-4
https://allennlp.org/elmo
5Note that as BERT is constrained to use WordPiece
tok-enization, it may use slightly longer token sequences than the other methods.
6https://github.com/EmilyAlsentzer/
clinicalBERT
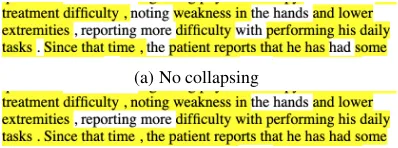
(a) No collapsing
(b) Collapse one blank
Figure 3: Collapsing adjacent segments illustration.
old of 1e-05 on this F-2 score, with a patience of 5 epochs and a maximum of 50 epochs of training.
3.2 Post-processing methods
Given a set of token-level relevance annotations, HARE provides three post-processing techniques for analyzing and improving annotation results.
Decision thresholdingThe threshold for bina-rizing token relevance scores is configurable be-tween 0 and 1, to support more or less conservative interpretation of model output; this is akin to ex-ploring the precision/recall curve. Figure 2 shows precision, recall, and F-2 for different threshold-ing values from our mobility experiments, usthreshold-ing scores from ELMo embeddings.
Collapsing adjacent segments We consider any contiguous sequence of tokens with scores at or above the binarization threshold to be a relevant segment. As shown in Figure 3, multiple segments may be interrupted by irrelevant tokens such as punctuation, or by noisy relevance scores falling below the binarization threshold. As multiple ad-jacent segments may inflate a document’s overall relevance, our system includes a setting to collapse any adjacent segments that are separated byk or fewer tokens into a single segment.
Viterbi smoothing By modeling token-level decisions as conditionally independent of one an-other given the input features, we avoid assump-tions of strict segment bounds, but introduce some noisy output, as shown in Figure 4. To reduce
(a) Without smoothing
(b) With smoothing
[image:3.595.81.283.63.117.2]Figure 5: Annotation viewer interface.
some of this noise, we include an optional smooth-ing component based on the Viterbi algorithm.
We model the “relevant”/“irrelevant” state se-quence discriminatively, using annotation model outputs as state probabilities for each timestep, and calculate the binary transition probability ma-trix by counting transitions in the training data. We use these estimates to decode the most likely relevance state sequenceRfor a tokenized lineT
in an input document, along with the correspond-ing path probability matrixW, whereWj,idenotes the likelihood of being in state j at timei given
ri−1andti. In order to produce continuous scores
for each token, we then backtrace throughR and assign scoresito tokentias the conditional prob-ability thatriis “relevant”, givenri−1. LetQj,ibe the likelihood of transitioning from state Ri−1 to
j, conditioned onTi, as:
Qj,i =
Wj,i
WRi−1,i−1
(1)
The final conditional probability si is calculated by normalizing over possible states at timei:
si =
Q1,i
Q0,i+Q1,i
(2)
These smoothed scores can then be binarized us-ing the configurable decision threshold.
3.3 Annotation viewer
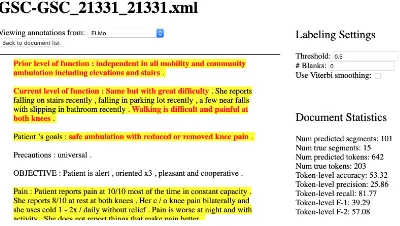
Annotations on any individual document can be viewed using a web-based interface, shown in Fig-ure 5. All tokens with scores at or above the de-cision threshold are highlighted in yellow, with each contiguous segment shown in a single high-light. Configuration settings for post-processing methods are provided, and update the displayed annotations when changed. On click, each token will display the score assigned to it by the anno-tation model after post-processing. If the docu-ment being viewed is labeled with gold
annota-Figure 6: Ranking interface.
tions, these are shown in bold red text. Addition-ally, document-level summary statistics and eval-uation measures, with current post-processing, are displayed next to the annotations.
3.4 Document set ranking
3.4.1 Ranking methods
Relevance scoring methods are highly task-dependent, and may reflect different priorities such as information density or diversity of infor-mation returned. In this system, we provide three general-purpose relevance scorers, each of which operates after any post-processing.
Segments+Tokens Documents are scored by multiplying their number of relevant segments by a large constant and adding the number of relevant tokens to break any ties by segment count. As rel-evant information may be sparse, no normalization by document length is used.
SumScoresDocuments are scored by summing the continuous relevance scores assigned to all of their tokens. As with the Segments+Tokens scorer, no adjustment is made for document length.
DensityDocument scores are the ratio of bina-rized relevant tokens to total number of tokens.
The same scorer can be used to rank gold anno-tations and model annoanno-tations, or different scorers can be chosen. Ranking quality is evaluated using Spearman’sρ, which ranges from -1 (exact oppo-site ranking) to +1 (same ranking), with 0 indicat-ing no correlation between rankindicat-ings. We use Seg-ments+Tokens as default; a comparison of ranking methods is in the online supplements.
3.4.2 Ranking interface
[image:4.595.82.282.67.180.2]Rank-Embeddings Smoothing Annotation Ranking
Pr Rec F-2 ρ
Static No 59.0 94.7 84.4 0.862
Yes 60.5 93.7 84.3 0.899
ELMo No 60.2 94.1 84.4 0.771
Yes 66.5 91.4 84.8 0.886
BERT No 55.3 93.8 82.2 0.689
[image:5.595.82.280.62.144.2]Yes 62.3 90.8 84.3 0.844
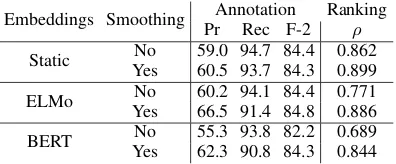
Table 2: Annotation and ranking evaluation results on mobility documents, using three embedding sources. Results are given with and without Viterbi smooth-ing, using binarization threshold=0.5 and no collaps-ing of adjacent segments. Pr=precision, Rec=recall,
ρ=Spearman’s ρ Pr/Rec/F2 are macro-averaged over folds,ρis over all test predictions.
ing methods used for model scores and gold an-notations (when present) can be adjusted inde-pendently, and our post-processing methods (Sec-tion 3.2) can also be adjusted to affect ranking.
3.5 Qualitative analysis tools
We provide a set of three tools for performing qualitative analysis of annotation outcomes. The first measures lexicalization of each unique token in the dataset with respect to relevance score, by averaging the assigned relevance score (with or without smoothing) for each instance of each to-ken. Tokens with a frequency below a config-urable minimum threshold are excluded.
Our other tools analyze the aggregate relevance score patterns in an annotation set. For labeled data, as shown in Figure 2, we provide a visual-ization of precision, recall, and F-2 when vary-ing the binarization threshold, includvary-ing identify-ing the optimal threshold with respect to F-2. We also include a label-agnostic analysis of patterns in output relevance scores, illustrated in Figure 7, as a way to evaluate the confidence of the annotator. Both of these tools are provided at the level of an annotation set and individual documents.
3.6 Implementation details
[image:5.595.315.518.62.174.2]Our automated annotation, post-processing, and document ranking algorithms are implemented in Python, using the NumPy and Tensorflow li-braries. Our demonstration interface is imple-mented using the Flask library, with all backend logic handled separately in order to support mod-ularity of the user interface.
Figure 7: Distribution of token relevance scores on mo-bility data: (a) word2vec, (b) ELMo, and (c) BERT.
4 Results on mobility
Table 2 shows the token-level annotation and doc-ument ranking results for our experiments on mo-bility information. Static and contextualized em-bedding models performed equivalently well on token-level annotations; BERT embeddings actu-ally underperformed static embeddings and ELMo on both precision and recall. Interestingly, static embeddings yielded the best ranking performance of ρ = 0.862, compared to 0.771 with ELMo and0.689with BERT. Viterbi smoothing makes a minimal difference in token-level tagging, but in-creases ranking performance considerably, partic-ularly for contextualized models. It also produces a qualitative improvement by trimming out extra-neous tokens at the start of several segments, as reflected by the improvements in precision.
The distribution of token scores from each model (Figure 7) shows that all three embedding models yielded a roughly bimodal distribution, with most scores in the ranges[0,0.2]or[0.7,1.0].
5 Discussion
Though our system is designed to address differ-ent needs from other NLP annotation tools, com-ponents such as annotation viewing are also ad-dressed in other established systems. Our imple-mentation decouples backend analysis from the front-end interface; in future work, we plan to add support for integrating our annotation and ranking systems into existing platforms such as brat. Our tool can also easily be extended to both multi-class and multilabel applications; for a detailed discus-sion, see the online supplements.
However, these decisions are highly task-specific, and are an important focus for designing ranking utility within specific domains.
6 Conclusions
We introduced HARE, a supervised system for highlighting relevant information and interactive exploration of model outcomes. We demonstrated its utility in experiments with clinical records an-notated for narrative descriptions of mobility sta-tus. We also provided qualitative analytic tools for understanding the outcomes of different an-notation models. In future work, we plan to extend these analytic tools to provide rationales for individual token-level decisions. Additionally, given the clear importance of contextual informa-tion in token-level annotainforma-tions, the static transiinforma-tion probabilities used in our Viterbi smoothing tech-nique are likely to degrade its effect on the out-put. Adding support for dynamic, contextualized estimations of transition probabilities will provide more fine-grained modeling of relevance, as well as more powerful options for post-processing.
Our system is available online at https:// github.com/OSU-slatelab/HARE/. This research was supported by the Intramural Re-search Program of the National Institutes of Health and the US Social Security Administration.
References
Emily Alsentzer, John Murphy, William Boag, Wei-Hung Weng, Di Jindi, Tristan Naumann, and Matthew McDermott. 2019. Publicly Available Clinical BERT Embeddings. InClinical NLP Work-shop, pages 72–78. ACL.
Piotr Bojanowski, Edouard Grave, Armand Joulin, and Tomas Mikolov. 2017. Enriching Word Vectors with Subword Information.TACL, 5:135–146.
Jacob Devlin, Ming-Wei Chang, Kenton Lee, and Kristina Toutanova. 2019. Bert: Pre-training of deep bidirectional transformers for language understand-ing. InNAACL-HLT, pages 4171–4186. ACL.
Ingrid E Fisher, Margaret R Garnsey, and Mark E Hughes. 2016. Natural Language Processing in Ac-counting, Auditing and Finance: A Synthesis of the Literature with a Roadmap for Future Research. In-telligent Systems in Accounting, Finance and Man-agement, 23(3):157–214.
Matthew Honnibal and Ines Montani. 2017. spaCy 2: Natural language understanding with Bloom embed-dings, convolutional neural networks and incremen-tal parsing. To appear.
Denis Newman-Griffis and Ayah Zirikly. 2018. Em-bedding Transfer for Low-Resource Medical Named Entity Recognition: A Case Study on Patient Mobil-ity. InBioNLP, pages 1–11. ACL.
Denis Newman-Griffis, Ayah Zirikly, Guy Divita, and Bart Desmet. 2019. Classifying the reported ability in clinical mobility descriptions. InBioNLP.
Philip V Ogren. 2006. Knowtator: A Prot´eg´e plug-in for annotated corpus construction. InNAACL-HLT, pages 273–275, New York City, USA. ACL.
Matthew E Peters, Mark Neumann, Mohit Iyyer, Matt Gardner, Christopher Clark, Kenton Lee, and Luke Zettlemoyer. 2018. Deep Contextualized Word Rep-resentations. In NAACL-HLT, pages 2227–2237, New Orleans, Louisiana. ACL.
S Trent Rosenbloom, Joshua C Denny, Hua Xu, Nancy Lorenzi, William W Stead, and Kevin B Johnson. 2011. Data from clinical notes: a perspective on the tension between structure and flexible documenta-tion. JAMIA, 18(2):181–186.
Guergana K Savova, James J Masanz, Philip V Ogren, Jiaping Zheng, Sunghwan Sohn, Karin C Kipper-Schuler, and Christopher G Chute. 2010. Mayo clin-ical Text Analysis and Knowledge Extraction Sys-tem (cTAKES): architecture, component evaluation and applications. JAMIA, 17(5):507–513.
Steven J Skube, Elizabeth A Lindemann, Elliot G Arsoniadis, Mari Akre, Elizabeth C Wick, and Genevieve B Melton. 2018. Characterizing Func-tional Health Status of Surgical Patients in Clini-cal Notes. InAMIA Joint Summits, pages 379–388. AMIA.
Ergin Soysal, Jingqi Wang, Min Jiang, Yonghui Wu, Serguei Pakhomov, Hongfang Liu, and Hua Xu. 2018. CLAMP – a toolkit for efficiently build-ing customized clinical natural language processbuild-ing pipelines.JAMIA, 25(3):331–336.
Pontus Stenetorp, Sampo Pyysalo, Goran Topi´c, Tomoko Ohta, Sophia Ananiadou, and Jun’ichi Tsu-jii. 2012. brat: a Web-based Tool for NLP-Assisted Text Annotation. InEACL, pages 102–107. ACL.
Jane Taggart, Siaw-Teng Liaw, and Hairong Yu. 2015. Structured data quality reports to improve EHR data quality. Int J Med Info, 84(12):1094–1098.
Thanh Thieu, Jonathan Camacho, and Pei-Shu Ho et al. 2017. Inductive identification of functional sta-tus information and establishing a gold standard cor-pus: A case study on the Mobility domain. InBIBM, pages 2300–2302. IEEE.
Yonghui Wu, Mike Schuster, and Zhifeng Chen et
al. 2016. Google’s Neural Machine
Transla-tion System: Bridging the Gap between