Topic-wise, Sentiment-wise, or Otherwise?
Identifying the Hidden Dimension for Unsupervised Text Classification
Sajib Dasgupta and Vincent Ng Human Language Technology Research Institute
University of Texas at Dallas Richardson, TX 75083-0688
{sajib,vince}@hlt.utdallas.edu
Abstract
While traditional work on text clustering has largely focused on grouping docu-ments by topic, it is conceivable that a user may want to cluster documents along other dimensions, such as the author’s mood, gender, age, or sentiment. Without know-ing the user’s intention, a clusterknow-ing al-gorithm will only group documents along the most prominent dimension, which may not be the one the user desires. To ad-dress this problem, we propose a novel way of incorporating user feedback into a clustering algorithm, which allows a user to easily specify the dimension along which she wants the data points to be clus-tered via inspecting only a small number of words. This distinguishes our method from existing ones, which typically re-quire a large amount of effort on the part of humans in the form of document an-notation or interactive construction of the feature space. We demonstrate the viabil-ity of our method on several challenging sentiment datasets.
1 Introduction
Text clustering is one of the most important appli-cations in Natural Language Processing (NLP). A common approach to this problem consists of (1) computing the similarity between each pair of doc-uments, each of which is typically represented as a bag of words; and (2) using an unsupervised clus-tering algorithm to partition the documents. The majority of existing work on text clustering has focused on topic-based clustering, where high ac-curacies can be achieved even for datasets with a large number of classes (e.g., 20 Newsgroups).
On the other hand, there has been relatively lit-tle work on sentiment-based clustering and the re-lated task of unsupervised polarity classification,
where the goal is to cluster (or classify) a set of documents (e.g., reviews) according to the po-larity (e.g., “thumbs up” or “thumbs down”) ex-pressed by the author in an unsupervised man-ner. Despite the large amount of recent work on sentiment analysis and opinion mining, much of it has focused on supervised methods (e.g., Pang et al. (2002), Kim and Hovy (2004), Mullen and Collier (2004)). One weakness of these existing supervised polarity classification systems is that they are typically domain- and language-specific. Hence, when given a new domain or language, one needs to go through the expensive process of collecting a large amount of annotated data in or-der to train a high-performance polarity classifier. Some recent attempts have been made to leverage existing sentiment corpora or lexica to automati-cally create annotated resources for new domains or languages. However, such methods require the existence of either a parallel corpus/machine translation engine for projecting/translating anno-tations/lexica from a resource-rich language to the target language (Banea et al., 2008; Wan, 2008), or a domain that is “similar” enough to the target domain (Blitzer et al., 2007). When the target do-main or language fails to meet this requirement, sentiment-based clustering or unsupervised polar-ity classification become appealing alternatives. Unfortunately, to our knowledge, these tasks are largely under-investigated in the NLP community. Turney’s (2002) work is perhaps one of the most notable examples of unsupervised polarity classi-fication. However, while his system learns the se-mantic orientation of the phrases in a review in an unsupervised manner, this information is used to predict the polarity of a review heuristically.
Despite its practical significance, sentiment-based clustering is a challenging task. To illus-trate its difficulty, consider the task of clustering a set of movie reviews. Since each review may contain a description of the plot and the author’s
sentiment, a clustering algorithm may cluster re-views along either the plot dimension or the
senti-ment dimension; and without knowing the user’s
intention, they will be clustered along the most
prominent dimension. Assuming the usual
bag-of-words representation, the most prominent di-mension will more likely be plot, as it is not un-common for a review to be devoted almost exclu-sively to the plot, with the author briefly express-ing her sentiment only at the end of the review. Even if the reviews contain mostly subjective ma-terial, the most prominent dimension may still not be sentiment, due to the fact that many reviews are
sentimentally ambiguous. Specifically, a reviewer
may have negative opinions on the actors but at the same time talk enthusiastically about how much she enjoyed the plot. The presence of both posi-tive and negaposi-tive sentiment-bearing words in these reviews renders the sentiment dimension hidden (i.e., less prominent) as far as clustering is con-cerned. Therefore, there is no guarantee that the clustering algorithm will automatically produce a sentiment-based clustering of the reviews.
Hence, it is important for a user to provide feed-back on the clustering process to ensure that the reviews are clustered along the sentiment dimen-sion, possibly in an interactive manner. One way to do this would be to ask the user to annotate a small number of reviews with polarity infor-mation, possibly through an active learning pro-cedure to minimize human intervention (Dredze and Crammer, 2008). Another way would be to have the user explicitly identify the relevant fea-tures (in our case, the sentiment-bearing words) at the beginning of the clustering process (Liu et al., 2004), or incrementally construct the set of rele-vant features in an interactive fashion (Bekkerman et al., 2007; Raghavan and Allan, 2007; Roth and Small, 2009). In addition, the user may supply constraints on which pairs of documents must or must not appear in the same cluster (Wagstaff et al., 2001), or simply tell the algorithm whether two clusters should be merged or split during the clustering process (Balcan and Blum, 2008). It is worth noting that many of these feedback mech-anisms were developed by machine learning re-searchers for general clustering tasks and not for sentiment-based clustering.
Our goal in this paper is to propose a novel mechanism allowing a user to cluster a set of docu-ments along the desired dimension, which may be
a hidden dimension, with very limited user back. In comparison to the aforementioned feed-back mechanisms, ours is arguably much simpler: we only require that the user select a dimension by examining a small number of features for each dimension, as opposed to having the user
gener-ate the feature space in an interactive manner or identify clusters that need to be merged or split. In
particular, identifying clusters for merging or split-ting in Balcan and Blum’s algorithm may not be as easy as it appears: for each MERGE orSPLIT de-cision the user makes, she has to sample a large number of documents from the cluster(s), read through the documents, and base her decision on the extent to which the documents are (dis)similar to each other. Perhaps more importantly, our hu-man experiments involving five users indicate that all of them can easily identify the sentiment di-mension based on the features, thus providing sug-gestive evidence that our method is viable.
In sum, our contributions in this paper are three-fold. First, we propose a novel feedback mecha-nism for clustering allowing a user to easily spec-ify the dimension along which she wants data points to be clustered and apply the mechanism to the challenging, yet under-investigated problem of sentiment-based clustering. Second, spectral learning, which is the core of our method, has not been applied extensively to NLP problems, and we hope that our work can increase the awareness of this powerful machine learning technique in the NLP community. Finally, we demonstrate the via-bility of our method not only by evaluating its per-formance on sentiment datasets, but also via a set of human experiments, which is typically absent in papers that involve algorithms for incorporating user feedback.
The rest of the paper is organized as follows. Section 2 presents the basics of spectral clustering, which will facilitate the discussion of our feedback mechanism in Section 3. We describe our human experiments and evaluation results on several sen-timent datasets in Section 4, and present our con-clusions in Section 5.
2 Spectral Clustering
that are not linearly separable in the given feature space (e.g., see Dhillon et al. (2004) and Cai et al. (2005)). Spectral clustering algorithms were de-veloped in response to this problem withk-means. The central idea behind spectral clustering is to (1) construct a low-dimensional space from the original (typically high-dimensional) space while retaining as much information about the original space as possible, and (2) cluster the data points in this low-dimensional space. The rest of this sec-tion provides the details of spectral clustering.
2.1 Algorithm
Although there are several well-known spectral clustering algorithms in the literature (e.g., Weiss (1999), Shi and Malik (2000), Kannan et al. (2004)), we adopt the one proposed by Ng et al. (2002), as it is arguably the most widely-used. The algorithm takes as input a similarity matrixS cre-ated by applying a user-defined similarity function to each pair of data points. Below are the main steps of the algorithm:
1. Create the diagonal matrix D whose (i,i )-th entry is )-the sum of )-the i-th row of S, and then construct the Laplacian matrixL=
D−1/2SD−1/2.
2. Find the eigenvalues and eigenvectors ofL. 3. Create a new matrix from themeigenvectors
that correspond to themlargest eigenvalues.1 4. Each data point is now rank-reduced to a point in them-dimensional space. Normal-ize each point to unit length (while retaining the sign of each value).
5. Cluster the resulting data points using k -means.
In essence, each dimension in the reduced space is defined by exactly one eigenvector. The reason why eigenvectors with large eigenvalues are used is that they capture the largest variance in the data. As a result, each of them can be thought of as re-vealing an important dimension of the data.
2.2 Clustering with Eigenvectors
As Ng et al. (2002) point out, “different authors still disagree on which eigenvectors to use, and how to derive clusters from them”. There are two common methods for deriving clusters using the eigenvectors. These methods will serve as our baselines in our evaluation.
1For brevity, we will refer to the eigenvector with then-th largest eigenvalue simply as then-th eigenvector.
Method 1: Using the second eigenvector only The first method is to use only the second eigen-vector, e2, to partition the points. Besides reveal-ing one of the most important dimensions of the data, this eigenvector induces an intuitively ideal partition of the data — the partition induced by the minimum normalized cut of the similarity graph2, where the nodes are the data points and the edge weights are the pairwise similarity values of the points (Shi and Malik, 2000). Clustering in a one-dimensional space is trivial: since we have a lin-earization of the points, all we need to do is to determine a threshold for partitioning the points. However, we follow Ng et al. (2002) and cluster using 2-means in this one-dimensional space.
Method 2: Usingmeigenvectors
Recall from Section 2.1 that after eigen-decomposing the Laplacian matrix, each data point is represented by m co-ordinates. In the second method, we simply use 2-means to cluster the data points in this m-dimensional space, effectively exploiting all of themeigenvectors.
3 Our Approach
As mentioned before, sentiment-based clustering is challenging, in part due to the fact that the re-views can be clustered along more than one di-mension. In this section, we propose and incor-porate a user feedback mechanism into a spec-tral clustering algorithm, which makes it easy for a user to specify the dimension along which she wants to cluster the data points.
Recall that our method first applies spectral clustering to reveal the most important dimensions of the data, and then lets the user select the de-sired dimension. To motivate the importance of user feedback, it helps to understand why the two baseline clustering algorithms described in Sec-tion 2.2, which are also based on spectral meth-ods but do not rely on user feedback, may not al-ways yield a sentiment-based clustering. To be-gin with, consider the first method, where only the second eigenvector is used to induce the par-tition. Recall that the second eigenvector reveals the most prominent dimension of the data. Hence, if sentiment is not the most prominent dimension (which can happen if the non-sentiment-bearing
2Using the normalized cut (as opposed to the usual cut)
words outnumber the sentiment-bearing words in the bag-of-words representation of a review), then the resulting clustering of the reviews may not be sentiment-oriented. A similar line of reasoning can be used to explain why the second baseline clustering algorithm, which clusters based on all of the eigenvectors in the low-dimensional space, may not always work well. Since each eigenvector corresponds to a different dimension (and, in par-ticular, some of them correspond to non-sentiment dimensions), using all of them to represent a re-view may hamper the accurate computation of the similarity of two reviews as far as clustering along the sentiment dimension is concerned. In the rest of this section, we discuss the major steps of our user-feedback mechanism in detail.
Step 1: Identify the important dimensions To identify the important dimensions of the given reviews, we take the top eigenvectors computed from the eigen-decomposition of the Laplacian matrix, which is in turn formed from the input sim-ilarity matrix. We compute the simsim-ilarity between two reviews by taking the dot product of their fea-ture vectors (see Section 4.1 for details on feafea-ture vector generation). Following Ng et al., we set the diagonal entries of the similarity matrix to 0.
Step 2: Identify the relevant features
Given the eigen-decomposition from Step 1, we first obtain the second through the fifth eigenvec-tors3, which as mentioned above, correspond to the most important dimensions of the data. Then, we ask the user to select one of the four dimen-sions defined by these eigenvectors according to their relevance to sentiment. One way to do this is to (1) induce one partition of the reviews from each of the four eigenvectors, using a procedure identical to Method 1 in Section 2.2, and (2) have the user inspect the four partitions and decide which corresponds most closely to a sentiment-based clustering. The main drawback associated with this kind of user feedback is that the user may have to read a large number of reviews in order to make a decision. Hence, to reduce human effort, we employ an alternative procedure: we (1) iden-tify the most informative features for characteriz-ing each partition, and (2) have the user inspect just the features rather than the reviews.
While traditional feature selection techniques such as log-likelihood ratio and information
3The first eigenvector is not used because it is a constant
vector, meaning that it cannot be used to partition the data.
gain can be applied to identify these informa-tive features (see Yang and Pedersen (1997) for an overview), we employ a more sophisti-cated feature-ranking method that we call
max-imum margin feature ranking (MMFR). Recall
that a maximum margin classifier (e.g., a support vector machine) separates data points from two classes while maximizing the margin of separa-tion. Specifically, a maximum margin hyperplane is defined by w · x − b = 0, where x is a fea-ture vector representing an arbitrary data point, and w (a weight vector) and b (a scalar) are pa-rameters that are learned by solving the following constrained optimization problem:
arg min 12kwk2+CX
i
ξi
subject to
ci(w·xi−b)≥1−ξi, 1≤i≤n, whereci ∈ {+1,−1}is the class of thei-th train-ing point xi, ξi is the degree of misclassification of xi, andCis a regularization parameter that bal-ances training error and model complexity.
We use w to identify the most informative fea-tures for a partition. Note that a feature with a large positive weight is strongly indicative of the positive class, whereas a feature with a large neg-ative weight is strongly indicneg-ative of the negneg-ative class. In other words, the most informative fea-tures are those with large absolute weight values. We exploit this observation and identify the most informative features for a partition by (1) training an SVM classifier4 on the partition, where data points in the same cluster belong to the same class; (2) sorting the features according to the SVM-learned feature weights; and (3) generating two ranked lists of informative features using the top and bottom 100 features, respectively.
Given the ranked lists generated for each of the four partitions, the user will select one of the parti-tions/dimensions as most relevant to sentiment by inspecting as many features in the ranked lists as needed. After picking the most relevant dimen-sion, the user will label one of the two feature lists associated with this dimension as POSITIVE and
the other as NEGATIVE. Since each feature list represents one of the clusters, the cluster associ-ated with the positive list is labeledPOSITIVEand
4All the SVM classifiers in this paper are trained using
the cluster associated with the negative list is la-beledNEGATIVE.
In comparison to existing user feedback mech-anisms for assisting a clustering algorithm, ours requires comparatively little human intervention: we only require that the user select a dimension by examining a small number of features, as opposed to having the user construct the feature space or identify clusters that need to be merged or split as is required with other methods.
Step 3: Identify the unambiguous reviews There is a caveat, however. As mentioned in the introduction, many reviews contain both positive and negative sentiment-bearing words. These am-biguous reviews are more likely to be clustered incorrectly than their unambiguous counterparts. Now, since the ranked lists of features are derived from the partition, the presence of these ambigu-ous reviews can adversely affect the identification of informative features using MMFR. As a result, we remove the ambiguous reviews before deriving informative features from a partition.
We employ a simple method for identifying un-ambiguous reviews. In the computation of eigen-values, each data point factors out the orthogo-nal projections of each of the other data points with which they have an affinity. Ambiguous data points receive the orthogonal projections from both the positive and negative data points, and hence they have near zero values in the pivot eigenvectors. We exploit this important informa-tion. The basic idea is that the data points with near zero values in the eigenvectors are more am-biguous than those with large absolute values. As a result, we posit 250 reviews from each cluster whose corresponding values in the eigenvector are farthest away from zero as unambiguous, and in-duce the ranked list of features only from the re-sulting 500 unambiguous reviews.5
Step 4: Cluster along the selected dimension Finally, we employ the 2-means algorithm to clus-ter all the reviews along the dimension (i.e., the eigenvector) selected by the user, regardless of whether a review is ambiguous or not.
5
Note that 500 is a somewhat arbitrary choice. Under-lying this choice is our assumption that a fraction of the re-views is unambiguous. As we will see in the evaluation sec-tion, these 500 reviews can be classified with a high accuracy; consequently, the features induced from the resulting clus-ters are also of high quality. Additional experiments reveal that the list of top-ranking features does not change signifi-cantly when induced from a smaller number of unambiguous reviews.
4 Evaluation
4.1 Experimental Setup
Datasets. We use five sentiment classification datasets, including the widely-used movie review dataset [MOV] (Pang et al., 2002) as well as four datasets containing reviews of four different types of products from Amazon [books (BOO), DVDs (DVD), electronics (ELE), and kitchen appliances (KIT)] (Blitzer et al., 2007). Each dataset has 2000 labeled reviews (1000 positives and 1000 negatives). To illustrate the difference between topic-based clustering and sentiment-based clus-tering, we will also show topic-based clustering results on POL, a dataset created by taking all the documents from two sections of 20 Newsgroups, namely,sci.cryptandtalks.politics.
To preprocess a document, we first tokenize and downcase it, and then represent it as a vector of unigrams, using frequency as presence. In ad-dition, we remove from the vector punctuation, numbers, words of length one, and words that oc-cur in only a single review. Following the common practice in the information retrieval community, we also exclude words with high document fre-quency, many of which are stopwords or domain-specific general-purpose words (e.g., “movies” in the movie domain). A preliminary examination of our evaluation datasets reveals that these words typically comprise 1–2% of a vocabulary. The de-cision of exactly how many terms to remove from each dataset is subjective: a large corpus typically requires more removals than a small corpus. To be consistent, we simply sort the vocabulary by doc-ument frequency and remove the top 1.5%.
Evaluation metrics. We employ two evaluation metrics. First, we report results in terms of the ac-curacy achieved on the 2000 labeled reviews for each dataset. Second, following Kamvar et al. (2003), we evaluate the clusters produced by our approach against the gold-standard clusters using the Adjusted Rand Index (ARI). ARI ranges from –1 to 1; better clusterings have higher ARI values.
4.2 Baseline Systems
Accuracy Adjusted Rand Index
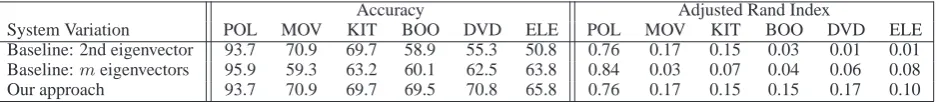
[image:6.595.75.545.63.114.2]System Variation POL MOV KIT BOO DVD ELE POL MOV KIT BOO DVD ELE Baseline: 2nd eigenvector 93.7 70.9 69.7 58.9 55.3 50.8 0.76 0.17 0.15 0.03 0.01 0.01 Baseline:meigenvectors 95.9 59.3 63.2 60.1 62.5 63.8 0.84 0.03 0.07 0.04 0.06 0.08 Our approach 93.7 70.9 69.7 69.5 70.8 65.8 0.76 0.17 0.15 0.15 0.17 0.10
Table 1: Results in terms of accuracy and Adjusted Rand Index for the six datasets.
shown in row 1 of Table 1.6 As we can see, this baseline achieves an accuracy of 90% on POL, but a much lower accuracy (of 50–70%) on the sen-timent datasets. The same performance trend can be observed with ARI. These results provide sup-port for the claim that sentiment-based clustering is more difficult than topic-based clustering.
In addition, it is worth noting that the base-line achieves much lower accuracies and ARI val-ues on BOO, DVD, and ELE than on the re-maining two sentiment datasets. Since e2 cap-tures the most prominent dimension, these results suggest that sentiment dimension is not the most prominent dimension in these three datasets. In fact, this is intuitively plausible. For instance, in the book domain, positive book reviews typ-ically contain a short description of the content, with the reviewer only briefly expressing her sen-timent somewhere in the review. Similarly for the electronics domain: electronic product reviews are typically aspect-oriented, with the reviewer talk-ing about the pros and cons of each aspect of the product (e.g., battery, durability). Since the re-views are likely to contain both positive and nega-tive sentiment-bearing words, the sentiment-based clustering is unlikely to be captured by e2.
Clustering using top five eigenvectors. As our second baseline, we represent each data point using the top five eigenvectors (i.e., e1 through e5), and cluster them using 2-means in this 5-dimensional space, as described in Section 2.2. Hence, this can be thought of as an “ensemble” approach, where the clustering decision is collec-tively made by the five eigenvectors.
Results are shown in row 2 of Table 1. In comparison to the first baseline, we see improve-ments in accuracy and ARI for the three datasets on which the first baseline performs poorly (i.e., BOO, DVD, and ELE), with the most drastic improvement observed on ELE. On the other hand, performance on the remaining two
senti-6Owing to the randomness in the choice of seeds for
means, these and all other experimental results involving 2-means are averaged over ten independent runs.
ment datasets deteriorates. These results can be attributed to the fact that for BOO, DVD, and ELE, e2does not capture the sentiment dimension, but since some other eigenvector in the ensemble does, we see improvements. On the other hand, e2 has already captured the sentiment dimension in MOV and KIT; as a result, employing additional dimensions, which may not be sentiment-related, may only introduce noise into the computation of the similarities between the reviews.
4.3 Our Approach
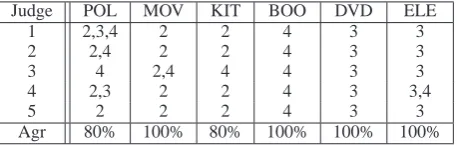
Human experiments. Unlike the two baselines, our approach requires users to specify which of the four dimensions (defined by the second through fifth eigenvectors) are most closely related to sen-timent by inspecting a set of features derived from the unambiguous reviews for each dimension us-ing MMFR. To better understand how easy it is for a human to select the desired dimension given the features, we performed the experiment inde-pendently with five humans (all of whom are com-puter science graduate students not affiliated with this research) and computed the agreement rate.
Judge POL MOV KIT BOO DVD ELE
1 2,3,4 2 2 4 3 3
2 2,4 2 2 4 3 3
3 4 2,4 4 4 3 3
4 2,3 2 2 4 3 3,4
5 2 2 2 4 3 3
[image:7.595.73.302.63.136.2]Agr 80% 100% 80% 100% 100% 100%
Table 2: Human agreement rate.
POL MOV KIT BOO DVD ELE Acc 99.8 87.0 87.6 86.2 87.4 77.6
Table 3: Accuracies on unambiguous documents.
These results together with the fact that it took 5– 6 minutes to identify the relevant dimension, indi-cate that asking a human to determine the intended dimension based on solely the “informative” fea-tures is a viable task.
Clustering results. Next, we cluster all 2000 documents for each dataset using the dimension selected by the majority of the human judges. The clustering results are shown in row 3 of Table 1. In comparison to the better baseline for each dataset, we see that our approach performs substantially better on BOO, DVD and ELE, at almost the same level on MOV and KIT, but slightly worse on POL. Note that the improvements observed for BOO, DVD and ELE can be attributed to the failure of e2 to capture the sentiment dimension. Perhaps most importantly, by exploiting human feedback, our approach has achieved more stable performance across the datasets than the baselines, with accura-cies ranging from 65.8% to 93.7% and ARI rang-ing from 0.10 to 0.76.
Role of unambiguous documents. Recall that the features with the largest MMFR were com-puted from the unambiguous documents only. To get an intuitive understanding of the role of unam-biguous documents in our approach, we show in Table 3 the accuracy when the unambiguous doc-uments in each dataset were clustered using the eigenvector selected by the majority of the judges. As we can see, the accuracy of each dataset is higher than the corresponding accuracy shown in row 3 of Table 1. In fact, an accuracy of more than 85% was achieved on all but one dataset. This sug-gests that our method of identifying unambiguous documents is useful.
Note that it is crucial to be able to achieve a high accuracy on the unambiguous documents: if clus-tering accuracy is low, the features induced from
the clusters may not be an accurate representation of the corresponding dimension, and the human judge may have a difficult time identifying the in-tended dimension. In fact, some human judges re-ported difficulty in identifying the correct dimen-sion for the ELE dataset, and this can be attributed in part to the low accuracy achieved on the unam-biguous documents.
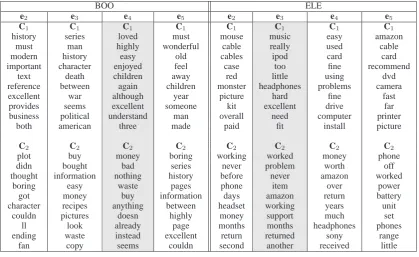
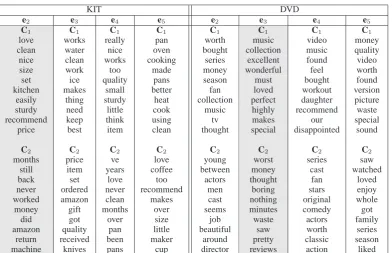
Features as summary. Recall that the method we proposed represents each dimension with a small number of features and asks a user to se-lect the desired dimension by inspecting the corre-sponding feature lists. In other words, each feature list serves as a “summary” of its corresponding di-mension, and inspecting the features induced for each dimension can give us insights into the dif-ferent dimensions of a dataset. Hence, if a user is not sure how she wants the data points to be clus-tered (due to lack of knowledge of the data, for instance), our automatically induced features may serve as an overview of the different dimensions of the data. To better understand whether these features can indeed provide a user with additional useful information about a dataset, we show in Ta-bles 4–6 the top ten features induced for each clus-ter and each dimension for the six datasets. As an example, consider the MOV dataset. Inspecting the induced features, we can determine that it has a sentiment dimension (e2), as well as a humor vs. thriller dimension (e4). In other words, if we clus-ter along e2, we get a sentiment-based clustering; and if we cluster along e4, we obtain a genre-based (humor vs. thriller) clustering.
User feedback vs. labeled data. Recall that our two baselines are unsupervised, whereas our ap-proach can be characterized as semi-supervised, as it relies on user feedback to select the intended di-mension. Hence, it should not be surprising to see that the average clustering performance of our ap-proach is better than that of the baselines.
POL MOV
e2 e3 e4 e5 e2 e3 e4 e5
C1 C1 C1 C1 C1 C1 C1 C1
serder beyer serbs escrow relationship production jokes starts armenian arabs palestinians serial son earth kids person
turkey andi muslims algorithm tale sequences live saw armenians research wrong chips husband aliens animation feeling
muslims israelis department ensure perfect war disney lives sdpa tim bosnia care drama crew animated told argic uci live strong focus alien laughs happen davidian ab matter police strong planet production am dbd@ura z@virginia freedom omissions beautiful horror voice felt
troops holocaust politics excepted nature evil hilarious happened
C2 C2 C2 C2 C2 C2 C2 C2
sternlight escrow standard internet worst sex thriller comic wouldn sternlight sternlight uucp stupid romantic killer sequences
pgp algorithm des uk waste school murder michael crypto access escrow net bunch relationship crime supporting algorithm net employer quote wasn friends police career
isn des net ac video jokes car production
[image:8.595.82.516.59.314.2]likely privacy york co worse laughs dead peter access uk jake didn boring sexual killed style idea systems code ai guess cute starts latest cryptograph pgp algorithm mit anyway mother violence entertaining
Table 4: Top ten features induced for each dimension for the POL and MOV domains. The shaded columns correspond to the dimensions selected by the human judges. e2,. . ., e5are the top eigenvectors; C1and C2are the clusters.
BOO ELE
e2 e3 e4 e5 e2 e3 e4 e5
C1 C1 C1 C1 C1 C1 C1 C1
history series loved must mouse music easy amazon must man highly wonderful cable really used cable modern history easy old cables ipod card card important character enjoyed feel case too fine recommend
text death children away red little using dvd reference between again children monster headphones problems camera excellent war although year picture hard fine fast provides seems excellent someone kit excellent drive far business political understand man overall need computer printer
both american three made paid fit install picture
C2 C2 C2 C2 C2 C2 C2 C2
plot buy money boring working worked money phone didn bought bad series never problem worth off thought information nothing history before never amazon worked
boring easy waste pages phone item over power got money buy information days amazon return battery character recipes anything between headset working years unit
couldn pictures doesn highly money support much set ll look already page months months headphones phones ending waste instead excellent return returned sony range
fan copy seems couldn second another received little
Table 5: Top ten features induced for each dimension for the BOO and ELE domains. The shaded columns correspond to the dimensions selected by the human judges. e2,. . ., e5are the top eigenvectors; C1and C2are the clusters.
unlabeled data. Next, we randomly sample 50 un-labeled documents and assign them the true label. We then re-train the classifier and compute its ac-curacy on the 2000 documents. We keep adding more labeled data (50 in each iteration) until it
[image:8.595.90.510.377.634.2]KIT DVD
e2 e3 e4 e5 e2 e3 e4 e5
C1 C1 C1 C1 C1 C1 C1 C1
love works really pan worth music video money clean water nice oven bought collection music quality nice clean works cooking series excellent found video size work too made money wonderful feel worth set ice quality pans season must bought found kitchen makes small better fan loved workout version
easily thing sturdy heat collection perfect daughter picture sturdy need little cook music highly recommend waste recommend keep think using tv makes our special
price best item clean thought special disappointed sound
C2 C2 C2 C2 C2 C2 C2 C2
months price ve love young worst series saw still item years coffee between money cast watched back set love too actors thought fan loved never ordered never recommend men boring stars enjoy worked amazon clean makes cast nothing original whole money gift months over seems minutes comedy got
did got over size job waste actors family amazon quality pan little beautiful saw worth series
[image:9.595.105.498.58.311.2]return received been maker around pretty classic season machine knives pans cup director reviews action liked
Table 6: Top ten features induced for each dimension for the KIT and DVD domains. The shaded columns correspond to the dimensions selected by the human judges. e2,. . ., e5are the top eigenvectors; C1and C2are the clusters.
POL MOV KIT BOO DVD ELE # labels 400 150 200 350 350 200
Table 7: Transductive SVM results.
user feedback is equivalent to the effort of hand-annotating 275 documents per dataset on average.
Multiple relevant dimensions. As seen from Table 2, some human judges selected more than one dimension for some datasets (e.g., 2,3,4 for POL; 2,4 for MOV; and 3,4 for ELE). However, we never took into account these “extra” dimen-sions in our previous experiments. To better un-derstand whether these extra dimensions can help improve accuracy and ARI, we conduct another experiment in which we apply 2-means to clus-ter the documents in a space that is defined by all of the selected dimensions. The final accu-racy turns out to be 95.9%, 70.9%, and 67.5% for POL, MOV, and ELE respectively, which is con-siderably better than using only the optimal di-mension and suggests that the extra didi-mensions contain useful information.
5 Conclusions
Unsupervised clustering algorithms typically group objects along the most prominent di-mension, in part owing to their objective of
simultaneously maximizing inter-cluster similar-ity and intra-cluster dissimilarsimilar-ity. Hence, if the user’s intended clustering dimension is not the most prominent dimension, these unsupervised clustering algorithms will fail miserably. To address this problem, we proposed to integrate a novel user feedback mechanism into a spectral clustering algorithm, which allows us to mine the intended, possibly hidden, dimension of the data and produce the desired clustering. This mechanism differs from competing methods in that it requires very limited feedback: to select the intended dimension, the user only needs to inspect a small number of features. We demonstrated its viability via a set of human and automatic experi-ments with unsupervised sentiment classification, obtaining promising results.
Acknowledgments
We thank the three anonymous reviewers for their invaluable comments on an earlier draft of the pa-per. This work was supported in part by NSF Grant IIS-0812261.
References
Maria-Florina Balcan and Avrim Blum. 2008. Clus-tering with interactive feedback. In Proceedings of ALT, pages 316–328.
Carmen Banea, Rada Mihalcea, Janyce Wiebe, and Samer Hassan. 2008. Multilingual subjectivity analysis using machine translation. In Proceedings of EMNLP, pages 127–135.
Ron Bekkerman, Hema Raghavan, James Allan, and Koji Eguchi. 2007. Interactive clustering of text collections according to a user-specified criterion. In Proceedings of IJCAI, pages 684–689.
John Blitzer, Mark Dredze, and Fernando Pereira. 2007. Biographies, bollywood, boom-boxes and blenders: Domain adaptation for sentiment classi-fication. In Proceedings of the ACL, pages 440–447.
Deng Cai, Xiaofei He, and Jiawei Han. 2005. Doc-ument clustering using locality preserving indexing. IEEE Transactions on Knowledge and Data Engi-neering, 17(12):1624–1637.
Inderjit Dhillon, Yuqiang Guan, and Brian Kulis. 2004. Kernelk-means, spectral clustering and normalized cuts. In Proceedings of KDD, pages 551–556.
Mark Dredze and Koby Crammer. 2008. Active learn-ing with confidence. In Proceedlearn-ings of ACL-08:HLT Short Papers (Companion Volume), pages 233–236.
Thorsten Joachims. 1999. Making large-scale SVM learning practical. In Bernhard Scholkopf and Alexander Smola, editors, Advances in Kernel Meth-ods - Support Vector Learning, pages 44–56. MIT Press.
Sepandar Kamvar, Dan Klein, and Chris Manning. 2003. Spectral learning. In Proceedings of IJCAI, pages 561–566.
Ravi Kannan, Santosh Vempala, and Adrian Vetta. 2004. On clusterings: Good, bad and spectral. Jour-nal of the ACM, 51(3):497–515.
Soo-Min Kim and Eduard Hovy. 2004. Determining the sentiment of opinions. In Proceedings of COL-ING, pages 1367–1373.
Bing Liu, Xiaoli Li, Wee Sun Lee, and Philip S. Yu. 2004. Text classification by labeling words. In Pro-ceedings of AAAI, pages 425–430.
Tony Mullen and Nigel Collier. 2004. Sentiment analysis using support vector machines with diverse information sources. In Proceedings of EMNLP, pages 412–418.
Andrew Ng, Michael Jordan, and Yair Weiss. 2002. On spectral clustering: Analysis and an algorithm. In Advances in NIPS 14.
Bo Pang, Lillian Lee, and Shivakumar Vaithyanathan. 2002. Thumbs up? Sentiment classification us-ing machine learnus-ing techniques. In Proceedus-ings of EMNLP, pages 79–86.
Hema Raghavan and James Allan. 2007. An interac-tive algorithm for asking and incorporating feature feedback into support vector machines. In Proceed-ings of SIGIR, pages 79–86.
Dan Roth and Kevin Small. 2009. Interactive feature space construction using semantic information. In Proceedings of CoNLL, pages 66–74.
Jianbo Shi and Jitendra Malik. 2000. Normalized cuts and image segmentation. IEEE Transactions on Pat-tern Analysis and Machine Intelligence, 22(8):888– 905.
Peter Turney. 2002. Thumbs up or thumbs down? Se-mantic orientation applied to unsupervised classifi-cation of reviews. In Proceedings of the ACL, pages 417–424.
Kiri Wagstaff, Claire Cardie, Seth Rogers, and Ste-fan Schr¨odl. 2001. Constrained k-means cluster-ing with background knowledge. In Proceedcluster-ings of ICML, pages 577–584.
Xiaojun Wan. 2008. Using bilingual knowledge and ensemble techniques for unsupervised Chinese sen-timent analysis. In Proceedings of EMNLP, pages 553–561.
Yair Weiss. 1999. Segmentation using eigenvectors: A unifying view. In Proceedings of ICCV, pages 975– 982.