Neural Network Regressions with Fuzzy
Clustering
S. I. Ao, Member, IAENG
Abstract—A hybrid neural network regression models with
unsupervised fuzzy clustering is proposed for clustering nonparametric regression models for datasets. In the new formulation, (i) the performance function of the neural network regression models is modified such that the fuzzy clustering weightings can be introduced in these network models; (ii) the errors of these network models are feed-backed into the fuzzy clustering process. This hybrid approach leads to an iterative procedure to formulate neural network regression models with optimal fuzzy membership values for each object such that the overall error of the neural network regression models can be minimized. Our testing results show that this hybrid algorithm NN-FC can handle cases that the K-means and Fuzzy C-means perform poorly. The overall training errors drop down rapidly and converge with only a few iterations. The clustering accuracy in testing period is consistent with these drops of errors and can reach up to about 100% for some problems that the other classical fuzzy clustering algorithms perform poorly with about accuracy of 60% only. Our algorithm can also build regression models, which has the advantage of the NN component, being non-parametric and thus more flexible than the fuzzy c-regression.
Index Terms—Neural network, regression models, fuzzy
clustering, fuzzy performance function.
I. INTRODUCTION
THE general regression models for representing the dependent variable
Y
G
and independent variableX
G
can be written as followed:
Y
G
=
F X
i( )
G
+
ε
(1) for1
≤ ≤
i
K
, whereε
are the noises of the data type, is the number of different regression functions, and is the ith regression function betweenK
i
F
X
G
and . The difficulty of solving this problem is that (i) the regression functions are unknown and (ii) the regression functions are not labeled. For (i), it implies that the form of is unknown and that it may be linear or nonlinear. For (ii), it implies that the clustering of the dataY
G
i
F
X
G
andY
G
for the regression functions is required. Our aim is to cluster a set of points into different groups, and to construct their corresponding regression functions for each group of points.Hathaway and Bezdek [1] developed a methodology of switching regression models and fuzzy clustering. Their main idea is to employ a fuzzy clustering for linear or polynomial regression models for data sets. Their approach leads to an iterative procedure to formulate linear or polynomial regression functions with optimal fuzzy membership values for each object such that the overall error of the linear or polynomial regression functions is minimized. Hathaway and Bezdek have pointed out that there are various applications of the switching regression models in economics. And an example from fisheries was illustrated. The sexuality of a fish called halibut is indistinguishable. The mean length of a male halibut depends on its age for a certain range of ages and so does the female halibut. And the problem can be treated as a switching regression problem of two models, one for the male and another for the female. In their example, Hathaway’s two models are
y
=
β
11x
+
β
12+
ε
1
y
=
β
21x
+
β
22+
ε
2 (2) where y = length and x = age. And our proposed approach can give solutions of the form
y
=
f x
1( )
+
ε
1
y
=
f x
2( )
+
ε
2 (3) where the functions are to be simulated by two neural network regression models respectively. Menard [2] extended fuzzy clustering and switching regression models using ambiguity and distance rejects. The main drawback of switching regression approach is that the parameters of the formal generating functions must be known. However, this may not be valid in practice.In this paper, we propose and develop the nonparametric neural network (NN) regression models to remove such parametric (linear or polynomial) models on regression functions. Our algorithm can provide non-linear non-parameter solutions to the above applications of the switching regression models. It has been illustrated from the difference between Equations (2) and (3). Furthermore, it can cluster datasets produced by some underlying generated functions.
being studied (hyper-spherical clusters of equal size for Euclidean distance and hyper-elliptical clusters for Mahalanobis distance) [3]. Even though Gustafson-Kessel and Gath-Geva algorithms have extended the Fuzzy C-means algorithm for shapes of ellipses and ellipsoids [4], there are still strict restrictions on the clusters’ shapes. For the clustering problem with two centers, the FCM will cluster the left-hand side data points into one group and the right-hand side data into another group. It is clear that this is a very poor cluster decision for this problem. Fuzzy c-regression can solve the problem partially, only when the parameters of the formal generating functions are given. Nevertheless, in reality, it is difficult to know in advance about the generating functions.
There are previous studies [5, 6, 7, 8] that combine the fuzzy clustering and the neural network for supervised classification purposes. They have applied the fuzzy clustering to the original data and got the membership values for each object in each cluster. This information can serve as the weighting for the neural network output at the performance level in Sarkar’s study. Or it is used during the combining of different NN models’ outputs in Ronen’s work. In Boca’s study, they employ the Fourier analysis and fuzzy clustering to extract the signal features for the supervised neural network classification. Bortolan has applied the fuzzy clustering as a preprocessor for the initialization of the receptive fields of the radial basis function neural network for supervised classification.
It should be stressed that these studies have employed the hybrid system in the loose format. That is that the variables have been passed through each component only once. They have reported satisfactory results for problems that are suitable for supervised learning. But, these studies are restricted to problems that suit the Fuzzy C-means clustering and will performed poorly for other problems. Our study differs from these above methodologies in that we deal with unsupervised learning problems instead of their supervised classification problems. Also, we have developed our algorithm in an iterative manner and achieve the hybrid objectives of unsupervised clustering and neural network regressions with our algorithm.
We have formulated a hybrid iterative methodology of neural network and unsupervised fuzzy clustering so that the clustering and regression components can supplement each other for further improvement. This can be regarded as an implementation of the expectation-maximization algorithm with the neural network regression step and the fuzzy clustering step. A general solution for these problems can be found with our new NN-FC algorithm, which can give clustering accuracy of about 100% in our testing period.
The outline of this paper is as follows. In Section 2, we present the proposed algorithm. In Section 3, we illustrate the effectiveness of the proposed method by some numerical examples. Finally, a summary is given in Section 4.
II. THE PROPOSED ALGORITHM
Our algorithm consists of the neural network and the
unsupervised fuzzy clustering components. The neural network is for investigating the regression relationships between the dependent and independent variables, while the unsupervised fuzzy clustering is for clustering the objects into different generating functions. Then, NN regressions are implemented to simulate different generating functions with the modified performance functions that each error is weighted by the output from the FC. The respective performance errors are passed back to the FC. FC component will adjust the membership values for each object in each cluster based on the corresponding errors of that object in each generating NN model.
The idea derives from the fact that, if an object fits a particular NN model well, its error in that model will be much lower than its errors in other NN models. At the same time, when the memberships are more and more close to the corrected generated clusters, it can help the NN to have better simulations for each underlying regression function. These two components work in a hybrid way and form a loop until the overall errors do not show any further significant improvement.
A. Neural Network Regression Models
Neural network is well known for its non-linear capability and is usually employed with the three-layer architecture. The layers are input layer, hidden layer and output layer. The inspiring idea for this structure is to mimic the working of our brain. The mathematical structure for the above neural network structure can be expressed as followed [9]:
(2) (1) (4)
1 1
J I
j ji
j i
y
f
w
f
w x
= =
⎛
⎛
⎞
⎞
= ⎜
⎜
⎟
⎟
⎝
⎠
⎝
∑
∑
i⎠
where the function
f
is the activation function of the network, I denotes the number of inputs, J the number of hidden neurons,i
x
the ith input, the weights between the input and hidden layers, the weights between the hidden and output layers.(1)
w
(2)
w
Unlike traditional neural networks, we have employed the fuzzy membership results from the clustering as the weighting for each output error of the network. We have adopted the fuzzy clustering instead of the hard clustering. If the hard clustering of membership values 0 and 1 were employed, the network would be trained with these crisp weightings and then optimized with respect to these crisp weights. When we perform the clustering procedure for such data in the next iteration, the objective function value does not improve. The main reason is that the NN regression models fit the data points very well. It is difficult to adjust the weightings to the optimal membership values when we were restricted with the membership values 0 and 1 only.
As said, we have modified the performance function of a typical network
2
1 1
1
(
)
2
N M
nm nm
n m
E
z
NM
= =with our new one:
2
1 1 1
1
(
2
K N M
knm knm knm
k n m
E
w
z
NM
α
= = =
=
∑∑∑
−
t
)
(5)where N is the number of examples in the data set, M the number of outputs of the network, the mth target output for the nth example in the kth cluster, the mth output for the nth example in the kth cluster, K the number of clusters. is the fuzzy membership value for each sample to belong a certain cluster k, and
knm
t
knmz
knmw
α
is the fuzzy weighting exponent. We have developed specific learning laws for this modified NN performance function similar with the neural network part of Sarkar’s study and the derivation for a simple three-layer network with logistic transfer function is in Appendix 1. Sarkar et al. have discussed the motivations and advantages of introducing of this fuzzy mean square error term. In brief, with the introduction of the fuzzy mean square error term, the restriction of an input datum belonging to one and only one cluster/class has been removed. It addresses the situations where the datum may belong to more than one cluster. The training of the networks can be conceptually viewed as a fuzzy constraint satisfaction problem.B. Fuzzy Clustering
K-means and Fuzzy C-means are two conventional clustering methods. The difference of the K-means clustering and the Fuzzy C-means clustering is on the overlapping or not of the boundaries between the clusters. In K-means clustering, the belonging of a datum x to a cluster k or not is crisp, usually donated by a membership function , where
if and only if
:
{0,
k
u
X
→
1}
( ) 1
k
u x
=
x
∈
k
, andu x
k( ) 0
=
if and only ifx
∉
k
. The task of the K-means clustering algorithm is to determine the K cluster centers and the values for every datum and cluster.( )
k
u x
In the real life situations, boundaries between the classes may be overlapping [5] and it is uncertain if a datum belongs completely to a certain cluster. This is one of the motivations for our adoption of Fuzzy C-means clustering here. In Fuzzy C-means clustering, the membership function is no longer crisp. Instead, here, it can take any values between 0 and 1, with the constraint
k
u
1
( ) 1
K k k
u x
==
∑
for every datum x and every cluster k.
The objective of applying fuzzy clustering component in our study is to minimize the above performance function (5) of the neural network with respect to the
w
knm, where(6)
1
{0,1},
1
,
K
kmn kmn
k
w
and
w
m n
=
∈
∑
= ∀
Define 21
(
)
2
knm knm knm
E
z
NM
=
−
t
E
as the dissimilarity measure between the object nm and the k cluster center, we can have
(7)
1 1 1
K N M
knm knm
k n m
E
w
α= = =
=
∑∑∑
which can be recognized as a fuzzy clustering problem like [10, 11] etc., and can be solved by taking partial derivative of E with respect to
w
knm. Forα
>
1
, the minimizerw
ˆ
knm is given by1/( 1)
1
1, 0
ˆ 0, 0
1/ , hnm hnm knm K hnm k knm if E
w if E for some
otherwise E E α− = ⎧ ⎪ = ⎪ ⎪
other k h
=⎨ = ≠ ⎪ ⎡ ⎤ ⎪ ⎢ ⎥ ⎪ ⎣ ⎦ ⎩
∑
(8) where1
≤ ≤
h
K
and1
≤ ≤
k
K
.C. Hybrid Neural Network and Fuzzy Clustering (NN-FC) Instead of clustering the data only once and then passing it to the neural network, our algorithm utilizes the additional information of the clustering and neural network. It works in a hybrid iterative loop. As said, the motivation is that outputs from each of the two components can improve each other component in the following round. The algorithm is given as follow:
Algorithm 1 The Hybrid NN-FC Algorithm
Step 1. Randomize the fuzzy membership matrix
w
knm; Step 2. Train the neural network models to minimize for each cluster, using our modified gradient-descent rules and keeping as constants;E
knm
w
Step 3. Update the fuzzy membership values of every object in each cluster, such that is minimized with respect to
. knm
w
E
knmw
Step 4. Repeat the above steps (2) and (3) in iteration until the improvement of the performance function between the successive iterations drops below a certain level.
Then, the accuracies of the clustering results will be checked in our testing period.
III. EXPERIMENTAL RESULTS
clustering the data sets accurately and forming the regression functions accurately.
In the second example, the dataset comes from two linear generating functions as shown:
F
1: ( )
ε
X
F
2:
X
/10
+
ε
(
X
)
(9)where
X
will have values drawn evenly from the interval studied,ε
is the corresponding noise. For the dataset in the first example, one generating function is of second-order and the other of third order, with noises at different levels:
F
1: 260 (
×
X
−
7.5)
2+ +
5 0.1
×
ε
( )
X
X
F
2: 8
×
X
3+
0.1
×
ε
( )
X
(10) The dataset 3 show us a problem from two linear generating functions with intersection:
F
1: 5.6
−
× +
X
90
+
ε
( )
F
2: 6
× +
X
ε
( )
X
(11) In the dataset 4, the two generating functions are of second-order and first-order respectively:2
1
:10 (
6.5)
5 0.1
( )
F
×
X
−
+ +
×
ε
x
F
2: 68
− × +
X
620 0.1
+
×
ε
( )
X
(12) Table 1 shows us the clustering results for these datasets. We can see the accuracies of our proposed method are close to 100% for all datasets in the testing period. Sarkar’s results are obtained with fuzzy membership assignment. In their methodology, each of the data sets will pass the fuzzy clustering and neural network components once and only once. While the neural network compoent have added as a classifier, the actual clustering jobs are done with the fuzzy clustering. K-means clustering results are also listed. As said, Sarkar’s method has employed the fuzzy clustering technique for the clustering process and we can see that their performances are very similar with the K-means clustering. The hierarchical cluster results are obtained with the single linkage algorithm. For the quantum clustering algorithm, it has been recently suggested by Horn and Gottlieb [12] and has been successfully applied to the genome datasets [13]. The algorithm is based on the solution for the Schrödinger equation.Table 1. Clustering Accuracies (in percentage) for the Datasets in the Testing
Period
Datasets 1 2 3 4 Our method 96% 100% 99% 97% Sarkar’s 61% 50% 61% 77% K-means 62% 51% 61% 77% Hierarchical 51% 100% 55% 63% Quantum 59% 50% 62% 80%
We have applied different noise levels to the first dataset to check the robustness of our method. The following generating functions are that for dataset 1 with different noise levels controlled by α:
F
1: 260 (
×
X
−
7.5)
2+ + ×
5
α ε
( )
X
F
2: 8
×
X
3+ ×
α ε
( )
X
(13) The noise level 0.1 is the one we have used and is with noise level α equal to 0.1. And the noise level 400 is with α value equal to 400 and the noise level 16 is with α value equal to 1600. This is comparable with the magnitude of our datasets. Table 2 shows that the clustering results at different noise levels. We can see that our method is robust over these noise levels and can maintain its clustering accuracies above 90%, while other methods can only achieved about 60% accuracy for the original dataset.Table 2. Clustering Accuracies (in percentage) for the Datasets in the Testing Period at Different Noise Levels
Noise Levels 0.1 400 1600
Accuracies 96% 91% 96%
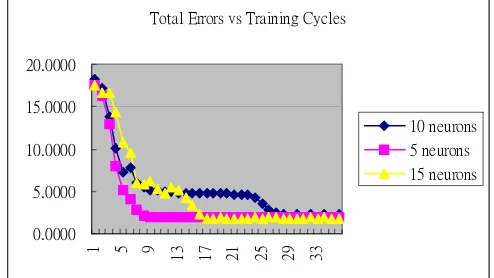
[image:4.612.315.562.590.729.2]Three different neural network structures have also been tested to see the effect of different NN architectures. Among the test structures, they are three-layer networks of 5 hidden neurons, 10 hidden neurons and 15 hidden neurons respectively. All of the three networks with sample 2 datasets can produce stable clusters in less than 20 iterations and obtain 100% clustering accuracies. We can see these results in the following figure. This suggests that our hybrid NN-FC algorithm is stable with respect to the network’s structure. It can be observed that total training errors decrease rapidly and converge to a small value in just a few epochs.
Total Errors vs Training Cycles
0.0000 5.0000 10.0000 15.0000 20.0000
1 5 9 13 17 21 25 29 33
Fig 1. Total Sum of Square Errors of the Different Neural Network Models vs.
Number of Training Cycles
IV. SUMMARY AND DISCUSSION
In our results, it is shown that our NN-FC is able to handle problems that cannot be properly solved with the K-means, fuzzy c-means, and the previous fuzzy clustering and neural network systems. In the studies [5, 6, 7, 8], the fuzzy clustering has been designed as a preprocessing tool for feeding the neural network with better inputs without any feedback to the fuzzy clustering. Here, we have successfully developed a feedback algorithm so that the fuzzy clustering can be further improved for solving unsupervised learning problems. And the steady decreases of the sums of errors as seen in Figure 1 confirm with this. Table 2 shows us that our algorithm can have stable solutions for a range of different noise levels.
It is expected that the proposed methodology can be further improved. For example, further improvement can be obtained with the optimal design of network structure like the number of hidden neurons, with faster second-order learning laws of fuzzy performance function, and with the tabu-search algorithm. Therefore, the proposed algorithm can explore the solution space beyond local optimality in order to aim at finding a global optimal solution of unsupervised learning problems [14].
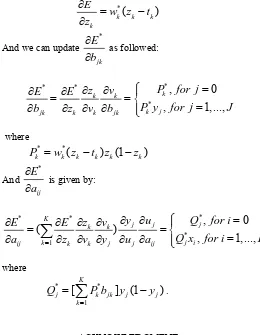
APPENDIX I
In a simple three-layer network, the inputs to hidden neuron j can be donated as 0 , and its output as
1
I
j j ij
i
u
a
a x
=
=
+
∑
ij
( )
j
y
=
g u
, where the function is the Logisitic transfer function. The inputs to k output are given as, and its output is . For the on-line learning case, the mean squared error is given by:
0 1
J
k k jk
j
v
b
b y
=
=
+
∑
jz
k=
g v
( )
k2 1
1
(
)
2
K k k kE
z
=−
∑
t
Here, we have replaced this measurement of error by our new one with the weightings for each output k, where is obtained from our fuzzy clustering component,
*
E
w
*kw
*k* * 1
1
(
)
2
Kk k k
k
E
w z
t
=
−
∑
2As a result, the updating procedure for the neural network is different from the typical network and will be derived as followed in a similar way as Sarker et al.
Taking derivative of
E
* with respect toz
k,
*
*
(
)
k k k
k
E
w z
t
z
∂
=
−
∂
And we can update
*
jk
E
b
∂
∂
as followed:* * * *
,
0
,
1,...,
k k k k jjk k k jk
P
for j
z
v
E
E
P y
for j
J
b
z
v
b
⎧
=
∂
∂
∂
=
∂
= ⎨
⎪
=
∂
∂ ∂ ∂
⎪⎩
where
P
k*=
w z
k*(
k−
t z
k) (1
k−
z
k)
And * ij
E
a
∂
∂
is given by:* * * * 1
,
0
(
)
,
1,...,
Kj j j
k k
k j i
ij k k j j ij
y
u
Q
for i
z
v
E
E
Q x for i
I
a
=z
v
y
u
a
⎧
∂ ∂
=
∂ ∂
∂
=
∂
⎪
= ⎨
=
∂
∑
∂ ∂ ∂
∂ ∂
⎪⎩
where * * . 1[
] (1
K
j k jk j
k
Q
P b
y
=
=
∑
−
y
j)
ACKNOWLEDGMENT
The author would like to acknowledge that Prof. K. P. Ng has participated in the initial works of this paper.
REFERENCES
[1] R. J. Hathaway, and J. C. Bezdek, “Switching Regression Models and Fuzzy Clustering”, IEEE Transaction on Fuzzy Systems, 1, 195-204, 1993.
[2] Michel Menard, “Fuzzy Clustering and Switching Regression Models Using Ambiguity and Distance Rejects”, Fuzzy Sets and Systems, 133, 363-399, 2001.
[3] K. Jajuga, A. Sokolowski, and H.-H. Bock (eds.), “Classification, Clustering, and Data Analysis: Recent Advances and Application”, Springer, 35-42, 2002.
[4] Frank Hoppner, Frank Klawonn, Rudolf Kruse, and Thomas Runkler, “Fuzzy Cluster Analysis: Methods for Classification, Data Analysis and Image Recognition”, Wiley, 1999.
[5] Manish Sarkar, B. Yegnanarayana, and Deepak Khemani, “Backpropagation Learning Algorithms for Classification with Fuzzy Mean Square Error”, Pattern Recognition Letters, 19, 43-51, 1998. [6] M. Ronen, Y. Shabtai and H. Guterman, “Rapid Process
Modelling-Model Building Methodology Combining Supervised Fuzzy-Clustering and Supervised Neural Networks”, Computers Chem. Engng., 22, S1005-1008, 1998.
[7] Adrian Del Boca and Dong C. Park, “Myoelectric Signal Recognition using Fuzzy Clustering and Artificial Neural Networks in Real Time”, IEEE World Congress on Computational Intelligence, v5, 3098-3103, 1994.
[8] Giovanni Bortolan, Witold Pedrycz, “Fuzzy Clustering Preprocessing in Neural Classifiers”, Kybernetes, v27 (8), 900, 1998.
[image:5.612.311.571.56.391.2][10] J. Z. Huang, “Extensions to the k-Means Algorithm for Clustering Large Data Sets with Categorical Values”, Data Mining Knowledge Discovery, 2, 283-304, 1998.
[11] J. Z. Huang, and M. K. Ng, “A Fuzzy k-Modes algorithm for Clustering Categorical Data”, IEEE Trans. on Fuzzy Systems, 7, 446-452, 1999. [12] D. Horn and A. Gottlieb, “Algorithm for Data Clustering in Pattern
Recognition Problems Based on Quantum Mechanics”, Phys. Rev. Lett., 88, 018702, 2002.
[13] D. Horn and I. Axel, “Novel Clustering Algorithm for Microarray Expression Data in a Truncated SVD Space”, Bioinformatics, 19 (9), 1110-1115, 2003.