Abstract—Owing to the popularity of World Wide Web, many enterprises have changed the ways of doing business, which enhance the rapid development of E-commerce directly and makes the development of web usage mining skills important. It becomes a crucial issue to predict exactly the ways how users and customers browse websites. The prediction result can be used for personalization, building proper websites, promotion, getting marketing information, and forecasting market trends etc. Markov model is assumed to be a probability model by which users’ browsing behaviors can be predicted at category level. Bayesian theorem can also be applied to present and infer users’ browsing behaviors at webpage level. In this research, Markov models and Bayesian theorem are combined and a two-level prediction model is designed. By the Markov Model, the system can effectively filter the possible category of the websites and Bayesian theorem will help to predict websites accuracy. The experiments will show that our provided model has noble hit ratio for prediction.
Index Terms—Web Usage Mining, Prediction, Markov models, Bayesian theorem.
I. INTRODUCTION
Owing to the popularity of World Wide Web, many enterprises have changed the ways of doing business, which enhance the rapid development of E-commerce directly and make the development of web usage mining skills important. Web usage mining is a technology of web mining. Web usage mining applies the technology of data mining on the Internet and web services. It is used to find out and extract the pattern and the knowledge in the web usage automatically, for example, association rule, clustering algorithm, and sequential pattern analysis etc [6].
The goal of web usage mining is to find out the useful information from web data or web log files. The other goal is to enhance the usability of the web information and apply the technology to the web application, for instance, pre-fetching and caching, personalization, target advertisement, improving web design, improving satisfaction of customer, guiding the strategy decision of the enterprise, and marketing analysis etc [2][6][7][12].
CRM (Customer Relationship Management), such as
1 This work was supported by National Science Council under Grant NSC
96-2221-E -324-043.
Chu-Hui Lee is with the Chaoyang University of Technology, Wu-Fong Township Tai-Chung County, 41349 Taiwan (R.O.C.). Phone: (04)2332-3000 ext. 4388; fax: (04)2374-2373; e-mail: chlee@ cyut.edu.tw.
Yu-Hsiang Fu is with the Chaoyang University of Technology, Wu-Fong Township Tai-Chung County, 41349 Taiwan (R.O.C.). e-mail: [email protected].
banking, is a quite popular field in which web usage mining is applied. The cost of on-line transaction is getting less than traditional commerce. CRM is further to lead customers to online transactions in the visual bank by applying web usage mining technology. Meanwhile, CRM and web usage mining technology also can be used on the E-commerce web site. The goal, such as customer attraction, customer retention and cross sales, will be achieved [1].
In order to achieve the purpose, it is necessary to understand the customers’ browsing behavior and apply web usage mining technology. Web usage mining is used to predict users’ and costumer’s browsing behavior through mining the web data or web log files. Prediction is a way of analyzing historical information to calculate the most possible probability of next request; the browsing pattern when the future users and customers are surfing the web site is matched. There are many advantages to implement the prediction, for example, personalization, building proper web site, improving marketing strategy, promotion, product supply, getting marketing information, forecasting market trends, and increasing the competitive strength of enterprises etc.
In many portal of World Wide Web, web pages will be classified well for different purposes. In this paper, users’ browsing behavior will be observed at two levels to meet the nature of the World Wide Web. One is category level and the other is web page level. Each category contains many web pages on web site. The transaction probabilities of at category level are more stable than web page level. In the level one of prediction model, Markov model is used to predict the category of users’ next state with the first order transaction probability [8][13]. It will help to reduce the operation scope in level two just in some specific categories instead of all. After that, the web pages in suitable categories are predicted by Bayesian theorem in the level two of prediction model. It is expected that the two levels of prediction model can reduce the operation scope and increase the accuracy precision.
The rest of this paper is organized as follows: Section 2 is the related work. The two levels of prediction model are proposed in Section 3. Session 4 is the result of experiment. The conclusion and future work will be discussed in Session 5.
II. RELATED WORK
Because World Wide Web is rapid developed, Internet is a golden mount with a lot of valuable information. Web usage mining is a powerful and useful tool to find out the information in a systematic, efficient and automatic way. The
Two Levels of Prediction Model for User’s
Browsing Behavior
1
terminology of web mining was proposed by Etzioni in 1996. Web mining is applied to web pages and services of Internet in order to find and extract the available knowledge [6].
Web mining can be categorized into three categories (as Fig. 1), web content mining, web structure mining and web usage mining. Web content mining focuses on useful knowledge which is extracted from web pages. Web structure mining is used to analyze the links between web pages through the web structure to infer the knowledge. Web usage mining is extract the information from web log file which is accessed by users.
Figure1. Taxonomy of Web Mining
A. Web Log File
Web usage mining is used to find out the interrelated information from web log file which is involved. All of users’ browsing behavior is clearly recorded in the web log file with users’ name, IP address, date, and request time etc [16].
TABLE 1.DESCRIPTION OF COMMON LOG FILE
Content of log file Description 163.17.9.84 Address or DNS
- RFC931 - Authuser [08/Nov/2007:20:35:
52 +0800] TimeStmp
"GET /menu.htm
HTTP/1.1" Http request
200 Status code
1266 Transfer volume
- *Referrer URL
- *Usage agent
The format of web log file can be divided into two types, common log files (as Table 1) and extended log [1][6][14]. Common log file is constructed by access log and error log, referrer log and agent log are appended to it, and form extended log. After web log file is acquired, the procedure of web usage mining must be executed.
B. Web Usage Mining Procedure
The first process of web usage mining procedure is preprocessing in the web log files. The second process is mining algorithm which is to find out the pattern. The final process is analyzing the pattern which is mined by mining algorithm. The details of process of web usage mining procedure (as Fig. 2) are as follows [2][12][14]: users’ session, as a sequence pattern, is gathered from web log data and recognized through preprocessing process. Mining algorithm is used to find out the rules and patterns from the sequence pattern, for example, association rule, clustering algorithm, and sequential pattern analysis.
Figure2. Web Usage Mining Procedure
C. Markov model
Markov model is assumed to be a probability model by which users’ browsing behaviors can be predicted; their behaviors can be presented by how they visit during browsing [5][8][10]. Markov model has a set of state space
} ,..., , {s1 s2 sn
s= . If the sequential pattern is presented as a state sequence {st;t=1,2,...}, then
s
t denotes the sequence of state at time t. The transition of any two states in the sequence is based on transition probabilitypij. pij denotes the probability of state j which depends on pervious statei
. The state j at a time t depends on statei
at a time t−1 which is corresponding to first-order transition probability of Markov model. It also can denotes by} |
Pr{S j S 1 i
pij = t = t− = . First-order transition matrix is
established by calculating all of transition probability of all states. Any two elements in the translation matrix of Markov model are independent.
First-order transition probability can be denoted
by 1
ij ij p
p = . It would not change with time. n ij
p is obtained when the n-order transition probability denotes by n
ij p . n
ij p is a probability which state j at a time
t
depends on previous statei
at a time t−n. The n-order transition probability of Markov model also denotes by p Pr{St j|St n i}n
ij= = − = .
The n-order transition probability is calculated by well-know Champman-Kolmogorov equation as follows:
∑
=−
⋅
=
k llj n il n
ij
p
p
p
11
(1)
) (
1 )
( m n
ij k
l
n lj m il n
m
ij
p
p
P
p
+=
+
=
∑
⋅
=
(2) n
n n
P
P
P
P
( )=
( −1)⋅
=
(3) IfP
be a finite transition matrix andP
(n) be a n-order transition matrix of Markov model, then n np p( ) =
. The second-order and third-order transition matrix can be established by above equations. According to Champman-Kolmogorov equation, P(2) =P⋅P=P2 or
3 2
) 3
( P P P
P = ⋅ = will be acquired.
D. Bayesian theorem
Bayesian theorem as well as Markov model also can be used to predict the most possible users’ next request. It is assumed that the sample spaces S ,
A
andB
are two events of sample spaces S and P(B)>0. The condition probabilityP(A|B) means the probability of eventA
while eventB
occurs [15]. It is denoted as follows:)
(
)
(
)
|
(
B
P
B
A
P
B
A
[image:2.595.57.279.340.491.2])
(
)
(
)
|
(
)
|
(
B
P
A
P
A
B
P
B
A
P
=
(5) IfA
is a partition,A
=
{
A
1,
A
2,...,
A
n}
, then Bayesian theorem can be inferred as follows:)
|
(
)
(
)
(
)
|
(
)
(
)
(
)
|
(
)
|
(
1
r n
r r
j j j
j j
A
B
P
A
P
A
P
A
B
P
B
P
A
P
A
B
P
B
A
P
∑
==
=
(6)III. TWO LEVELS OF PREDICTION MODEL
The two levels of prediction model are designed by combining Markov model and Bayesian theorem (as Fig. 3). In level one, it is to predict the category at time t, which depends on users’ category at time t−1 and time t−2.
Bayesian theorem is used to predict the most possible web pages at a time t according to users’ states at a time
1
−
t . Finally, the prediction result of two levels of prediction model is released. The result can be applied in pre-fetching and caching on web site, personalization, target sales, and improving web site design etc.
Figure3. Two Levels of Prediction Model
A. Preprocessing
The steps of research framework (as Fig. 4) are described as follows. At first, the similarity matrix S of category is established. The approach of establishing similarity matrix is to gather statistics and to analyze the users’ behavior browsing which can be acquired from web log data. In step two, it is to establish the first-order transition matrix
P
and second-order transition matrix P2of Markov model. The transition matrix of Markov is established by the same approach, statistical method, from web log file.In step tree, the relevance matrix
R
is computed from first-order and second-order (or n-order) transition matrix of Markov model and similarity matrix. In our proposed method, the relevance is an important factor of prediction. Relevance can be used to infer the users’ browsing behavior between web categories.It is assumed that D denotes a database, which contains
m users’ usage record. It means that the users’ session is recorded and D={session1,session2,...,sessionm} is obtained. Each user’s session can also be recorded as a sequential pattern of n web pages which is browsed by time
order, and { 1, 2,..., n}
p
page page
page
session = , where
page
i
represents the user’s visiting page at time j, is obtained. If a web site has k categories, then the user’s session can be reorganized by {1, 2,..., k}c
c c c
session = ,
where ci =1denotes that user visited the web page of category
i
otherwise ci =0. After giving the definitions, more details for the prediction model are described in the following sections.Figure4. Research Framework
1) Similarity matrix of web categories
Research framework of step one is to create the similarity matrix from web log file. At first, the situation of categories in each user’s session has to be understood. The
>
=< i hi mi
i v v v
vector 1,,..., ,,..., , for each category
i
is gather thei
th element of sessionc from all m user sessions, vh,i =1means user h visited web page of categoryi
otherwise vh,i =0. Two categories can be calculated the Set similarity [3] and Euclidean distance [8], respectively, by equation (7) and (8), Euclidean distance is further normalized by equation (9). The results are computed by similarity and Euclidean distance. They are combined into a weight total similarity equation as equation (10).Set similarity:
B
A
B
A
B
A
SetSim
∪
∩
=
)
,
(
(7) Euclidean distance:∑
=−
=
mi
i i
B
A
B
A
D
1
2
)
(
)
,
(
(8) Normalization:m
m
i Ai Bi
B A D N
∑
= −
−
= 1
2 ) (
1 )) , (
( (9) Weight total similarity:
D SS
N
D
A
B
W
W
B
A
SetSim
B
A
S
(
,
)
=
(
,
)
⋅
+
(
(
,
))
⋅
(10) whereW
SS+
W
D=
1
,W
D=
1
−
W
SS.a k xk matrix of categories similarity, where Sij is the similarity between Ci and Cj that is established by above steps.
⎥
⎥
⎥
⎥
⎦
⎤
⎢
⎢
⎢
⎢
⎣
⎡
=
kk k k k k k kS
S
S
S
S
S
S
S
S
C
C
C
C
C
C
S
L
M
O
M
M
L
L
M
K
2 1 2 22 21 1 12 11 2 1 2 12) Transition matrix of Markov model
Research framework of step two is to create the transition matrix of Markov model
P
, which is based on web log file as well as similarity matrix. TheP
matrix is first-order transition matrix of Markov model and it is presented as follows:⎥
⎥
⎥
⎥
⎦
⎤
⎢
⎢
⎢
⎢
⎣
⎡
=
kk k k k k k kP
P
P
P
P
P
P
P
P
C
C
C
C
C
C
P
L
M
O
M
M
L
L
M
K
2 1 2 22 21 1 12 11 2 1 2 1 where∑
= = k j ij j i r TotalNumbe j i Number P 1 ) , ( ) ,( . (11)
Each element in the
P
matrix presents a transition probability between any two categories. Pij presents a transition probability which is calculated by equation (11) between category i and category j . The numerator of equation (11) is the number of transition times between categoryi
and category j, and the denominator is the total number of transition times between category i and every category k . The transition matrix of P2,...,Pn can be calculated by equation (3).3) Relevance matrix
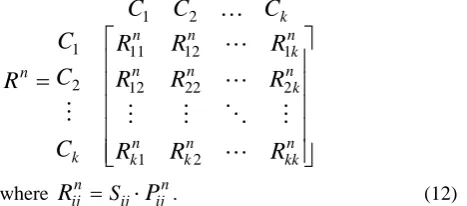
Research framework of step three is to create the relevance matrix. The element Rij of relevance matrix is equal to product of Sij and Pij, which are acquired from similarity matrix and transition matrix of Markov model respectively. In this paper, the relevance is an important factor of prediction between any two categories. The relevance can be used to infer the users’ browsing behavior between categories. The relevance matrix is presented as follows:
⎥
⎥
⎥
⎥
⎥
⎦
⎤
⎢
⎢
⎢
⎢
⎢
⎣
⎡
=
n kk n k n k n k n n n k n n k k nR
R
R
R
R
R
R
R
R
C
C
C
C
C
C
R
L
M
O
M
M
L
L
M
K
2 1 2 22 12 1 12 11 2 1 2 1where
R
ijn =Sij⋅
P
ijn. (12)n ij
R presents a relevance, which is calculated by equation
(12), between category i at time t−n and category j at time t; More high the value of Rnij means more relevance
between category
i
and category j.B. Two levels of prediction model
In the steps of prediction, the first-order and the second-order (n=2) transition matrix of Markov model and relevance matrix are used to predict users’ browsing behavior. In this paper, the establishment of prediction (as Fig. 5) is to predict the position
C
which depends on the positionB
andA
, now and past respectively. The two levels of predictions model are proposed in the paper. The category is predicted by level one and web page is predicted by level two.Figure5. Schematic Diagram of Prediction
1) Level one: predicting category
The level one prediction is try to find out the most possible category Ct, that the previous one state is category Ct−1or the previous two state is category Ct−2. The
θ
is a set of categories which are obtained by level one. Afterθ
is obtained, only the web pages belong to categoryθ
will be considered in level two instead of all. Thus, it will reduce the scope of the level two predictions. Cnn t
R − is the row vector for category Ct−n , that is [ , , , , ]
2 , 1 , n k C n C n
Ctn R tn R tn
R
− −
− L , from
relevant matrix
R
n, where we choose n=1 or n=2. The categoryC
t∈
θ
that are the corresponding categories which has top r value in the vector 11
−
t
C
R or 2
2
−
t
C
R .
θ
is defined as follows: t t C C | { =θ is the corresponding category that has top r value in the vector 1
1
−
t
C
R or 2 }
2
−
t
C
R
Figure6. Level One of Categories Prediction
2) Level two: predicting web pages
In the level two, Bayesian theorem is used to calculate probability that candidatepageb will be the successor (as Fig. 7).
τ
are the results of prediction in the level two, which are most r possible web pages that the users will visit. [image:4.595.47.281.657.760.2]a
page is the current visiting page and pageb is the candidate for the next user’s visiting web pages and limited by
θ
, that ispage
b∈
Categoryθ
, whereθ
is the results of level one prediction. It is assume that} ,
, {
2
1 b br
b Page Page
page
Pθ = L is a set of all Pages in
category
θ
.∑
= =
r j
b b
a
b b
a a
b
j j
i i
i
page P page page P
page P page page P page
page P
1
) ( ) |
(
) ( ) |
( ) |
( (13)
| {
i
b
Page =
τ The value of P(pageb |pagea) i
is top r in set Pθ}
IV. EXPERIMENT
The source of database in the experiment is from UCI Dataset Repository [17]. This repository contains a lot of different research fields. Therefore, this repository is very popular in the research field. The dated of the database is September, 28, 1999 on msnbc.com website and a part of news data is from msn.com website. Each sequence data is corresponding to users’ page views. The time interval is 24 hours. The categories are presented in sequential data. The 17 types of categories are frontpage, news, tech, local, opinion, on-air, music, weather, health, living, business, sports, summary, bbs, travel, msn-news, and msn-sports. The number of category is represented from 1 to 17 in the sequential data.
The UCI Dataset Repository is a quite popular database, but the users’ browsing behavior is just recorded by category in the database, the user’s web pages visiting are simulated by Gaussian distribution. The numbers of web pages in each category are assumed equal.
The experiment environment in this paper is HP dx5150. The hardware is performed on AMD Athlon 64 X2 Dual Core Processor 3800+ CPU, 1GB RAM and Microsoft Windows XP operating system. The software is performed on Java 1.6.0 Update 2.
Hit Ratio is calculated by equation (14) [11]. Hitratio is a ratio of cache access to requestall. cacheaccess is a number of the web page is found in the prediction. requestall is total number of the web pages which are browsed by users.
all access ratio
request cache
Hit = (14) The users’ browsing record is obtained and divided into training data and testing data. Training data is 80% which are 791,855 and testing data is 20% which are 197,963 of the web log file. The training data is used to establish the two levels of prediction model and the testing data is used to calculate in Hit Ratio.
There are five cases in level one prediction, which are Top-1, Top-2, Top-3, Top-4 and Top-5. The Hit Ratio is from 66.74% on top-1 relevance to 89.80% on Top-5 relevance (as Fig. 8).
Level one Hit Ratio
0.60 0.65 0.70 0.75 0.80 0.85 0.90 0.95
Top 1 Top 2 Top 3 Top 4 Top 5
Top-r relevance
Per
centage (%)
Hit Ratio
Figure8. Hit Ratio of Level One
In the experiments for level two, the number of web pages number is 40, 50 and 60 respectively. There are three cases for the prediction result, which are Top-10, Top-15, Top-20. The results are shown in the Fig. 9. For example, the Hit Ratio is from 74.71% (Top-10) to 94.30% (Top-20) when the number of web pages is 40.
Level two Hit Ratio
0.6 0.65 0.7 0.75 0.8 0.85 0.9 0.95
Top 10 Top 15 Top 20
Top r value
Per
centage (%)
60 pages 50 pages 40 pages
Figure9. Hit Ratio of Level Two
V. CONCLUSION AND FUTURE WORK
Because of the huge quantity of data of web pages on many portal sites, for convenience, are to assemble the web page based on category. In this paper, users’ browsing behavior will be observed at two levels to meet the nature of the portal. One is category level and the other is web page level. In level one is to predict category. The unnecessary categories can be excluded. The scope of calculation is massively reduced. Next, using Bayesian theorem in the level two to predict the users’ browsing page is more effective and accurate. The results of experiment prove the Hit Ratio is well in both levels.
REFERENCES
[1] S. Araya, M. Silva and R. Weber, “A Methodology for Web Usage Mining and Its Application to Target Group Identification,” Fuzzy Sets and Systems 148, pp. 139-152, 2004.
[2] W. Bin and L. Zhijing, “Web Mining Research,” ICCIMA’03 IEEE, pp. 84-89, 2003.
[3] S.K. De and P.R. Krishna, “Clustering web transactions using rough approximation,” Fuzzy Sets and Systems 148, pp. 131-138, 2004. [4] D. Dhyani, W. K. Ng and , S. S. Bhowmick, ”A Survey of Web
Metrics,” ACM Computing Surveys, Vol. 34 2002.
[7] R. Kosala, H. Blockeel, “Web Mining Research: A Survey,” SIGKDD Explorations, Volume 2, Issue 2, pp. 115.
[8] A.K. Jain, M.N. Murty and P.J. Flynn, “Data Clustering: A Review,” ACM Computing Surveys, Vol. 31, No. 3, 1999.
[9] S. Jespersen, T. B. Pedersen and J. Thorhauge, “Evaluating the Markov Assumption for Web Usage Mining,” WIDM’03, pp.82-89, 2003. [10] G. Pallis, L. Angelis, A. Vakali, “Vaildation and interpretation of Web
users’ sessions clusters,” Information Processing and Management 43, pp. 1348-1367, 2007.
[11] L. Shi, Z. M. Gu, L. Wei and Y. Shi ”Popularity-based Selective Markov Model,” WI’04, pp.504-507, 2004.
[12] J. Srivastava, R. Cooley, Mukund Deshpande and Pang-Ning Tan, ”Web Usage Mining:Discovery and Applications of Usage Patterns form Web Data,” SIGKDD Explorations, Vol. 1, Issue 2, pp. 12-23, Jan 2000.
[13] R. R. Sarukkai, ”Link prediction and path analysis using Markov chains,” Computer Networks, pp. 377-386, 2000.
[14] R. M. Suresh and R. Padmajavalli,” An Overview of Data Preprocessing in Data and Web Usage Mining,” Digital Information Management IEEE, pp. 193-198, 2006.
[15] R. Walpole, R. Myers, S. Myers and K. Ye, “Probability and Statistics for Engineers and Scientists ,” in Paperback, 7 ed., Pearson Education, 2002, pp.82-87.