warwick.ac.uk/lib-publications
Original citation:Vendra, C. Madhav Rao and Wen, Jennifer X. (2017) Numerical modelling of vented lean hydrogen–air deflagrations using HyFOAM. In: 26th International Colloquium on the Dynamics of Explosions and Reactive Systems (ICDERS), Boston, USA, 30 Jul – 4 Aug 2017
Permanent WRAP URL:
http://wrap.warwick.ac.uk/97146
Copyright and reuse:
The Warwick Research Archive Portal (WRAP) makes this work by researchers of the University of Warwick available open access under the following conditions. Copyright © and all moral rights to the version of the paper presented here belong to the individual author(s) and/or other copyright owners. To the extent reasonable and practicable the material made available in WRAP has been checked for eligibility before being made available.
Copies of full items can be used for personal research or study, educational, or not-for-profit purposes without prior permission or charge. Provided that the authors, title and full
bibliographic details are credited, a hyperlink and/or URL is given for the original metadata page and the content is not changed in any way.
A note on versions:
The version presented here may differ from the published version or, version of record, if you wish to cite this item you are advised to consult the publisher’s version. Please see the ‘permanent WRAP URL’ above for details on accessing the published version and note that access may require a subscription.
Numerical Modelling of Vented Lean Hydrogen–Air
Deflagrations using HyFOAM
Vendra C. Madhav Rao and Jennifer X. Wen*
Warwick FIRE, School of Engineering, University of Warwick, Coventry CV4 7AL, UK
Introduction
Hydrogen is being considered as a sustainable future energy carrier with least environmental impact in terms of combustion by-products. It has unique physical properties of very wide flammability range, between 4% to 75% by volume and high flame speeds, which are challenging factors in designing safe hydrogen installations. An accidental release in enclosures can easily result in the formation of flammable mixtures, which may upon ignition lead to fast turbulent deflagrations or even transition to detonation. Explosion venting is frequently used to mitigate explosions in industry, but it is not straightforward to design vent systems that will reduce the explosion pressure sufficiently to prevent collapse of structures and formation of projectiles. Validated predictive techniques will be of assistance to quantified analysis of possible accidental scenarios and designing effective mitigation measures such as vents. While explosion venting has been previous studied experimentally and numerically, relatively little information has been gathered about the configurations used in hydrogen energy applications and in the presence of obstacles; a viable predictive technique for such scenario is still lacking.
The use of standard 20 feet ISO shipping containers for self-contained portable hydrogen fuel cell power units is being widely considered. Fresh experiments for this configuration have been carried out by GexCon AS as part of the HySEA project supported by the Fuel Cells and Hydrogen 2 Joint Undertaking (FCH 2 JU) under the Horizon 2020 Framework Program for Research and Innovation. In the present study, numerical modelling and simulations have been conducted to aid our understanding of the vented gas explosion in these self-contained portable power units using HyFOAM, an in-house modified version of the open source Computational Fluid Dynamics (CFD) code OpenFOAM for vented hydrogen explosions. The convective and diffusive terms are discretised using Gaussian-Gamma bounded and Gaussian linear corrected numerical schemes with in OpenFOAM. The temporal terms are discretised using Euler implicit scheme making the solver second order accurate both in spatial and time coordinates.
Numerical Model
Vendra C. Madhav Rao
Lean hydrogen-air vented deflagration26th ICDERS – July 30th - August 4th, 2017 – Boston, MA 2
front locally propagates at unstretched laminar flame speed, and in the mean time stretched and strained by the turbulent flow field. The turbulence induced flame stretching increases flame surface area which results in an increase of the burning rate. The turbulent flame speed correlation and unstretched laminar flame speed correlation are important input parameters for this model. The volume fraction of the unburnt zone is denoted as regress variable (b), taking values b= 1 in fresh gases and b= 0 in fully burnt gas region. The thermophysical process of flame propagation is represented by the transport equation for the resolved part of regress variable given as:
. . sgs u L
b
Ub b S b
t
(1)
where,
is subgrid flame wrinkling, which can be regarded as the turbulent to laminar flame speed ratio and is formally related to the flame surface density by | b|, is the density, SLis laminar flame speed and sgs is the subgrid turbulent diffusion coefficient. Symbols with overbar (̅) and tilde (̃) represents the filtered and the density weighted filtering operations respectively. The subscripts uindicates conditioning on the unburned gases region. The resolved unburned gas volume fraction b is related to b through ubb. The closure for the sub-grid wrinkling is provided by a balanced transport equation,
( 1) max , 0
t
s t t s t t
U G R
t
(2)
where, Us is the surface filtered local instantaneous velocity of the flame, which is modelled as
( )
( 1)
| |
sgs u
s L f f
b
U U S n n
b
(3)
The direction of flame propagation is represented bynf b |b|,
S and
t are the surface filtered resolved strain-rates relating to the surface filtered local instantaneous velocity of the flame (Us) and surface filtered effective flame velocity of the flame surface (Ut) modelled as(
)
[
(
)]
t
U
S
L tn
fn
fU
S
L tn
fn
f
( ) ( 1)[ ( ) [ ( ) ]
2
f f t L f f L f f
s
t t
U n U n S n n S n n
(4)
The terms Gt and R( t 1) in Eq. 2 are sub-grid turbulence generation and removal rate, with G and
R as rate coefficients requiring modelling,
1
eq
eq G R
and
* * 0.28 1 eq eq R
,Ξ𝑒𝑞∗ = 1 +0.46 𝐿𝑒 𝑅𝑒𝑡
0.25( 𝑢̂ 𝑆𝐿𝑜)
0.3
and
eq1 2(1
b
) (
*eq1)
(5) where, 𝜏𝑛 is the Kolmogorov time scale, ˆu is the sub grid turbulence intensity and 𝑅𝑒𝑡 is the turbulent Reynolds number.thermodiffusive instabilities also affect the flame propagation in lean mixtures. Turbulent flame speed increases with decreasing Lewis number of the deficient reactant, this effect is especially profound for lean hydrogen mixtures, which are typical in facilities which use venting as a measure for explosion mitigation. The incorporation of the Lewis number (Le) effect is hence important for numerical modelling of the vented hydrogen explosion scenario. In HyFOAM, this is accounted for in Eq.5 by taking into account the Lewis number (Le) effects in the turbulent flame speed correlation using the algebraic reaction rate closure proposed by Muppala et al. [4], which has been successfully applied to both pure and mixed fuels involving different Lewis numbers [2,5-6] in both RANS and LES simulations. Its predictions for the turbulent flame speed (ST) for equivalence ratio between and inclusive of 0.4 and 0.8 along with Goulier et
[image:4.612.220.417.239.393.2]al [8] correlation are compared with the experimental measurements of Kitagawa et al. [7] in Figure 1. The predicted ST trends are consistent with the measurements.
Figure 1. Comparison of the turbulent flame speed correlation of Goulier et al. [8], Muppala et al.[4] with the experimental data of Kitagawa et al. [7] (Green line – Muppala, Red – Goulier, blue – Kitagawa )
The flame wrinkling due to the Darreius-landau instability is modelled as algebraic expression based on Bauwens et al. [9] as,
1/ 3
1
max 1, DL
c
(6)
Where, 𝜆𝑐 is the cut off wavelength of unstable scales and ∝1 is a coefficient to account for uncertainty in 𝜆1. The values used in these constants are based on experimental findings of Bauwens et al. [9].
The unstrained laminar flame speed (SL,0) for lean hydrogen-air mixture is adopted based on
numerical study carried out by Verhelst [10] for evaluating SL at a given equivalence ratio (
1/
) and reference condition expressed as power law function of elevated temperature and pressure,𝑆𝐿= 𝑆𝐿0(𝜆, 𝑃) (𝑇𝑇𝑢 𝑢0)
∝( 𝜆 , 𝑃)
(7)
𝑆𝐿0= 499.63 − 308.60𝜆 + 48.887𝜆2− 76.238𝑃 + 4.825𝑃2+ 45.813𝜆𝑃 − 2.926𝜆𝑃2− 7.163𝜆2𝑃
+ 0.436𝜆2𝑃2
𝛼(𝜆, 𝑃) = 1.85175 − 0.70875𝜆 + 0.50171𝜆2− 0.19366𝑃 + 0.0067834𝑃2+ 0.27495𝜆𝑃
Vendra C. Madhav Rao
Lean hydrogen-air vented deflagration26th ICDERS – July 30th - August 4th, 2017 – Boston, MA 4
where 𝑆𝐿 in cm/s , P is pressure in bar and 𝑇𝑢 the unburnt gas temperature in K. The above correlation is valid for the equivalence ratios (𝜙) between 0.33 and 0.47 (lean mixtures), pressures range of 1bar ≤ P ≤ 8.5 bar and temperature range of 300 K ≤ T ≤ 800 K, with reference state Tu0 = 300 K. The flame
wrinkling factor in eq. 1 is given as
*
t DL
(8)
Equations (1)-(8) complete the combustion model in HyFOAM for lean hydrogen-air mixtures.
Experiments considered
The standard 20-ft ISO container of 20’ × 8’× 8’.6” was used in the experiments carried out by GexCON AS [11]. The container was positioned 0.36 m above ground level on H-beams. The pressure sensors are positioned in the U-beams frame (200 mm × 75 mm placed on floor) along the side walls of the container as shown in Figure 2. Within the container the pressure sensors were placed symmetrically at distances 0.86 m (P1-P2), 2.45 m (P3-P4), 4.0 m (P5-P5) and 5.56 m (P7-P8) from the backend wall. Outside the open doors of the container, the pressure probes were placed at elevation of 1.65m and at 5 m (P9), 10 m (P10) and 15 m (P11) from the open end along the centreline. The series of experiments were conducted for different hydrogen concentrations, both with and without any obstacles inside the container. As the first step of validation for HyFOAM, the present study considered the case with no internal obstacles and the doors were fully open with 15% hydrogen concentration by volume. The mixture was ignited by an electric inductive spark at the centre of the back end wall at the mid height of the container.
(a)
Isometric view (b) Cut section along the centreline Figure 2. The standard 20-ft ISO container with frame to hold the pressure sensors in the experiments.Computational details
Figure 3. The computational domain and mesh distribution in a vertical plane.
The boundary conditions applied to the geometry were non-slip, adiabatic walls for the chamber walls and the ground as a conservative approximation. The ‘totalPressure’ and ‘pressureInletOutletVelocity’ boundary conditions were used for pressure and velocity respectively at the open boundaries. The ‘totalPressure’ boundary pressure is evaluated by subtracting the dynamic pressure from the total pressure value specified and the ‘pressureInletOutletVelocity’ assigns a velocity based on the flux in the patch-normal direction. This combination of pressure and velocity boundary conditions allows for the flow reversal at the open boundary patch. An open vent was used in the simulations with premixed fuel mixture initialized in the chamber volume. The random velocity field of the turbulent root mean square velocity u’= 0.1 m/s was initialized in the entire domain considering a low initial turbulence with in the domain. The mixture concentration of 15% hydrogen in air has approximately 0.42 equivalence ratio, the unstretched laminar flame speed is around 0.35 m/s, Lewis number 0.42 and mixture fraction 0.0122.
Results and discussion
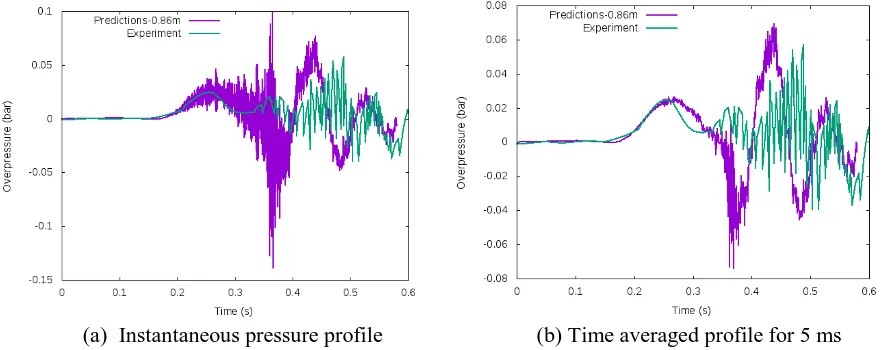
The predictions are compared with the experimental measurements in Figure 4 for the peak overpressure at P1 location (at the moment only this experimental pressure trace curve is available with the authors to publish). The predicted overpressure trace curves for the pressure probe located within the container are shown in Figure 5(a) and outside in-front of the open container in Figure 5(b) after time averaging the curves for 5 ms, for showing the gross trend of the pressure-time curves.
[image:6.612.98.541.466.641.2]
(a) Instantaneous pressure profile (b) Time averaged profile for 5 ms
Vendra C. Madhav Rao
Lean hydrogen-air vented deflagration26th ICDERS – July 30th - August 4th, 2017 – Boston, MA 6
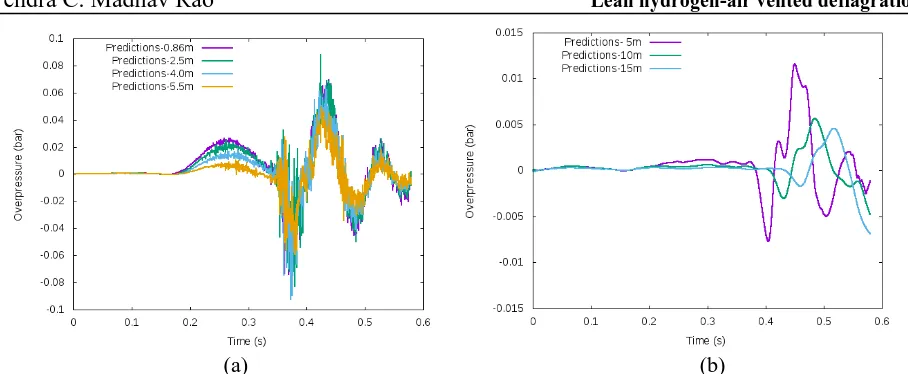
[image:7.612.92.546.87.274.2]
(a) (b)
Figure 5. The predicted pressure trace curves time averaged over 5 ms for other locations: (a) inside the container, (b) outside and in front of the open container door.
The second peak in the pressure trace curves in the container is much more oscillatory due to the presence of Helmholtz oscillation generated by venting of the bulk of the hot gases. It should be noted that the frequency of the oscillations observed in experiments were also affected by the structural vibrations of the container walls, which are not included in numerical simulations using the rigid wall assumption. In the experiments the container walls bulged and contracted during the positive and negative phase of the generated overpressures, this could be the reason for absence of strong negative pressure phase in the experiments as observed in the numerical simulations. Figure 5 (b) also shows that the vented explosion of 15% volumetric concentration of hydrogen in the container produced an overpressures greater than 9.8 kPa roughly up to 5 m from the container open end. Considering that 9.8 kPa overpressure is the human tolerable limit, such information is important in defining the safety distances around the hydrogen process installations.
Concluding remarks
HyFOAM has been developed on the basis of the open source CFD code OpenFOAM for vented hydrogen explosions. The flame surface wrinkling turbulent combustion model is improved with turbulent flame speed correlation accounting Lewis number effect and Darreius-landau instabilities along with suitable unstretched laminar flame speed correlation for modelling vented lean hydrogen gas explosion. As the first step of validation, predictions have been conducted for the lean hydrogen-air vented deflagration tests in an ISO container without obstacles. The predicted pressure trace curve at the peak pressure location is found to be in reasonably good agreement with the experimental data. The results have demonstrated the potential of the present numerical modelling for simulating lean hydrogen-air mixtures deflagrations in vented explosions scenarios.
Acknowledgement
The HySEA project is supported by the Fuel Cells and Hydrogen 2 Joint Undertaking (FCH 2 JU) under the Horizon 2020 Framework Program for Research and Innovation.
References
[2] Chakarborty, N., Cant, R.S, Effects of Lewis number on flame surface density transport in turbulent premixed combustion (2011). Comb. and Flame. 9:158.
[3] Weller, H. G., Tabor, G., Gosman, A. D., and Fureby, C., Application of a flame wrinkling LES combustion model to a turbulent mixing layer (1998), Proc. of Combust. Inst., 27.
[4] Muppala Reddy, S. P., Aluri Naresh K., Dinkelacker, F., Development of an algebraic reaction rate closure for the numerical calculation of turbulent premixed methane, ethylene, and propane/air flames for pressure up to 1.0 MPa (2005), Combust. And Flame, 140.
[5] Burke, E., M., Singlitico A., Morones, A., Petersen, E., L., Guthe, F., BiruteBunkute, Speth, R., L., Monaghan, R., F., D., progress towards a validated Cantera-based turbulent flame speed solver (2015), Proc. of the European Combust. Meeting.
[6] Muppala, S., P., R., Nakahara, M., Aluri, H., Kido, Wen, J. X, Papalexandris, M. V., Experimental and analytical investigation of the turbulent burning velocity of two-component fuel mixtures of hydrogen methane and propane (2009), Int. Journal of Hyd. Energy, 22:34.
[7] Kitagawa, T., Nakahara, T., Maruyama, K, Kado, K., Hayakawa, A., Kobayashi, S., Turbulent burning velocity of hydrogen-air premixed propagating flames at elevated pressure (2008), Int. Jol. of hyd. Energy, 20:33.
[8] Goulier, J. Comandini, A., Halter, F., Chayumeix, N., experimental study on turbulent expanding flames of lean hydrogen/air mixtures (2016), Proc. Combust. Inst.
[9] Bauwens, C. R., Chaffee, J. Dorofeev, S. B., Vented explosion overpressures from combustion of hydrogen and hydrocarbon mixtures (2011). Int. Journal of Hyd. Energy, 36.
[10] Verhelst, S., A laminar velocity correlation for hydrogen/air mixtures at spark ignition engine conditions (2003), Spring Technical Conf. of ASME internal Combust. Engine division, ICE2003.
![Figure 1. Comparison of the turbulent flame speed correlation of Goulier et al. [8], Muppala et al.[4] with the experimental data of Kitagawa et al](https://thumb-us.123doks.com/thumbv2/123dok_us/9451915.452386/4.612.220.417.239.393/figure-comparison-turbulent-correlation-goulier-muppala-experimental-kitagawa.webp)