warwick.ac.uk/lib-publications
Permanent WRAP URL:http://wrap.warwick.ac.uk/103479/
Copyright and reuse:
This thesis is made available online and is protected by original copyright. Please scroll down to view the document itself.
Please refer to the repository record for this item for information to help you to cite it. Our policy information is available from the repository home page.
Synthesis of Biodegradable
Microparticles for Controlled Active
Ingredient Release
By
Annette Louise Christie
Submitted for the degree of Doctor of Philosophy
Department of Chemistry
University of Warwick
I Table of Contents ... I
List of Figures, Schemes and Tables... X
Figures ... X
Schemes... XXIV
Tables ... XXVI
Acknowledgements ... XXVIII
Declaration of Authorship ... XXIX
Abstract ... XXX
Abbreviations ... XXXII
1. Introduction ... 1
1.1 Polymers in Agriculture ... 2
Current Challenges Facing Agriculture ... 2
Polymer Synthesis ... 4
1.1.2.1 Free Radical Polymerisation ... 6
1.1.2.2 Controlled Polymerisation ... 7
Ring-Opening Polymerisation of Polyesters ... 7
1.2 Controlled Release Using Polymeric Materials ... 11
Controlled Release from Microparticles ... 11
1.2.1.1 Microparticle Synthesis ... 13
1.2.1.2 Single Oil-in-Water Solvent Evaporation ... 13
II
1.2.1.4 Microfluidic Devices ... 20
Controlled Release Using Degradable Microparticles ... 23
1.2.2.1 Biodegradable Polymers ... 23
1.2.2.2 Biodegradable Microparticles ... 24
1.2.2.2.1 Polyesters for Biodegradable Microparticles ... 27
1.2.2.3 Typical Release Profiles ... 29
1.3 Smart Release Technology ... 32
Stimulus-Responsive Particles ... 32
Smart Release in Agriculture ... 34
1.4 Conclusions ... 36
1.5 References ... 37
2. Synthesis of Microparticles from Biodegradable Polymers... 50
2.1 Introduction ... 51
2.2 Results and Discussion ... 54
2.2.1 Ring-Opening Polymerisation of Cyclic Monomers ... 54
2.2.1.1 L-Lactide ... 54
2.2.1.2 D, L-Lactide ... 56
2.2.1.3 ɛ-Caprolactone ... 58
2.2.1.4 β-Butyrolactone ... 60
III
Mg(BHT)2(THF)2 ... 65
2.3 Microparticle Formation ... 67
2.3.1 Varying Shear Time vs Particle Size ... 67
2.3.2 Shear Speed Versus Time ... 69
2.3.3 Particle Size Versus Stabiliser Concentration ... 71
2.3.4 Temperature Effect on Particle Formation ... 73
2.3.5 Molecular Weight Versus Particle Size ... 77
2.3.6 Varying Polymer ... 78
2.4 Conclusions ... 80
2.5 References ... 82
3. Model Encapsulation and Release of a Fluorophore Using Biodegradable Microparticles ... 85
3.1 Introduction ... 86
3.2 Encapsulation ... 89
3.2.1 Encapsulation of Rhodamine B ... 89
3.2.2 Encapsulation of Nile Red ... 90
3.2.2.1 Controlled Release of Nile Red ... 93
3.2.3 Encapsulation of Aminobromomaleimide ... 95
3.2.3.1 Release of ABM from PLLA 100 Microparticles ... 96
3.2.3.2 Particle Swelling ... 97
IV
3.3.1 Varying Degradation Media ... 102
3.3.1.1 Aqueous Medium ... 102
3.3.1.2 Enzymatic Medium ... 106
3.3.1.3 Varying pH ... 110
3.3.1.3.1 Acidic Media ... 110
3.3.1.3.2 Basic Media ... 113
3.4 Conclusions ... 115
3.5 References ... 116
4. Controlled Fluorophore Release via Microparticle Degradation ... 119
4.1 Introduction ... 120
4.2 Results and Discussion ... 122
4.2.1 Microparticle Degradation and Release ... 122
4.2.1.1 Varying Molecular Weight ... 122
4.2.1.2 Varying Polymer ... 127
4.2.1.2.1 Encapsulation of ABM into Varying Polymeric Microparticles 127 4.2.1.2.2 Poly(D,L-Lactic Acid) ... 130
4.2.1.2.3 Poly(ɛ-Caprolactone) ... 133
4.2.1.2.4 Poly(3-Hydroxybutyrate) ... 135
4.3 Conclusions ... 141
V
5.1 Introduction ... 145
5.2 Results and Discussion ... 148
Synthesis of pH-Responsive Polymer ... 148
5.2.1.1 Step-Growth Polymerisation of Methyl Malic acid ... 148
5.2.1.2 Step growth Polymerisation of Ethyl Malic acid ... 151
Synthesis of pH-Responsive Particles ... 153
5.2.2.1 Poly(Ethyl Malic acid) Particle Synthesis ... 153
5.2.2.2 Synthesis of Poly(Ethyl Malic Acid)/ Poly(L-Lactide) Particles 156 Synthesis of Light Responsive Particles ... 162
5.2.3.1 Step-Growth Polymerisation of Poly(Nitrobenzyl Malic acid) .. 162
5.2.3.2 DIC Coupling of Poly(Nitrobenzyl Malic acid) ... 163
5.2.3.3 Particle Synthesis Using Blends of Poly(L-Lactide) and Poly(Nitrobenzyl Malic Acid) ... 165
5.2.3.4 Degradation and Release from Particle Blends of Poly(L-Lactide) and Poly(Nitrobenzyl Malic acid) Synthesised via Polycondensation ... 170
5.3 Conclusions ... 175
5.4 References ... 177
6. Synthesis of Degradable Microparticles via Radical Ring-Opening Polymerisation of Vinyl Acetate and a Cyclic Ketene Acetal ... 181
6.1 Introduction ... 182
VI
6.2.2 Microparticle Synthesis Using Poly(Vinyl Acetate) ... 188
6.2.3 Free Radical Copolymerisation of P(MDO-co-VAc) ... 193
6.2.4 Microparticle Synthesis Using P(MDO-co-VAc) ... 196
6.3 Conclusions ... 203
6.4 References ... 205
7. Microparticles, Films and Polymerisation-Induced Self-Assembly with Poly(ω-Pentadecalactone) and its Copolymers... 207
7.1 Introduction ... 208
7.2 Results and Discussion ... 211
7.2.1 Poly(ω-Pentadecalactone) Microparticles ... 211
7.2.1.1 Ring-Opening Polymerisation of Poly(ω-Pentadecalactone) ... 211
7.2.1.2 Synthesis of PPDL Microparticles ... 213
7.2.2 Synthesis of Thin Films from Poly(ω-Pentadecalactone), Poly(ɛ-Caprolactone) and their Copolymers ... 217
7.2.2.1 Copolymerisation of Poly(ω-Pentadecalactone) and Poly(ɛ-Caprolactone) ... 217
7.2.2.2 PPDL Film Formation ... 220
7.2.2.2.1 Solvent Casting ... 220
7.2.2.2.2 Spin Coating ... 221
VII
ɛ-Decalactone) ... 224
7.2.3.1 ROP of P(PDL-co-ɛDL) ... 225
7.2.3.2 Homopolymerisation of ɛ-Decalactone and ω-Pentadecalactone 229 7.2.3.3 Solubility Study ... 232
7.2.3.4 Self-Assembly of Poly(ω-Pentadecalactone-co-ɛ-Decalactone) 233 7.2.3.5 Attempt at PISA of Poly(ω-Pentadecalactone-co-ɛ-Decalactone) 235 7.3 Conclusions ... 236
7.4 References ... 238
8. Conclusions and Future Work ... 241
8.1 Conclusions ... 242
8.2 Future Work ... 244
9. Experimental ... 246
9.1 Materials ... 247
9.2 Instrumental Methods... 248
9.3 Experimental Procedures ... 249
9.3.1 General Experimental Procedures for Chapter 2 ... 249
9.3.1.1 General Ring-Opening Polymerisation Procedure for Lactide ... 249
VIII
Butyrolactone ... 251
9.3.1.4 General Procedure for Microparticle Synthesis ... 251
9.3.1.5 General Procedure for Encapsulation of a Fluorescent Dye ... 252
9.3.2 General Experimental Procedures for Chapter 3 ... 252
9.3.2.1 Typical Procedure for Microparticle Swelling Study ... 252
9.3.2.2 General Procedure for Microparticle Degradation and Release Studies 253 9.3.3 Experimental Procedures for Chapter 5 ... 253
9.3.3.1 General procedure for functionalisation of malic acid ... 253
9.3.3.2 Typical step growth polymerisation of functionalised malic acid 254 9.3.3.3 Typical DIC coupling of nitrobenzyl malic acid ... 255
9.3.3.4 General procedure for microparticle synthesis using homopolymer blends 256 9.3.3.5 General procedure for UV-triggered microparticle degradation 256 9.3.4 Experimental Procedures for Chapter 6 ... 257
9.3.4.1 Typical procedure for the radical-ring-opening polymerisation of vinyl acetate ... 257
9.3.4.2 Typical procedure for the radical ring-opening copolymerisation of MDO and vinyl acetate ... 257
IX
Mg(BHT)2(THF)2 ... 258
9.3.5.2 Typical procedure for the copolymerisation of ω-pentadecalctone and a lactone ... 259
9.3.5.3 Typical procedure for film synthesis via solvent casting ... 260
9.3.5.4 Typical procedure for film synthesis via spin coating ... 260
9.3.5.5 General procedure for film degradation... 260
9.3.5.6 Typical polymerisation-induced self-assembly procedure for poly(ω-pentadecalactone-co-ɛ-decalactone) ... 260
9.4 References ... 261
10. Appendix ... 262
10.1 Complementary Data for Chapter 3 ... 263
10.1.1 PLLA 100 Particle Degradation and Release in PBS ... 263
10.1.2 Empty PLLA 100 Particle Degradation ... 264
10.2 Complimentary Data for Chapter 4 ... 266
10.2.1 PLLA 25 Particle Degradation and Release in Water ... 266
10.2.2 PLLA 250 Particle Degradation and Release in Water ... 268
10.2.3 PDLLA 100 Particle Degradation and Release in Water ... 269
X
Figures
Figure 1.1: Graphical representation of the world population’s growth from 1960 to
the predicted population in 20504 ... 2
Figure 1.2: Graphical representation of desired pesticide concentration vs. actual
pesticide concentration as a function of time from conventional and controlled release
systems5 ... 4
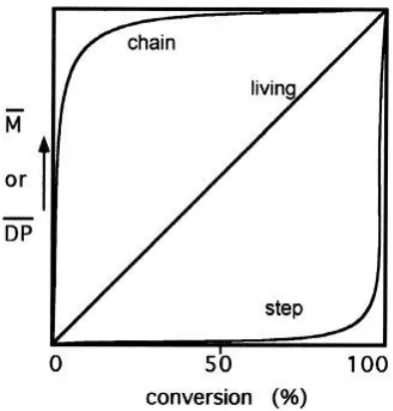
Figure 1.3: Graphical representation of the difference in molecular weight evolution
against conversion for chain-growth, step-growth and living polymerisation
procedures ... 5
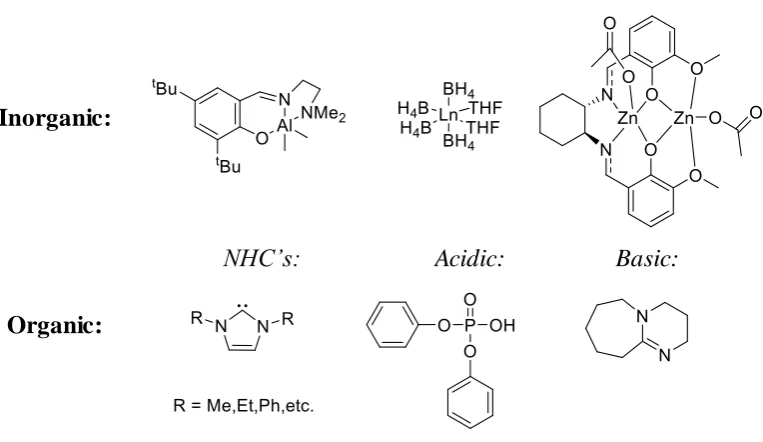
Figure 1.4: Selection of representative catalysts applied for the ROP of cyclic lactones,
M = metal centre, Ln = Ligand34, 37-41 ... 9
Figure 1.5: Diagrammatic representation of the two main types of microparticles ... 12
Figure 1.6: Schematic representation of microparticle synthesis via single oil-in-water
solvent evaporation ... 14
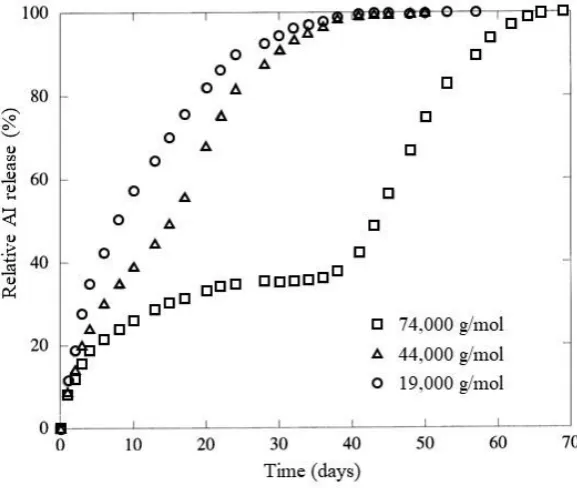
Figure 1.7: Graph displaying the difference in release rate obtained from PLGA
microparticles with varying PLGA molecular weight79 ... 16
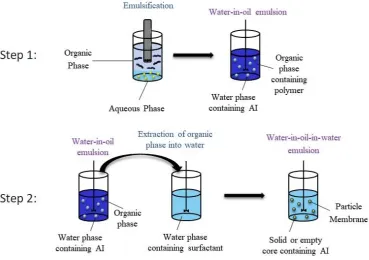
Figure 1.8: Schematic representation of microparticle synthesis via double oil-in-water
solvent evaporation technique ... 19
Figure 1.9: Schematic representation of microparticle synthesis using a microfluidic
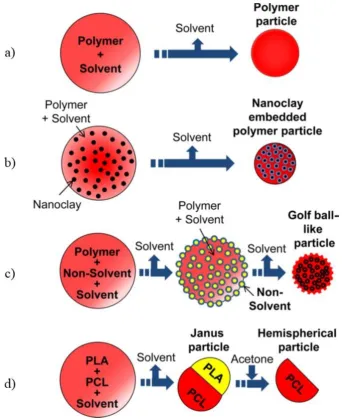
device a) and b) PLA/ nanoclay in dichloromethane organic phase with varied nozzle
diameter105 ... 21
Figure 1.10: Diagrammatic illustration of structures synthesised by Ekanem et al.
XI
hemispherical particle105 ... 22
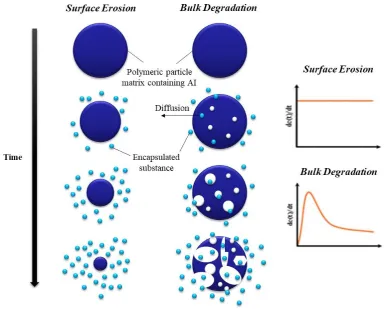
Figure 1.11: Schematic representation of surface and bulk degradation occurring within a matrix microparticle ... 27
Figure 1.12: SEM characterisation of PLA microparticle degradation in Titrisol buffer solution (pH 7, merck reagent) after a) 0 days, b) 9 days and c) 143 days as observed by Gonzalez et al.128 ... 28
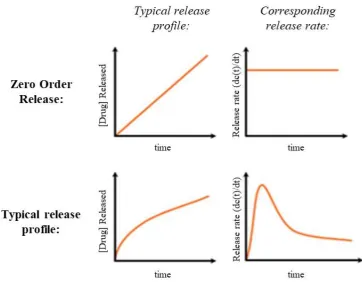
Figure 1.13: Graphical representation of an idealistic zero-order AI release profile vs. a conventional biphasic AI release profile ... 30
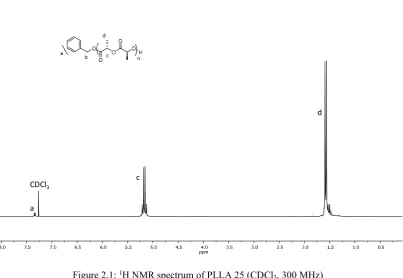
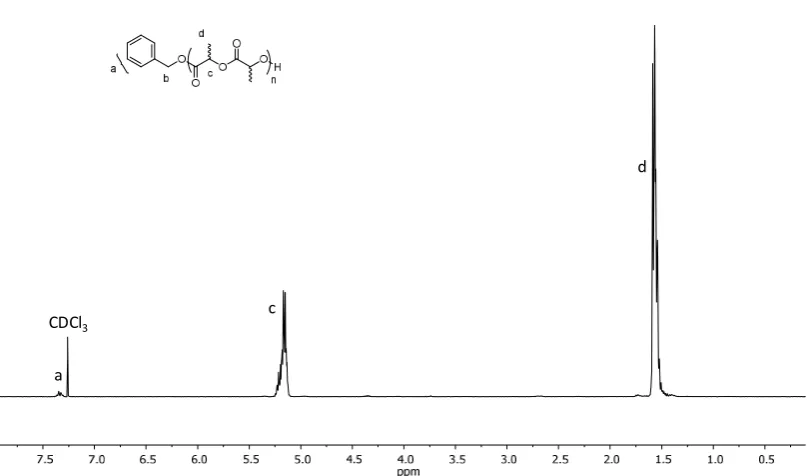
Figure 2.1: 1H NMR spectrum of PLLA 25 (CDCl3, 300 MHz) ... 55
Figure 2.2: Normalised SEC traces for PLLA DP 25, 75, 100 and 250 (CHCl3, polystyrene (PS) standards)... 55
Figure 2.3: 1H NMR spectrum of PDLLA 25 (CDCl3, 300 MHz) ... 57
Figure 2.4: Normalised SEC traces for PDLLA DP 25, 75, 150 and 250 (CHCl3, PS standard) ... 57
Figure 2.5: 1H NMR spectrum of PCL 25 (CDCl3, 300 MHz) ... 59
Figure 2.6: Normalised SEC traces for PCL DP 25, 75, 150 and 250 (CDCl3, 300 MHz) ... 59
Figure 2.7: 1H NMR spectrum of PHB 75 (CDCl3, 300 MHz) ... 61
Figure 2.8: SEC characterisation of PHB 75 (CHCl3, PS standards)... 61
Figure 2.9: SEC of 2 M β-BL over 30 min at 80 ºC (CHCl3, PS standards)... 63
Figure 2.10: 1H NMR spectrum showing crotonate formation during PHB 100 polymerisation with Mg(BHT)2(THF)2 ... 65
XII of volume against particle size and b) Table showing resultant volume weighted mean
particle size and dispersity ... 68
Figure 2.13: Mastersizer analysis showing the size distribution of PCL 25
microparticles at varying shear speeds ... 69
Figure 2.14: Optical microscopy images for PCL 25 microparticles after 30 s at a)
3000 rpm, b) 5000 rpm, c) 7000 rpm and d) 9000 rpm ... 70
Figure 2.15: Mastersizer analysis showing change in size after 15 min Initial size: D[4,
3] = 10.5 μm, size after 15 min: D[4, 3] = 173 μm ... 71
Figure 2.16: Optical microscopy images for microparticles after shear at 7000 rpm for
45 s left for 15 min ... 71
Figure 2.17: Mastersizer characterisation a) graphical analysis showing the change in
particle size with varying [PVA] b) the change in volume weighted mean and particle
size distribution with varying [PVA] ... 72
Figure 2.18: Mastersizer analysis showing PCL 25 microparticles initially and 36 h
after emulsification at 7000 rpm for 30 s at 2% PVA ... 73
Figure 2.19: Mastersizer characterisation a) graphical analysis showing the change in
size distribution of particles whilst heated at 30 °C and unheated particles during
particle hardening after 24 h a and b) table showing the change in volume weighted
mean and particle size distribution ... 74
Figure 2.20: Optical microscopy images displaying the particle morphology of PCL
25 microparticles during particle hardening when heated for a) 2 h 30 and b) 24 h and
unheated for c) 2 h 30 and d) 24 h ... 75
Figure 2.21: a) Confocal microscopy images for the heated PCL 25 after 24 h b)
XIII using varying molecular weight PCL ... 77
Figure 2.23: Optical microscopy images of a) PCL 25 b) PCL 75 c) PCL 100 and d)
PCL 250 ... 78
Figure 2.24: SEM analysis for a) PLLA 100 b) PDLLA 100, c) PCL 100 and d) PHB
100 polymeric particles ... 79
Figure 3.1: UV/Vis spectrum showing absorbance for free Rhodamine B and a sample
of the solution after encapsulation into PLLA 100 microparticles ... 89
Figure 3.2: Chemical structure of Nile red... 91
Figure 3.3: Optical microscope image of PLLA DP 100 microparticles with 1 wt%
encapsulated Nile red ... 91
Figure 3.4: Light Scattering analysis of PLLA 100 microparticles containing Nile red
(1 wt%) ... 92
Figure 3.5: Fluorescence intensity of encapsulated Nile red compared to known
standards of varying [Nile red] ... 92
Figure 3.6: Release rate of Nile red from PLLA 100 particles into a 50% Water: EtOH
solvent ... 94
Figure 3.7: a) TEM and b) SEM analysis of particles without dye c) TEM and d) SEM
analysis of particles with 1 wt% dye loading of Nile red ... 95
Figure 3.8: Chemical structure of Aminobromomaleimide ... 96
Figure 3.9: SEM images of PLLA microparticles containing 1 wt%
aminobromomaleimide ... 96
Figure 3.10: 2D excitation-emission spectra (with a 10 nm step) of the ABM in a 50%
XIV a 50:50 water: ethanol solution and b) water ... 98
Figure 3.12: Optical microscopy characterisation of PLLA particles in a) water, b) A
50:50 water and ethanol solution i) Initial solution, ii) 6 h, iii) 12 h and iv) 24 h ... 99
Figure 3.13: a) Plot showing the change in fluorescence intensity at each calibration
concentration and b) Plot detailing how the fluorescence intensity changes between
washes with deionised water ... 100
Figure 3.14: SEM characterisation of PLLA 100 microparticles after a) 0 months, b)
4 months, c) 8 months and d) 12 months in water ... 103
Figure 3.15: SEC characterisation of PLLA 100 particle degradation after 12 months
in water ... 104
Figure 3.16: Plate reader characterisation detailing the observed change in
fluorescence intensity over 5 h for free dye and dye encapsulated into PLLA 100
particles over 12 months ... 106
Figure 3.17: SEM characterisation of PLLA 100 microparticles after a) 0 months, b)
4 months, c) 8 months and d) 12 months in Cleanzyme ... 107
Figure 3.18: SEM characterisation of PLLA 100 microparticles after 6 months
degrading in Cleanzyme with varied magnification a) 10 μm, b) 2 μm, c) 1 μm and d)
200 nm ... 108
Figure 3.19: SEC characterisation of PLLA 100 particles after degradation in
Cleanzyme for 12 months ... 109
Figure 3.20: Plate reader characterisation detailing the observed change in
fluorescence intensity over 5 h for PLLA 100 particles after degradation in Cleanzyme
XV 4 months, c) 8 months and d) 12 months at pH 5 ... 111
Figure 3.22: SEC characterisation of PLLA 100 particles after degradation for 12
months at pH 5 ... 112
Figure 3.23: Plate reader characterisation detailing the observed change in
fluorescence intensity for PLLA 100 particles after degradation at pH 5 for 12 months
... 113
Figure 3.24: Fluorescence intensity of ABM after 1 month in a) water (pH 7) and b)
basic solution (pH 10) ... 114
Figure 4.1: Stereoisomers arising from the two chiral centres of Lactide ... 121
Figure 4.2: Characterisation of the change in particle morphology observed via SEM
with PLLA 25 after a) 0 months, b) 2 months, c) 4 months and d) 6 months in
Cleanzyme solution ... 123
Figure 4.3: Characterisation of the change in particle morphology observed with
PLLA 250 after a) 0 months, b) 3 months, c) 6 months and d) 8 months ... 123
Figure 4.4: Characterisation of PLLA microparticle degradation in Cleanzyme
solution via SEC a) PLLA 25, b) PLLA 250 ... 124
Figure 4.5: Release into water/ethanol observed with a) PLLA 250 and b) PLLA 25
and c) change in E with both PLLA 25 and PLLA 250 in Cleanzyme solution ... 126
Figure 4.6: SEM analysis of PCL microparticles with a) 1 wt% ABM, b) 0.5 wt%
ABM, c) 0.1 wt% ABM and d) No dye ... 129
Figure 4.7: Characterisation of the change in particle morphology observed with
PDLLA 100 in Cleanzyme solution via SEM after a) 0 months, b) 3 months, c) 6
XVI solution via SEC over 8 months ... 132
Figure 4.9: [ABM] released from PDLLA 100 particles observed by release study into
water/ethanol over 8 months ... 133
Figure 4.10: SEM characterisation of the change in particle morphology observed with
PCL 100 in Cleanzyme solution after a) 0 months, b) 3 months, c) 6 months and d) 9
months ... 134
Figure 4.11: Characterisation of PCL 100 microparticle degradation in Cleanzyme
solution via SEC over 9 months ... 135
Figure 4.12: Particle release observed by release study into water/ethanol observed
over 9 months ... 135
Figure 4.13: SEM analysis of PHB after a) 0 months, b) 2 months, c) 4 months and d)
5 months in water ... 136
Figure 4.14: SEM analysis of PHB after a) Initial sample, b) 1 month, c) 2 months and
d) 3 months in enzymatic solution ... 137
Figure 4.15: SEC characterisation of PHB in a) water and b) enzymatic solution .. 138
Figure 4.16: [ABM] released from PHB 100 particles observed by release study into
water/ethanol in a) Water and b) Cleanzyme ... 139
Figure 4.17: Change in E observed with ABM encapsulated into PHB 100 particles in
water and Cleanzyme ... 140
Figure 5.1: Crude 1H NMR spectrum of PMeMA synthesised via step-growth
polymerisation, * = olefinic hydrogen of fumaric acid, (CDCl3, 300 MHz) ... 149
Figure 5.2: SEC characterisation of PMeMA synthesised via step growth
XVII malic acid (CDCl3, 300 MHz) ... 151
Figure 5.4: 1H NMR spectrum of PEtMA synthesised via step growth polymerisation,
* = olefinic hydrogen of fumaric acid, (CDCl3, 300 MHz) ... 152
Figure 5.5: SEC characterisation of PEtMA synthesised via step-growth
polymerisation, (CHCl3, PS standard) ... 153
Figure 5.6: SEM analysis of PEtMA particles prepared via single oil-in-water solvent
evaporation technique ... 154
Figure 5.7: SEM characterisation of PEtMA particles using acetone as organic solvent
... 155
Figure 5.8: DLS characterisation of PEtMA (30 wt %) after 15 s of shear on a Silverson
high shear mixer at 5000 rpm... 156
Figure 5.9: SEM images of a) PLLA 100 microparticles and b) PLLA 100
microparticles with PEtMA (25 wt%)... 157
Figure 5.10: SEM characterisation of PLLA 100 microparticles with PEtMA (5 wt%)
prepared via single oil-in-water solvent evaporation ... 158
Figure 5.11: SEM characterisation of PLLA 100 microparticles with 5 wt% PEtMA
prepared using single oil-in-water emulsion with CHCl3 as organic solvent ... 159
Figure 5.12: DSC thermograms of a) PLLA 100 polymer b) PLLA 100 particles c)
PEtMA particles and d) Microparticle blend of PLLA 100 with PEtMA (25 wt%) 160
Figure 5.13: 1H NMR spectrum of PNO2BnMA synthesised via step growth
polymerisation (CDCl3, 300 MHz) ... 163
Figure 5.14: 1H NMR spectrum of PNO2BnMA synthesised via DIC coupling ... 164
Figure 5.15: SEC chromatogram of PNO2BnMA prepared via DIC coupling (CHCl3,
XVIII PLLA 100 and PNO2BnMA (50 wt%) ... 165
Figure 5.17: SEM characterisation of a particle blend of PLLA 100 and PNO2BnMA
(50 wt%) ... 166
Figure 5.18: SEM characterisation of particle blends of PNO2BnMA and PLLA 100
with 50 wt% PNO2BnMA ... 167
Figure 5.19: SEM characterisation of particle blends of PNO2BnMA and PLLA 100
with 5 wt% PNO2BnMA ... 167
Figure 5.20: DSC thermograms displaying the second heating cycle of a) PLLA
polymer b) PNO2BnMA polymer c) a particle blend of PLLA 100 with 50 wt%
PNO2BnMA ... 168
Figure 5.21: DSC thermograms displaying the three heat cycles for a particle blend of
PLLA 100 and 50 wt% PNO2BnMA ... 169
Figure 5.22: SEM characterisation of a 50 wt% particle blend using a preheated and
cooled blend of PNO2BnMA and PLLA 100 ... 170
Figure 5.23: a) SEM characterisation and b) fluorescence microscopy of 50 wt%
particle blend of PNO2BnMA and PLLA 100 with encapsulated ABM (0.1 wt%) 171
Figure 5.24: SEM characterisation of 50 wt% PNO2BnMA/ PLLA particle blend after
exposure to UV light for a) 0 min, b) 10 min, c) 20 min, d) 40 min, e) 50 min and f)
60 min ... 172
Figure 5.25: a) RI and b) UV (λ = 265 nm) SEC chromatograms displaying the
degradation of a 50 wt% PNO2BnMA/ PLLA particle blend during degradation under
UV light (265 nm) (CHCl3, PS standards). ... 173
Figure 5.26: a) Release of ABM into water and ethanol and b) Change in E during UV
XIX *=Water residue (CDCl3, 300 MHz) ... 187
Figure 6.2: SEC chromatogram of PVAc synthesised via free radical polymerisation
(CHCl3, PS standards). ... 187
Figure 6.3: Characterisation of PVAc particle suspension via light scattering and
optical microscopy ... 188
Figure 6.4: SEM characterisation of PVAc microparticles synthesised via single
oil-in-water solvent evaporation technique. ... 189
Figure 6.5: Optical microscopy analysis of PVAc particles after washing three times
in deionised water ... 190
Figure 6.6: SEM analysis of PVAc microparticles with encapsulated ABM (0.1 wt%)
prepared via a single oil-in-water solvent evaporation technique ... 191
Figure 6.7: Characterisation of the full release of ABM from PVAc particles contained
within an ethanolic release medium by monitoring the change in fluorescence intensity
on a plate reader ... 192
Figure 6.8: 1H NMR spectrum of P(MDO-co-VAc) (41:59) synthesised via free radical
polymerisation, (# signals of the side reactions of 1,4- and 1,7- hydrogen transfer
(CDCl3, 300 MHz) ... 194
Figure 6.9: SEC chromatogram of P(MDO-co-VAc) (41:59) synthesised via free
radical polymerisation (CHCl3, PS standards) ... 195
Figure 6.10: Characterisation of P(MDO-co-VAc) (41:59) particle suspension via a)
light scattering and b) optical microscopy ... 196
Figure 6.11: Optical microscopy of P(MDO-co-VAc) (41:59) particles after three
XX without dye and b) with dye ... 199
Figure 6.13: Optical microscopy analysis of P(MDO-co-VAc) (41:59) particles a)
before drying b) after air-drying for 1 h ... 201
Figure 6.14: Optical microscopy analysis of P(MDO-co-VAc) (41:59) particles during
drying ... 201
Figure 6.15: Characterisation of the change in fluorescence intensity observed with
P(MDO-co-VAc) (50:50) particles in a 50:50 water: ethanol solution over five hours
using a plate reader... 202
Figure 7.1: Chemical structure of a) PDL, b) PPDL and c) LDPE ... 209
Figure 7.2: 1H NMR spectrum of PPDL 100 (CDCl3, 300 MHz, 298 K) ... 212
Figure 7.3: SEC characterisation of PPDL 100 (CHCl3, PS standards)... 213
Figure 7.4: Light scattering characterisation of PPDL microparticles prepared via
single oil-in-water solvent evaporation ... 213
Figure 7.5: SEM characterisation of PPDL microparticles using CH2Cl2 as organic
phase ... 214
Figure 7.6: SEM characterisation of a) PPDL microparticle suspension and b)
sediment arising with CHCl3 as organic solvent ... 215
Figure 7.7: Quantitative 13C NMR spectroscopic analysis of P(PDL-co-ɛCL)
copolymers with (PDL: ɛCL) monomer composition a) 75:25 b) 25:75 and c) 50:50
(700 MHz, CDCl3, 298 K) ... 218
Figure 7.8: Solvent casting of PPDL 100 (10 wt%) films onto a) a glass slide on the
bench b) interferometry characterisation of solvent casting onto a glass slide in a PTFE
XXI 2000 rpm with an initial [PPDL] in chloroform of a) 2 wt%, b) 5 wt% and c) 10 wt%
d) resultant mass and film height at the three concentrations ... 221
Figure 7.10: Visual observation of detached films after one week in a) aqueous and b)
basic (pH(10)) degradation media *Imagery of detached films in enzymatic medium
was unattainable as a consequence of the milky white colouration of cleanzyme. The
films were observable floating on the top of the solution, however, the thin films split
and fell apart when removed from the jar. ... 223
Figure 7.11: Schematic representation of the self-assembled morphologies available
in a block-selective solvent where p = dimensionless packing parameter, v = volume
of the hydrophilic chains, a0 = contact area of the hydrophobic head group and lc =
length of the hydrophobic tail36 ... 224
Figure 7.12: 1H NMR spectrum of P(PDL-co-PDL) (CDCl3, 300 MHz, 298 K) .... 227
Figure 7.13: SEC chromatogram of P(PDL-co-DL) (CHCl3, PS standards) ... 228
Figure 7.14: Quantitative 13C NMR spectrum of P(PDL-co-DL), (125 MHz, CDCl3,
298 K) ... 229
Figure 7.15: 1H NMR spectrum of PDL DP 160 (CDCl3, 30 MHz, 298 K) ... 230
Figure 7.16: SEC chromatogram of PDL DP 160 (CHCl3, PS standards) ... 231
Figure 7.17: DLS characterisation of P(PDL-co-DL) self-assembly in ethylbenzene a)
50 mg/mL and b) 1 mg/mL ... 234
Figure 7.18: TEM characterisation of self-assembled structures of PPDL-co-PeDL
self-assembly in ethylbenzene at a) 50 mg/mL and b) 10 mg/mL ... 235
Figure 10.1: SEM characterisation of PLLA 100 particles after degradation in PBS for
XXII 12 months ... 263
Figure 10.3: Observed [ABM] released from PLLA 100 particles after degradation in
PBS for 12 months ... 264
Figure 10.4: SEM characterisation of PLLA 100 particles without dye after
degradation in water for a) 0 months, b) 3 months, c) 6 months and d) 8 months .. 264
Figure 10.5: SEM characterisation of PLLA 100 particles without dye after
degradation in Cleanzyme for a) 0 months, b) 3 months, c) 6 months and d) 8 months
... 265
Figure 10.6: SEC characterisation of PLLA 100 particles without dye after degradation
in water for 12 months ... 265
Figure 10.7: SEC characterisation of PLLA 100 particles without dye after degradation
in Cleanzyme for 12 months ... 266
Figure 10.8: SEM characterisation of PLLA 25 particles after degradation in water for
a) 0 months, b) 2 months, c) 4 months and d) 6 months ... 266
Figure 10.9: SEC characterisation of PLLA 25 particles after degradation in water for
6 months ... 267
Figure 10.10: Characterisation of the change in [ABM] released into water/ethanol
from PLLA 25 particles after degradation in water for 6 months ... 267
Figure 10.11: SEM characterisation of PLLA 250 particles after degradation in water
for a) 0 months, b) 3 months, c) 6 months and d) 8 months ... 268
Figure 10.12: SEC characterisation of PLLA 250 particles after degradation in water
for 8 months ... 268
Figure 10.13: Characterisation of the change in [ABM] released into water/ethanol
XXIII for a) 0 months, b) 3 months, c) 6 months and d) 8 months ... 269
Figure 10.15: SEC characterisation of PDLLA 100 particles after degradation in water
for 8 months ... 270
Figure 10.16: Characterisation of the change in [ABM] released into water/ethanol
from PDLLA 100 particles after degradation in water for 8 months ... 270
Figure 10.17: SEM characterisation of the change in particle morphology observed
with PCL 100 after a) 0 months, b) 3 months, c) 6 months and d) 9 months in water
... 271
Figure 10.18: SEC characterisation of PCL 100 particles after degradation in water for
9 months ... 271
Figure 10.19: Characterisation of the change in [ABM] released into water/ethanol
XXIV Scheme 1.1: Schematic representation of ROP of a cyclic lactone ... 8
Scheme 1.2: Schematic illustration of the hydrolysis of a) carbonate, b) ester and c)
disulfide bonds ... 24
Scheme 2.1: Schematic representation of ring-opening polymerisation of a polyester.20
... 52
Scheme 2.2: Schematic representation of ROP of L-LA at RT with DBU as a catalyst
... 54
Scheme 2.3: Schematic representation of of ROP of D, L-LA at RT with DBU as a
catalyst... 56
Scheme 2.4: Schematic representation of ROP of ε-CL with a BA initiator and DPP
catalyst in 1 M toluene at RT ... 58
Scheme 2.5: Schematic representation of ROP of β-BL with Mg(BHT)2(THF)2 as a
catalyst... 60
Scheme 2.6: Schematic representation of the two possible pathways for ring opening
of β-BL ... 66
Scheme 3.1: Schematic representation of the hydrolysis of an ester bond.6 ... 87
Scheme 5.1: Schematic representation of condensation of PMA via α-type and β-type
repeat unit13 ... 146
Scheme 5.2: Schematic representation of the synthesis of methyl malic acid ... 148
Scheme 5.3: Schematic representation of the synthesis of PMeMA ... 149
Scheme 5.4: Schematic representation of the synthesis of ethyl malic acid ... 151
Scheme 5.5: Schematic representation of step-growth polymerisation of ethyl malic
XXV an equivalent aliphatic polyester ... 182
Scheme 6.2: Schematic representation of the mechanism for the rROP of MDO ... 184
Scheme 6.3: Schematic representation of free radical polymerisation of PVAc using
AIBN as initiator ... 186
Scheme 6.4: Schematic representation of free radical copolymerisation of MDO and
VAc using AIBN as initiator. ... 193
Scheme 6.5: Schematic illustration detailing the possible side reactions occurring
during rROP with MDO via 1,4- and 1,7-hydrogen transfer ... 195
Scheme 7.1: Schematic representation of ROP PDL using Mg(BHT)2(THF)2 as a
catalyst at 1 M PDL in toluene ... 211
Scheme 7.2: Schematic representation of copolymerisation of PDL and ɛCL ... 217
Scheme 7.3: Schematic representation of ROP of ɛDL and PDL ... 226
Scheme 7.4: Schematic representation of ROP of ɛDL using Mg(BHT)2(THF)2 as
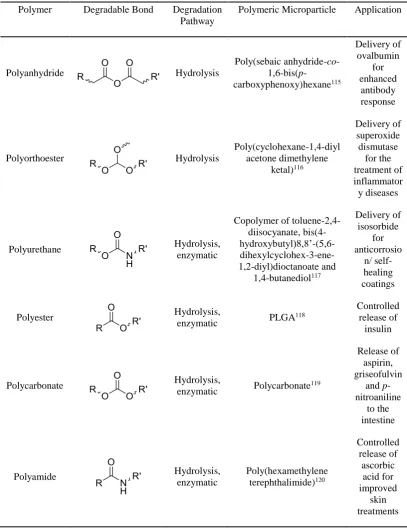
XXVI Table 1.1: Table summarising the different types of polyesters, their preferred
degradation route and their use when applied as a microparticle ... 25
Table 2.1: ROP of 0.7 M L-Lactide in CH2Cl2 with varying [L-LA]: [BA] using DBU
at RT ... 54
Table 2.2: Characterisation data for polymerisation of PDLLA with varying [PDLLA]:
[BA] ratio ... 56
Table 2.3: Characterisation data for the polymerisation of ɛ-CL with a varying
Monomer: BA initiator ratio in 1 M toluene at RT ... 58
Table 2.4: Kinetic analysis of polymerisation of PHB 100 with Mg(BHT)2(THF)2 with
a 1:1 monomer:initiator ratio, at 1M in toluene over 30 min ... 63
Table 2.5: Characterisation data of PHB 100 after 30 min with varied polymerisation
conditions ... 64
Table 2.6: Particle size of different polymeric emulsions determined by the volume
weighted mean recorded via light scattering on the Mastersizer ... 79
Table 4.1: Table showing decrease in dye loading into PCL particles and the resultant
dye content within the particles... 127
Table 4.2: Encapsulation of dye loading of 0.1 wt% ABM into varying polymeric
particles ... 130
Table 7.1: Copolymerisation of PDL and ɛCL targeting DP 100 with varying monomer
ratio’s... 219
Table 7.2: Film thickness and mass of films synthesised by spin coating from PPDL,
XXVII copolymerisation of P(PDL-co-DL) DP 200 (ratio 1:4 respectively) using
Mg(BHT)2(THF)2 as catalyst and benzyl alcohol (BA) initiator ... 231
Table 7.4: Solubility of PPDL, PDL and P(PDL-co-DL) ratio of 1:4 at 50 mg/mL in a
variety of solvents ... 233
Table 9.1: Particle size of different polymeric emulsions determined by the volume
XXVIII
Acknowledgements
Firstly, I would like to thank my supervisor, Professor Andrew Dove, for all his help and
guidance throughout my PhD. I am especially grateful and will forever remember your
continued support and knowledgeable advice on science, careers and general life. I would also
like to express my gratitude to Syngenta for funding my PhD, in particular, James Burns,
Martine DeHeer, Rosa Dominguez Espinosa and Chris Lindsay for all of your direction and
advice throughout.
Secondly, I would like to thank all the Dove and O’Reilly group members past and present for
their continuous help, proof-reading and for making the lab a fun place to work, especially
Vinh, Bo, Anaïs, Anne, Marianne, James, Ruairí, Josh and spicy Wei. Thanks are also due to
the coffee club: Zoe, Anthony, Laura, Chiara and my ‘lab twin’ Ed, I will definitely miss all
of the daily entertaining chats over coffee (or prosecco…). Special thanks go to my fellow
Fakashian members; my lab ‘husband’ and chief proof-reader Guillaume and my Uni Wife
Alice, for always providing unconditional support and encouragement!
A massive thank you to my housemate Karen, 99 Hallgarth and the Durham dream girls, Meg,
Ange and Kat for helping me dance away any problem. Thanks to Jonny, Rory, Helen and my
original lab partner Charlotte for their unconditional long-term support. Special thanks to
Sarah for her constant positivity, I am looking forward to hearing about your future adventures
and life-saving abilities!
My biggest thanks goes to all my family members. In particular I would like to thank my
Aunty Fiona for helping me move the whole Trafford Centre from one flat to another. To my
sister Helen, for showing me that the Christie girls can do anything. Finally, an enormous
thanks to my mum and dad for persevering through reading my entire Thesis and for being my
inspirations in life and in work, without you I would not have been able to complete this
XXIX
Declaration of Authorship
This thesis is submitted to the University of Warwick in support for the degree of Doctor of
Philosophy. It has been composed by myself and has not been submitted in any previous
applications for any degree. The work presented (including data generated and data analysis)
was carried out by the author except in the cases outlined below:
• The confocal microscopy images in Chapter 2 were obtained by Dr James Burns and
Mr Tim Powell (Syngenta, Jealott’s Hill).
• TEM images were obtained in Chapter 3 by Dr Graeme Cambridge and in Chapter 7
by Dr Maria Chiara Arno (University of Warwick).
• EtMA, and NO2BnMA in Chapter 5 were synthesised and polymerised by Mr Edward
Cant (University of Warwick).
• DSC characterisation in Chapter 5 was performed by Mr Panagiotis Bexis, Miss Zoe
Roberts and Dr Anaïs Pitto-Barry (University of Warwick).
• Fluorescence optical microscopy images in Chapter 5 were obtained by Dr Maria
Chiara Arno (University of Warwick).
• MDO monomer in Chapter 6 was synthesised by Dr Guillaume Hedir (University of
Warwick).
XXX
Abstract
This thesis investigates the degradation and release of a fluorescent dye from biodegradable
microparticles. Particular attention is given to determining the effect of polymeric properties
on the subsequent microparticle degradation and release rate. Chapter 1 reviews the current
polymerisation techniques for the synthesis of polyesters and introduces the synthetic
procedures and degradability currently attainable for biodegradable microparticles. The
concept of ‘smart’ release technology is introduced and the potential for using biodegradable
‘smart’ particles for enhanced agricultural formulations is explored.
In Chapter 2, the ring-opening polymerisation (ROP) of a variety of polyesters is
demonstrated, including an investigative study on the ROP of poly(3-hydroxybutyrate) (PHB)
using magnesium 2,6-di-tert-butyl-4-methylphenoxide (Mg(BHT)2(THF)2). The polyesters
are used to prepare microparticles via a single oil-in-water solvent evaporation technique, a
range of formulation parameters are studied to enable optimisation of the subsequent particle
size and stability.
Chapter 3 investigates the encapsulation of a model fluorescent dye into poly(L-lactide)
(PLLA) microparticles and the subsequent PLLA particle degradation and dye release under
simulated environmental conditions is reported.
Chapter 4 describes the degradation and release of
3-bromo-4-(butylamino)-2,5-dihydro-1H-pyrrole-2,5-dione (ABM) from a range of polyester microparticles, investigating the effect of
polymer properties (e.g., molecular weight, crystallinity, etc.) on the particle degradation and
release rate.
In Chapter 5, the incorporation of a stimulus responsive polymer using optimised particle
synthesis and degradation conditions (detailed in Chapter 2 and 3) is investigated. The
successful tuneable microparticle degradation and release is described by incorporation of a
light-responsive poly(nitrobenzyl malic acid) (PNO2BnMA) into homopolymer blends of
XXXI Chapter 6 explores the synthesis of degradable poly(vinyl acetate) (PVAc) microparticles by
the incorporation of 2-methylene-1,3-dioxepane (MDO) degradable ester linkages into the
polymer backbone via free radical ring-opening polymerisation (rROP) and
post-polymerisation microparticle synthesis (using the optimised solvent evaporation technique
detailed in Chapter 2). The successful encapsulation of ABM into P(MDO-co-VAc)
microparticles is reported and compared to encapsulation into PVAc microparticles.
In Chapter 7, the synthesis of poly(ω-pentadecalactone) (PPDL) microparticles using the
optimised single oil-in-water emulsion technique (Chapter 2) is reported. Investigation into
the synthesis and degradation of films prepared from random copolymers of PPDL and
poly(ɛ-caprolactone) (PCL) is described. An attempt at polymerisation-induced self-assembly (PISA)
using block copolymers of PPDL and poly(ɛ-decalactone) (PeDL) is demonstrated.
In chapter 8, a general summary of Chapters 2-7 is presented and key findings and conclusions
highlighted. Chapter 9 provides the experimental methods used throughout this thesis and
XXXII
Abbreviations
ABM 3-Bromo-4-(butylamino)-2,5-dihydro-1H-pyrrole-2,5-dione
AI Active ingredient
AIBN 2,2’-Azobis(isobutyronitrile)
ATRP Atom transfer radical polymerisation
BA Benzyl alcohol
CDSA Crystallisation-driven self-assembly
CKA Cyclic ketene acetal
CRP Controlled radical polymerisation
d Doublet
D,LLA D,L-Lactide
DBU 1,8-Diazabicyclo[5.4.0]undec-7-ene
DI Water Deionised water
DIC N,N’-diisopropylcarbodiimide
DLS Dynamic light scattering
ÐM Dispersity
DP Degree of polymerisation
DPP Diphenylphosphate
DPTS 4-(Dimethylamino) pyridinium 4-toluenesulfonate
DSC Differential scanning calorimetry
E Encapsulation efficiency
EtMA Ethyl malic acid
ɛ-CL ɛ-Caprolactone
FRP Free radical polymerisation
XXXIII
I Initiator
J Coupling constant
kd Rate of depolymerisation
kp Rate of polymerisation
LA Lactide
LDPE Low-density polyethylene
LLA L-Lactide
Ln Ligand
m Multiplet
M Monomer
MA Malic acid
MDO Poly(2-methylene-1,3-dioxepane)
MeMA Methyl malic acid
Mn Number average molecular weight
Mw Weight average molecular weight
NMP Nitroxide-mediated polymerisation
NMR Nuclear magnetic resonance
NO2BnMA Nitrobenzyl malic acid
P(MDO-co-VAc) Poly(2-methylene-1,3-dioxepane-co-vinyl acetate)
P(PDL-co-CL) Poly(ω-pentadecalactone-co-ɛ-caprolactone)
P(PDL-co-DL) Poly(ω-pentadecalactone-co-ɛ-decalactone)
PBS Phosphate buffered saline solution
PCL Poly(ɛ-caprolactone)
PDL Poly(ɛ-decalactone)
XXXIV
PDMS Poly(dimethylsiloxane)
PeDL Poly(ɛ-Decalactone)
PEtMA Poly(ethyl malic acid)
PHB Poly(3-hydroxybutyrate)
PICDSA Polymerisation-induced crystallization-driven self-assembly
PISA Polymerisation-induced self-assembly
PLGA Poly(lactic-co-glycolic acid)
PLLA Poly(L-lactide)
PMA Poly(malic acid)
PMDO Poly(2-methylene-1,3-dioxepane)
PMeMA Poly(methyl malic acid)
PNO2BnMA Poly(nitrobenzyl malic acid)
PPDL Poly(ω-pentadecalactone)
PVA Poly(vinyl alcohol)
PVAc Poly(vinyl acetate)
R.T. Room temperature
RAFT Reversible addition-fragmentation chain-transfer
RI Refractive index
ROP Ring-opening polymerisation
rROP Radical ring-opening polymerisation
s Singlet
SEC Size exclusion chromatography
SEM Scanning electron microscopy
t Triplet
XXXV
TEM Transmission electron microscopy
TFAA Trifluoroacetic anhydride
Tg Glass transition temperature
THF Tetrahydrofuran
TM Melting temperature
UV Ultraviolet
UV-vis Ultraviolet/visible
VAc Vinyl acetate
β-BL β-Butyrolactone
δ Chemical shift
δ-VL δ-Valerolactone
λ Wavelength
1
2
1.1
Polymers in Agriculture
Current Challenges Facing Agriculture
Agriculture provides the backbone to successful international health and economic
development. The term agrochemical applies to a chemical that aims to protect,
manage or enhance an agricultural environment and thus encompasses a wide range
of materials (such as pesticides, fungicides, herbicides, etc.). Since the first reported
use of an insecticide over 4,500 years ago, the application of agrochemicals has
become essential to the provision of efficient crop production observed today.1
Consequently, there is currently a broad array of available agrochemicals, each with
distinct desired abilities, such as, fertiliser, pest management and disease prevention
and control.2 In particular, the 1940’s-1960’s were termed the ‘Green Revolution’,
resulting from extensive research and development which has led to major advances
in the fields of fertilisers, water quality, pesticides, new crop strains and other
technologies (Figure 1.1).3 The human population is expected to grow by 80 million
people per annum, with a projected total reaching 9.2 billion by 2050.4 Therefore,
there is a rapidly growing demand for increased plant and crop production.
Figure 1.1: Graphical representation of the world population’s growth from 10,000 BC to the predicted population in 2150 by Popp et al.4
Year
P
opu
la
ti
on
N
u
m
be
r
(B
il
li
on
3 Agrochemicals are generally applied through spraying, broad casting and other
techniques.4,5 However, depending on the distribution method and climatic conditions,
the agrochemicals can easily be lost as a consequence of leaching, volatilization and
degradation. In the worst case, up to 90% of the applied agrochemicals never reach
their intended target (Figure 1.2).5 Consequently, to achieve the desired agrochemical
concentration for optimum plant protection, an excess of agrochemical is required to
be applied at regular intervals. A large proportion of agrochemicals are known to be
toxic, therefore, a high concentration of loss can lead to detrimental ecological side
effects on plant life, animals, public health and the surrounding environment.6
Undoubtedly, the beneficial outcomes observed through the application of
agrochemicals will continue to be a pivotal tool in the ever-advancing diverse
agricultural technologies that help to maintain and improve living standards
worldwide. Nevertheless, with the increasing population, there is a continued need to
reduce the amount of agrochemical required to achieve safe and efficient crop growth.6
Controlled release technology using polymeric materials has emerged as a promising
pathway to successfully reduce the predicted strain on the agricultural industry.7 This
Chapter highlights the advancements observed within conventional polymerisation
techniques. The concept of controlled release using biodegradable microparticles is
introduced, with specific focus on the current and future progress for microparticle
synthesis via a solvent-evaporation technique and the subsequent microparticle
degradation and controlled release. The innovative advancements observed using
stimuli-responsive drug delivery vehicles are discussed and the potential benefits
4
Figure 1.2: Graphical representation of desired pesticide concentration vs. actual pesticide concentration as a function of time from conventional and controlled release systems by Roy et al.5
Polymer Synthesis
To date, a vast library of synthetic polymers are available. Currently, polymers have
found use and are indispensable within almost all aspects of modern day life, (e.g.,
packaging, drug delivery, paint, protective coatings etc.). In general, polymer
synthesis can be grouped into two classifications; chain-growth and step-growth
polymerisation. The type of reaction can be determined according to the dependence
on the degree of polymerisation (DP) or molecular weight on the monomer conversion
(Figure 1.3).8 Chain growth polymerisation usually requires an initial reaction between
the monomer and an initiator to start the growth of the chain. The polymerisation can
then proceed through direct reaction of the monomer with the reactive end-group of
the growing polymer chain. Consequently, for a chain-growth polymerisation, it is
characteristic to observe an initial rapid consumption of monomer followed by slower
growth of all the initiated chains. On the other hand, step-growth polymerisation
proceeds via only one process, the reaction between two reactive functionalities (a
dicarboxylic acid and a diol, a dicarboxylic acid and a diamine, etc.). The reaction has Time
P
es
ti
ci
de
C
on
ce
n
tr
at
ion Conventional ReleaseMinimum Effective Level
5 been shown to occur via the reaction of two functionalities within one monomer, (e.g.,
amino acids), or between two separate molecules (e.g., diisocyanates and diols to form
polyurethanes). As a consequence of the single step-reaction mechanism, the resultant
polymer chain builds up slowly e.g., reaction of two functionalities to create a dimer,
dimer reacts with dimer to form a tetramer etc. However, typically, the polymerisation
pathway is less defined e.g., a tetramer can react with a dimer or trimer, etc., hence,
the polymerisation is uncontrolled and as such, the technique is limited to the
formation of simple architectures.
Figure 1.3: Graphical representation of the difference in molecular weight evolution against conversion for chain-growth, step-growth and living polymerisation procedures by Darling et al.8
Living polymerisation is a modified form of chain-growth, where again rapid initiation
is proceeded by chain propagation. In an ideal living polymerisation, termination
reactions are supressed.9 Therefore, all of the polymer chains grow linearly and can
retain their end group functionality, thus enabling the production of higher ordered
[image:42.595.220.417.305.511.2]6 1.1.2.1 Free Radical Polymerisation
Free radical polymerisation (FRP) contributes an integral role in commercial
polymerisation processes.11 Since the first report of radical polymerisation by Simon
et al. in 1839, who observed light-induced polymerisation of styrene, interest in radical
polymerisation has escalated rapidly.12 In fact, approximately 50% of all commercially
available synthetic polymers are prepared by this fundamental synthetic technique.13
Furthermore, the mild reaction conditions have enabled a pivotal pathway to the
successful polymerisation of an extensive range of monomers, including acrylates,
methacrylates, styreneic monomers and vinyl acetates. FRP has been shown to be
tolerant to a wide range of functional groups (for example, OH, COOH, NR2, CONR2
etc.), as well as being compatible with protic solvents, such as water.
FRP proceeds via a chain-growth polymerisation procedure and can generally be
divided into three sections; initiation, propagation and termination.14 The technique
has been shown to be successfully applied to a range of reaction conditions (e.g., bulk,
suspension, emulsion, etc.). These attractive properties make FRP simple to
implement and inexpensive in relation to competitive technologies, thus enabling its
successful incorporation into industrial procedures. Nevertheless, the high reactivity
of the radicals present during polymerisation often results in a high proportion of chain
termination and side reactions. Hence, polymers prepared via conventional FRP
characteristically have broad dispersities and uncontrolled molecular weights.
1.1.2.2 Controlled Polymerisation
The discovery of controlled polymerisation techniques (such as reversible
addition-fragmentation chain-transfer (RAFT), ring-opening polymerisation (ROP),
nitroxide-mediated polymerisation (NMP) and atom-transfer radical-polymerisation (ATRP))
7 to achieve quantitative initiation and supress termination reactions occurring during
polymerisation, thus yielding well-defined polymers with narrow molecular weight
distributions (ÐM). Indeed, controlled polymerisation techniques enable good control
over the chain-end fidelity, thus enabling the synthesis of complex architectures, such
as multiblock copolymers and hyperbranched materials, which have found use in a
broad array of applications, (including pharmaceutical, agrochemical, packaging
etc.).15, 16
Ring-Opening Polymerisation of Polyesters
Since the pioneering discovery of the first synthetic polyester in 1930 by Carothers et
al., a diverse range of polyesters have been synthesised and applied for a broad array
of applications.15 As a consequence of the ever-growing demand for sustainable
resources, biodegradable polyesters such as poly(lactic acid) (PLA),
poly(δ-valerolactone) (PVL) and poly(ɛ-caprolactone) (PCL) have received particular
attention.17-19 Polyesters have been synthesised by several methods, including; step
growth polymerisation, ring-opening polymerisation (ROP) and free radical
polymerisation.20-22 ROP has received specific interest as a consequence of the high
control afforded throughout polymerisation. Therefore, this allows the accurate
targeting and tuneable control over the molecular weight, thus enabling the production
of more refined macromolecular architectures (e.g., block copolymers, star-shaped
polymers, hyperbranched materials etc.).23-25 In general, polymerisation of a cyclic
monomer proceeds via a chain-growth mechanism and as such, ROP can allow the
8
Scheme 1.1: Schematic representation of ROP of a cyclic lactone
For small ring lactones (4-, 6- and 7- membered rings), the relief of bond-angle strain
and steric repulsions between atoms of the ring acts as the driving force for ROP.26
However, the structure of the monomer has a large impact on the polymerisation
behaviour, in fact not all rings are susceptible to being ring-opened.27 The availability
for a cyclic monomer to be ring-opened and the optimum polymerisation conditions
can be determined using the change in Gibbs free energy upon transformation
(Equation 1), e.g., if ΔG < 0, the reaction is favoured, whereas if ΔG > 0, the reaction
will not proceed. For instance, the 5-membered γ-butyrolactone experiences very little
ring-strain and as such displays a positive enthalpy and Gibbs free energy, hence
polymerisation is not favoured.27 On the other hand, for the majority of lactones the
relief of ring strain results in an exothermic release that subsequently generates a
highly negative enthalpy, thus permitting polymerisation to occur.26
∆𝐺
0= ∆𝐻
0− 𝑇∆𝑆
0 Equation 1: Gibbs free energy equationIn general, for 6- and 7-membered rings, ring strain is less prominent than for smaller
rings, hence, if reliant on ring strain alone the polymerisation would proceed at a
relatively slow rate. The polymerisation rate would be dependent upon factors
including the monomer type, monomer concentration and reaction temperature.
Therefore, to enhance the polymerisation rate, a catalyst is usually applied to the
9 (Figure 1.4).28-32 Typically, the type of catalyst can be broadly categorised into
organic, inorganic or enzymatic catalysts.33 Most inorganic catalysts consist of a metal
centre with surrounding ligands, thus enabling tuneable catalytic properties depending
on the metal and ligands used. However, removal of the inorganic catalyst after
polymerisation is expensive and often leads to toxic catalytic residues within the final
polymer. Conversely, organocatalysts are usually either acidic or basic, so can easily
be removed through simple washing.34 Moreover, organocatalysts can display good
stability during storage and polymerisation, which has been observed to be
[image:46.595.132.514.356.577.2]problematic when using an enzymatic catalyst.35, 36
Figure 1.4: Selection of representative catalysts applied for the ROP of cyclic lactones, M = metal centre, Ln = Ligand34, 37-41
Inorganic:
Organic:
NHC’s: Acidic: Basic:
10 Macrolactones (14-, 15- and 16-membered lactones) are a particularly interesting class
of monomers as a consequence of their potential to provide an efficient synthetic
pathway to the production of high molecular weight polymers.42-44 Unlike
conventional lactone rings, the large structure observed with macrolactones increases
the flexibility within the monomer and consequently decreases the observed ring
strain.45 Nevertheless, even with the decreased ring strain, ROP can be achieved
through the introduction of an entropic gain. This is usually achieved via the use of
more strenuous reaction conditions (e.g. high temperature) and as such macrolactones
11
1.2
Controlled Release Using Polymeric Materials
The inspirational work accomplished in materials science encouraged the innovative
production and development of controlled release technology. Indeed, since the first
reports of controlled release from silicone rubber and polyethylene in the 1960’s,
substantial research has been focussed on designing novel drug delivery vehicles,
methodologies and equipment.46-48 To this date, a multitude of delivery devices have
successfully achieved controlled release, such as thin films, hydrogels, self-assembled
structures, nano- and micro-particles.49-52 Furthermore, the extremely adaptable
properties attainable with polymeric devices have enabled their wide spread
application for a multitude of diverse applications, e.g., agricultural, medicinal,
cosmetics, food products, perfume, printing, etc.19, 53, 54
Controlled Release from Microparticles
The term microparticle is typically defined as a spherical particle with the size varying
between 1-1000 μm.55 In the 1960’s, Chang et al. reported the first encapsulation of a
macromolecular therapeutic protein into a polymeric microcapsule.56 The particles
were semi-permeable, thus enabling diffusion of the encapsulated enzyme to the
specific target substrate both in-vivo and in-vitro. The attractive advantages offered by
encapsulation, (such as lower drug doses, protection of the encapsulated substance,
decreased toxicity of the encapsulated material, etc.) sparked a surge in research into
controlled release formulations utilising microparticles.57 Following from the
pioneering work by Chang et al., in 1976 Mason et al. introduced the concept of
degradability by coating a narcotic antagonist, cyclazocine, with degradable poly(D,L
-lactic acid) (PDLLA).58 Since these revolutionary studies, a wide range of materials
12 poly(amino acids), polyorthoesters, ceramics and glass.59-61 In general, the types of
particles synthesised can be split into two categories (Figure 1.5):62
1. Reservoir Microcapsules: The desired encapsulated material is encased within
a typically water-insoluble material. Reservoir particles can either consist of a
main central reservoir containing the encapsulated AI, or the AI can be
dispersed in smaller reservoirs within the polymer membrane.
2. Matrix Microparticles: The chemically active substance is combined within a
desired matrix material.
Figure 1.5: Diagrammatic representation of the two main types of microparticles
The type of particle synthesised is highly dependent on the technique applied for
particle synthesis, the desired encapsulated active ingredient (AI) and the required
release mechanism.63 Since the initial reports of diffusion controlled release, a variety
of release mechanisms have been investigated, which include direct dissolution,
erosion, osmotic pump systems and ion-exchange resins.63-65 Direct dissolution
involves either coating or encapsulating the AI within a particle that is partially soluble
13 coating/particle matrix dissolves. Application of an osmotic pump system involves the
build-up of pressure within the device which acts to push out the AI via an orifice, this
is usually applied to a reservoir microcapsule. Particle systems using an ion-exchange
resin are used commercially, where a drug is bound to the resin and released by
exchanging the appropriately charged ions, in contact with the ion exchange groups.
1.2.1.1 Microparticle Synthesis
There are many techniques known, both physical and chemical, that are capable of
manufacturing microparticles (e.g., phase separation, precipitation, pan-coating,
spray-drying, etc.).59, 66-69 However, the most widely used methods are based on simple
emulsion techniques. Solvent evaporation has received particular interest as a
consequence of its simple methodology and easily tuneable nature. Furthermore,
particle synthesis via solvent evaporation is a post-polymerisation technique,
therefore, it can be easily adapted and applied using a wide range of materials.62
Several procedures exist for solvent evaporation, the methodology chosen depends on
the selected materials and the desired application.
1.2.1.2 Single Oil-in-Water Solvent Evaporation
Preparation of polymeric particles using a single oil-in-water solvent evaporation
technique has been successfully achieved for the encapsulation of an extensive variety
of drugs (e.g., anti-cancer drugs, steroids, narcotic agents, etc.).70-72 The technique can
be split into two stages; the first step is emulsification, this requires the mixing of an
organic phase (usually consisting of the polymer and AI dissolved in a volatile organic
solvent) and an aqueous phase (containing a surfactant).73 The second stage is known
as particle hardening and involves evaporation of the volatile organic solvent (Figure
14 To generate the emulsion, the organic and aqueous phases are mixed before physically
applying a force to make the organic phase disperse as droplets within the aqueous
phase. This is usually achieved through high shear mixing, e.g., using a Silverson
mixer or by sonication. Hence, varying the emulsification length and intensity can be
used to control the particle size and particle size distribution.75 After emulsification,
the solution is slowly stirred enabling the successful removal of the organic solvent.
The high volatility of the solvent enables diffusion of the organic solvent into the
continuous water phase and its evaporation at the water-air interface.73 This in turn
results in polymer precipitation and subsequent particle hardening.
1.2.1.2.1 Factors Affecting Particle Composition
Numerous variables are known to affect the particle formation and AI encapsulation
and release when using a single oil-in-water emulsion technique, both within
emulsification and particle hardening. During emulsification, process parameters,
such as emulsification time and intensity are well known to affect the resultant
microparticle size.75 The type of material used for particle synthesis is a key factor in
predicting the AI release rate. A diverse range of materials have been applied as the
Figure 1.6: Schematic representation of microparticle synthesis via single oil-in-water solvent evaporation
1) Emulsification 2) Particle Hardening
Aqueous Phase
Organic Phase
15 particle matrix. However, as a consequence of the good biocompatibility and
biodegradability observed with biodegradable polymers, polyesters, such as PLA,
PCL and poly(lactic-co-glycolic acid) (PLGA) continue to be the pivotal materials
selected for the design and synthesis of innovative microparticle delivery vehicles.
76-78 Several reports have distinguished a clear influence of the polymer molecular weight
on the AI release rate, for instance, Makino et al., investigated the release of the
steroid, estradiol, from PLGA particles at three different PLGA molecular weights.79
Characterisation of the drug release by fluorescence spectroscopy revealed that as the
molecular weight increased, the release rate decreased as a consequence of the
decreased surface area: volume ratio (Figure 1.7).79 Furthermore, the release of
estradiol was considered to be a consequence of diffusion between the device interior
and the bulk solution, polymer degradation and change in water content within the
particle. Further investigations into emulsification parameters have shown that the
polymer concentration, microparticle size and the encapsulated AI can all have a
significant effect on the particle release rate.80-82 Therefore, overall, it can be surmised
that the rate of AI release from particles synthesised via a single oil-in-water technique
16
Figure 1.7: Graph displaying the difference in release rate obtained from PLGA microparticles with varying PLGA molecular weight79
To achieve the optimum conditions for successful particle hardening, the organic
droplets are required to remain dispersed and stable to coalescence, within the
continuous aqueous phase. Moreover, the particles must remain stable long enough
for evaporation of the organic solvent to occur, thus permitting the formation of stable,
solidified microparticles. Therefore, to prevent droplet coalescence, the aqueous phase
typically contains a surfactant that can stabilise the dispersed phase droplets.75 Indeed,
the surfactant aligns at the droplet surface, thus acting to lower the free energy at the
water-oil droplet interface and subsequently increasing the particle stability.83
Multiple surfactants have been applied, however, as a consequence of its good
biocompatibility, the non-ionic poly(vinyl alcohol) (PVA) has been the most widely
investigated.84, 85 Furthermore, investigations by Sansdrap et al., have reported that an
increase in surfactant concentration can decrease the particle size.86 The decreased