http://wrap.warwick.ac.uk
Original citation:
Wang, Fujun, Li, Junlan, Liu, Shiwei, Zhao, Xingyu, Zhang, Dawei and Tian, Yanling.
(2014) An improved adaptive genetic algorithm for image segmentation and vision
alignment used in microelectronic bonding. IEEE/ASME Transactions on Mechatronics,
19 (3). pp. 916-923.
Permanent WRAP url:
http://wrap.warwick.ac.uk/76444
Copyright and reuse:
The Warwick Research Archive Portal (WRAP) makes this work by researchers of the
University of Warwick available open access under the following conditions. Copyright ©
and all moral rights to the version of the paper presented here belong to the individual
author(s) and/or other copyright owners. To the extent reasonable and practicable the
material made available in WRAP has been checked for eligibility before being made
available.
Copies of full items can be used for personal research or study, educational, or not-for
profit purposes without prior permission or charge. Provided that the authors, title and
full bibliographic details are credited, a hyperlink and/or URL is given for the original
metadata page and the content is not changed in any way.
Publisher’s statement:
“© 2014 IEEE. Personal use of this material is permitted. Permission from IEEE must be
obtained for all other uses, in any current or future media, including reprinting
/republishing this material for advertising or promotional purposes, creating new
collective works, for resale or redistribution to servers or lists, or reuse of any
copyrighted component of this work in other works.”
http://dx.doi.org/10.1109/TMECH.2013.2260555
A note on versions:
The version presented here may differ from the published version or, version of record, if
you wish to cite this item you are advised to consult the publisher’s version. Please see
the ‘permanent WRAP url’ above for details on accessing the published version and note
that access may require a subscription.
Abstract—In order to improve the precision and efficiency of
microelectronic bonding, this paper presents an improved adaptive genetic algorithm (IAGA) for the image segmentation and vision alignment of the solder joints in the microelectronic chips. The maximum between-cluster variance (OTSU) threshold segmentation method was adopted for the image segmentation of micro chips, and the IAGA was introduced to the threshold segmentation considering the features of the images. The performance of the image segmentation was investigated by computational and experimental tests. The results show that the IAGA has faster convergence and better global optimality compared with standard genetic algorithm (SGA), and the quality of the segmented images becomes better by using the OTSU threshold segmentation method based on IAGA. On the basis of moment invariant approach, the micro vision alignment was realized. Experiments were carried out to implement the micro vision alignment of the solder joints in the microelectronic chips, and the results indicate that there are no alignment failures using OTSU threshold segmentation method based on IAGA, which is superior to the OTSU method based on SGA in improving the precision and speed of the vision alignments.
Index Terms—Improved adaptive genetic algorithm, image
segmentation, vision alignment, microelectronic bonding
I. INTRODUCTION
ECENTLY the rapid development of microelectronic industries requires devices with high performance, high integration and miniaturized scale, which puts forward stringent requirements for the quality and efficiency of micro device packaging [1]-[4]. As an important technology for micro device packaging, thermosonic bonding constructs electrical interconnections using fine gold wire or other kinds of metal [5]. The precision positioning system is one of the key
Manuscript received Jun 21, 2012. This work was supported in part by the National Natural Science Foundation of China under Grant 51205279, 51175372 and 51275737, in part by the Science & Technology Commission of Tianjin Municipality under Grant 13JCQNJC04100 and 10ZCKFGX03200, and in part by the Tianjin University for Peiyang Elite Scholar and the open fund of Tianjin Key Laboratory of Equipment Design and Manufacturing Technology.
F. J. Wang, S. W. Liu, X. Y. Zhao, D. W. Zhang and Y. L. Tian are with Tianjin Key Laboratory of Equipment Design and Manufacturing Technology, School of Mechanical Engineering, Tianjin University, Tianjin 300072, China (email: [email protected], [email protected], [email protected], [email protected], [email protected])
components of thermosonic bonding equipments, and thus it determines the characteristics of such packaging machines [6]. As a result, it is very essential to study on the precision positioning systems.
Several studies have been reported on the mechanisms and controller design of precision positioning systems [7]-[14]. However, it is very difficult to eliminate the random errors during bonding process [15]. The real-time detection of these errors can be realized through vision system, and the errors can be compensated by combining of motion control system and vision system, so recently the vision systems for precision positioning have received considerable attentions from both researchers and manufacturers, and it has been concluded that it is an effective way to improve the dynamic quality of positioning systems through developing the vision system and designing an efficient and precision vision alignment algorithm [16]-[25]. The template matching method based on normalized grayscale correlation has the advantages of strong robustness, high positioning accuracy and reliability. However, it can not satisfy the requirements of high speed and high precision packaging due to the inherent contradictions of the algorithm between the speed and accuracy [26]. The feature-based template matching method utilizes certain image features, thus reducing the amount of calculation, so it shows great potential in the applications of microelectronic bonding [27]. However, under extreme working conditions of packaging, an effective image preprocessing method to obtain robustness image features quickly and accurately and the micro vision alignment approach are still not presented systematically, which is the motivation of this study.
Genetic algorithm (GA) is a robust search and optimization technique which is finding application in a number of practical problems [28], [29], and it is one of the effective candidates for the threshold segmentation of micro vision positioning system for microelectronics bonding. However, when it is used to solve complex problems, premature convergence can be generated, and the convergence rate will become slow [30]. Srinivas and Patnik [31] proposed an adaptive genetic algorithm (AGA) to reduce the premature convergence by using adaptive probabilities of crossover and mutation. However, the probabilities of crossover and mutation would be equal to zero, which increased the possibility of falling into local optimum. To solve this problem, some improved adaptive
An Improved Adaptive Genetic Algorithm for
Image Segmentation and Vision Alignment Used
in Microelectronic Bonding
Fujun Wang, Shiwei Liu, Xingyu Zhao, Dawei Zhang, and Yanling Tian
in certain applications [32]-[35]. However, their applications are restricted in the threshold segmentation of micro vision positioning system for microelectronics bonding due to the slow convergence rate.
To avoid falling into local optimum and improve the speed of image segmentation, this paper presents an IAGA considering the features of the microelectronic chip images, and it is used for the threshold segmentation of chip images. The micro vision alignment is realized based on moment invariant approach. The performances of the image segmentation and vision alignment are investigated by computational and experimental tests.
The rest of the paper is organized as follows. Section II presents the OTSU image segmentation based on IAGA. In Section III, the vision alignment method is given. Then the simulation of image segmentation is presented in Section IV. After that the experiments are presented in Section V to investigate the characteristics of image segmentation and vision alignment. Finally Section VI concludes this paper.
II. OTSU IMAGE SEGMENTATION BASED ON IAGA Assuming an image with the size M×N and gray range L, the number of pixels at gray level i is denoted by ni, thus the probability of gray level i can be gained by
i i
1
i 0
/( ), 0 1
i
L
P =n M N P× ≥ ,
∑
− P= (1)If we divide the pixels of the image into two classes of object C0 and background C1 by the threshold t, the gray level probability distributions for the two classes can be expressed by
0 0 0 ( ) ( ) t r i i
P C P t
=
= =
∑
=ωω (2)
1
1 1
1
( ) L 1 ( )
r i
i t
P C − P t
= +
= =
∑
= −ωω (3)
The gray means of the class C0 and C1 are
0 0 0 / ( ) / ( ) t i i
iP t t
=
=
∑
=μ ω μ ω (4)
1
1 1
1
( ) /
1 ( ) L T i i t t iP t − = + − = = −
∑
μ μμ ω
ω (5)
where
1
0 0 0
( ) ( )
t t L
i i T i
i i i
t P t iP iP
−
= = =
=
∑
=∑
=∑
ω ,μ ,μ
The between-cluster variance of the class C0 and C1 can be given by 0 2 2 1 1 0 2 ( ) ( )
B =ω −μT +ω μ − T
σ μ μ (6)
index for the uniformity of gray distributions. The larger the between-class variance is, the greater the difference between the two classes becomes. The optimal threshold t* can be figured out through maximizing the between-class variance σB.
1
2 * 2
0
( ) { ( )}
L
B B
t
t Max t
−
=
=
∑
σ σ (7)
Because the surface quality of the micro chips is different and the lighting conditions of the vision system will change slightly during microelectronic bonding, the quality of the images taken by the micro vision system may be different. For the images of the micro chips, there will be noise around the edges of the contours of the solder joints due to oxidation, which will cause that the edge contours of the solder joints become very difficult to be distinguished, and even lead to adhesions between the solder joint contours and the noise regions. Thus we firstly employ a median-filter for the image preprocessing to reduce the disturbance from the noise. The noise on the surface of micro chips has no effect on the gray distributions of the solder joint contours, meanwhile the proportion of solder joint contours in the image is small, and the disturbance from the lighting has little influences on the contours of the solder joints. Considering that the solder joints are generally the brightest regions within the whole images, the clear contours of the solder joints can be achieved by re-segmentation. Assuming the image after preprocessing is I1, the gray levels of the object and background are equal to 1 and 0, respectively, we can get the threshold T1 of the image I1 by OTSU method, after that the pixel will be saved in an array R
while the gray level exceeds the threshold T1. Then the threshold T2 of R can be obtained using OTSU again. Finally, the optimal threshold t* can be obtained through exhaustive search, and the image I1 is segmented by the threshold t*. After segmentation, the regions whose area is less than the threshold will be removed to obtain clear solder joint contours.
From the above analysis, it can be known that to get the optimal threshold by OTSU, the between-cluster variance of each gray level has to be calculated and it is very time-consuming. So it is very essential to seek an efficient method for fast solution.
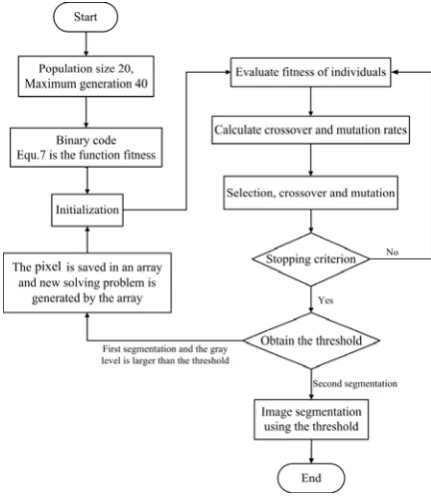
In this paper, an IAGA is presented and introduced to the image segmentation process of micro chips using OTSU method. In the IAGA, the problem is firstly encoded as a population of chromosomes, and the fitness function is defined over the genetic representation and measures the quality of the represented solution. Then the evolution starts from a population of randomly generated individuals and happens in generations. The specific flow chart of OTSU method based on IAGA is shown in Fig.1, and it is summarized as follows:
(1) Encoding: The 256-level grayscale images are expressed by 8-bit binary encoding.
knowledge structures or individuals. A collection of individuals is referred to as a population. In view of the solution space is between 0 and 255, a population size of 20 is used to generate final segmentation boundaries.
(3) Fitness function: Equation (7) is adopted as the fitness function.
(4) Selection: In this stage the expected times of an individual being selected for recombination is proportional to its fitness value relative to the rest of the population. This operation is to achieve a mating pool with the fittest individuals selected according to a probabilistic rule that allows these individuals to be mated into the new population. The selection is carried out using roulette method in this paper. Supposing that the population size is M, the fitness of individual i is fi, and therefore the selection probability Pi of individual i can be calculated as 1 i i M k k f P f = =
∑
(8)(5) Crossover and mutation: To get the reasonable threshold by OTSU, the between-cluster variance of each gray level has to be calculated. Therefore, an efficient method for fast solution is essential. For standard genetic algorithm (SGA), the individual is easy to be changed when it’s not the optimal solution, and it is retained when it is nearby the optimal solution. To reduce the premature convergence and improve the convergence rate of SGA, AGAs were presented with the approach of adaptive probabilities of crossover and mutation [31]. However, they can fall into local optimum in the complex system. To resolve this problem and improve the speed of image segmentation considering the features of the chip image, the probabilities of crossover and mutation are improved in this paper, and they are adopted to find the threshold based on OTSU. Because the contours are the brightest regions during vision alignment for micro chip bonding, and the proportion of contour in the image is small, the reasonable threshold exceeds the average gray level. Then the convergence rate can be faster when the relationship between the average gray levels is taken into consideration. And therefore the improved probabilities of crossover Pc and mutation Pm are given as follows
'
1 2 '
1
max
' 1
( )( )
[ ] 10
c c avg
c avg
avg c
c avg
P P f f
P P f f
f f P
P P f f
⎧ − −
− × × ≥
⎪ −
= ⎨
⎪ × <
⎩ μ μ (9) 1 2 1 max 1 ( )( )
[ ] 10
m m avg
m avg
avg m
m avg
P P f f
P P f f
f f P
P P f f
− −
⎧
− × × ≥
⎪ −
= ⎨
⎪ × <
⎩
μ
μ
(10)
1
1 2 min
1 min ( )( ) a u u m a a P i
P P P i i
P i μ μ μ μ μ μ ≥ ⎧ ⎪
=⎨ + − − <
⎪ −
⎩
(11)
where fmax is the maximum individual fitness, favg is the average individual fitness, f’ is the larger fitness between two individuals for crossover, μa is the average gray, μmin is the minimum gray, which is the threshold obtained from the first segmentation for the second segmentation, i is the gray level of the lager fitness of individuals for crossover, Pc1, Pc2, Pm1, Pm2,
Pμ1 and Pμ2 are constants, 0.5<Pc1<1.0, 0.5<Pc2<1.0, 0.001<Pm1<0.1, and 0.001< Pm2<0.1.
From Eqs.(9)-(11), it is known that the improved Pc and Pm vary not solely with the fitness function by introducing Pμ
which is related to the gray level of the chip image, and the convergence rate is improved. The Pc and Pm increase when the population tends to get stuck at a local optimum and decrease when the population is scattered in the solution space. Meanwhile, the Pc and Pm have lower values for high fitness solutions and higher values for low fitness solutions, and thus the good solutions of the population can be preserved. So it not only improves the convergence rate of the IAGA, but also prevents the IAGA from getting stuck at a local optimum.
(6) Stopping criteria: the IAGA stops when the average fitness ratio of adjacent generation individuals is within the range from1.000 to 1.005.
III. VISION ALIGNMENT
Assuming f(x, y) represents a 2-dimensional density image function, the general expression of rotation moment invariants is defined as
= 0, 1, 2...
( , )
p x y
p q
q p, q
[image:4.595.318.534.371.622.2]m
= ∑∑
x y f x y
(12)geometric center of the image, and it can be expressed by
10
/
00,
01/
00x
=
m m y=
m m (13)To avoid interference with other solder joints and noise, the features of matching solder joint need to be recognized during vision alignment. Moment invariants are used to determine the correspondence between the feature regions. A set of seven moment invariants that possess the properties of rotation, shift and scale invariance are defined as [36]
20 02 2 2 2 20 02 11
2 2
3 30 12 21 03 2 2 4 30 12 21 03
2 2
5 30 12 30 12 30 12 21 03 2 2 21 03 21 03 30 12 21 03
2
6 20 02 30 12 1 0 1
2
( ) 4
( 3 ) (3 )
( ) ( )
( 3 )( )[( ) 3( ) ]
(3 )( )[3( ) ( ) ]
( )[( ) (
= + = − + = − + − = + + +
= − + + − + + − + + − + = − + − +
φ η η
φ η η η
φ η η η η
φ η η η η
φ η η η η η η η η
η η η η η η η η
φ η η η η η η 2
3 11 30 12 21 03
2 2
7 21 03 30 12 30 12 21 03 2 2 12 30 21 03 30 12 21 03
) ] 4 ( )( )
(3 )( )[( ) 3( ) ]
(3 )( )[3( ) ( ) ]
+ + + = − + + − +
+ − + + − +
η η η η η
φ η η η η η η η η
η η η η η η η η
(14)
where ηpqrepresents the normalized central moments.
00
/
pq pqr
=
η μ μ (15)
where r=(p q+ ) / 2 1+
The similarity between the two features can be determined as
7
2
1
( )
ij in jn
n
d
=
=
∑
φ −φ (16)Because the shapes of solder joints are regular rectangles, the interference of noise and the effect of algorithm accuracy can offset each other to some extent as the geometric center is used in the process of vision alignment. The flowchart of vision alignment is shown in Fig.2.
IV. SIMULATION OF IMAGE SEGMENTATION
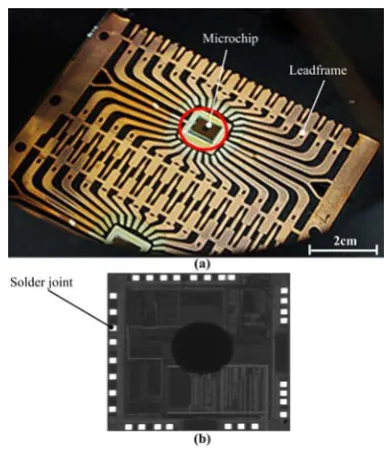
Computational analyses are conducted to investigate the convergence of the proposed image segmentation method. An image of a typical chip taken by CCD is shown in Fig.3. Through calculations of twenty images with the size of 256 pix×256 pix, the convergence of SGA and IAGA is obtained, and it is summarized in Table I. It can be seen that IAGA has faster convergence compared with SGA.
The speed of the OTSU image segmentation based on IAGA is investigated. The calculations are operated with five images, and image segmentations are carried out to each image for ten times. The results are shown in Table II, where T represents the time for the calculation of between-cluster variable. It can be found that the image segmentation based on IAGA has faster
TABLEII
COMPARE OF THE AVERAGE IMAGE SEGMENTATION TIME
Image Number Standard OTSU OTSU based on IAGA
[image:5.595.329.524.309.534.2] [image:5.595.314.540.606.747.2]1 389T 250T 2 348T 220T 3 380T 250T 4 371T 240T 5 354T 220T Fig. 3. The micro chip: (a) the micro chip attached to the leadframe, and (b) the image of a micro chip taken by CCD.
Fig. 2. The flowchart of vision alignment.
TABLE I
COMPARE OF THE CONVERGENCE BETWEEN SGA AND IAGA
Methods Average Convergence Numbers Iterative Numbers
SGA 16 12
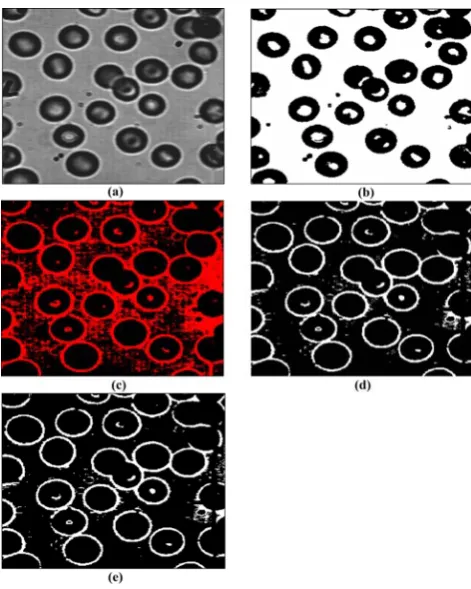
Simulations are performed to investigate the characteristics of image segmentation. The gray-scale image of cells is one of the standard images for image segmentation tests. Because there are similar image characteristics between the cell image and the chip image, a gray image of cells with the size of 272 pix*265 pix is adopted for the simulations in this paper, and it is displayed in Fig.4(a). Through image segmentation simulations of the cell image using MATLAB software, the parameters in Eqs.(9)-(11) are obtained as: Pc1=0.9, Pc2=0.6, Pm1=0.09,
Pm2=0.01, Pμ1= 0.7 and Pμ2=0.4. Figure 4(b) shows the ideal binary image of cell image through threshold segmentation. Figure 4(c) depicts the binary image of cell image by moment method. It is found in Fig.4(c) that the outlines of cells are separated, but there is a lot of noise around the cells. Because there are adhesions between the outlines and noise, the characteristics of cell outlines are difficult to be distinguished. Figure 4(d) shows the binary image of cell image by OTSU method based on SGA. It can be seen in Fig.4 (d) that the outlines of cells are separated, and there is some noise around the cells. The binary image of cell image by OTSU method based on IAGA is shown in Fig.4(e). It can be seen in Fig.4(e) that the outlines of cells are separated, and there is less noise around the cells compared with the moment method and the OTSU method based on SGA.
V. EXPERIMENTS
A. Threshold Segmentations of Chip Images
Experiments were carried out to investigate the characteristics of image segmentations. In the experiments, Dongguan Coax-25 light source was adopted for lighting. A Computar MLM-3XMP optical micro lens and JAI CV-A1 CCD camera were used to take the images of chips, and the image features were collected using a NI PCI-1409 image acquisition card.
A segmented image of micro chip is displayed in Fig.5 (a). Figure 5(b) shows the binary image of chip image by moment method. It is seen in Fig.5(b) that the outlines of solder joints are separated, but there is a lot of noise around the solder joints, the features of solder joints outlines are not easy to be distinguished. Figure 5(c) depicts the binary image of chip image by OTSU method based on SGA. It is seen in Fig.5(c) that the outlines of solder joints are separated, and there is some noise around the solder joints. The binary image of chip image by OTSU method based on IAGA is described in Fig.5(d). It can be observed that the outlines of solder joints are separated with less noise around the solder joints compared with the moment method and the OTSU method based on SGA, and there is no adhesion between the outlines and noise.
B. Vision Alignments
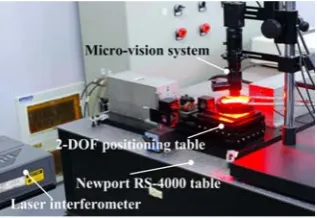
[image:6.595.318.536.382.578.2]The vision alignments were realized with the aid of a precision positioning table driven by linear voice coil motors which can move in two orthogonal directions (X and Y) [37]. To reduce the disturbances of external environment such as noise, vibration, the system for vision alignment was set up on a Newport RS-4000 vibration isolated table. Laser-based-Interferometer sensing methodology was chosen
Fig. 5. The segmentation images of micro chip: (a) a gray image of a segmented chip, (b) the binary image of micro chip image by moment method, (c) the binary image of micro chip by OTSU method based on SGA, and (d) the binary image of micro chip by OTSU method based on IAGA.
[image:6.595.49.285.392.687.2]the characteristics of the vision alignment. The experiment setup is shown in Fig.6.
The process of the experiments is shown as follows: (1) The chips attached to the leadframes were placed on the positioning table, and the image features of chips were collected when the table moved to several positions. (2) The threshold segmentation of the chip image at the initial position was conducted, and the image was defined as the template. Then its position was recorded using moment alignment method. (3) The chip images at different positions were segmented, and their positions were calculated using moment alignment method. (4) The errors of vision alignments for the solder joints are equal to the differences between their positions in the measured chips and the template chip.
The errors of vision alignment for a solder joint in a chip when the table moved in Xdirection are shown in Table III, and the errors of vision alignment for a solder joint in a chip when the table moved in Y direction are summarized in Table IV, where one pixel represents 3.1 µm. It can be seen that the errors are smaller when using OTSU threshold segmentation method based on IAGA compared with the moment method and the OTSU method based on SGA, and there are failures when using moment segmentation method. The errors are within 1.1 µm when using OTSU segmentation method based on IAGA.
The errors of vision alignment for a solder joint in a chip when the table moved in X and Y directions are shown in Table V. It can be found that the errors are smaller when using OTSU threshold segmentation method based on IAGA compared with the moment method and the OTSU method based on SGA, and there are failures when using moment threshold segmentation method.
The actual industrial process for vision alignment has been carried out. The errors of the solder joints in chips generated by the former process of the bonding are generally within 450 μm [38], so the errors of the solder joint positions were defined as 450 μm in this paper, the vision alignments were repeated by ten times, and the results show that when using OTSU method based on SGA the average alignment time for the X- and Y-axes are 92 ms and 85 ms, respectively, and the errors for X-axis and Y-axis are 2.6 μm and 2.2 μm, respectively. When using OTSU method based on IAGA,the X-axis and Y-axis
respectively. So the OTSU method based on IAGA is superior to the OTSU method based on SGA in improving the precision and speed of the vision alignment for solder joints in a microelectronic chip.
VI. CONCLUSION
[image:7.595.90.249.144.253.2]To avoid falling into local optimum and improve the speed of image segmentation, this paper presents an IAGA considering the features of the chip images, and it is introduced to the image segmentation for the solder joints in the microelectronic chip. Computational and experimental results show that the IAGA has faster convergence compared with SGA, and the quality of the segmented images becomes better by using the proposed method. The micro vision alignment was realized by using moment invariant approach. Experiments were carried out to implement the micro vision alignment of the solder joints in the microelectronic chips, and the results indicate that the alignment errors are smaller when using OTSU threshold segmentation method based on IAGA compared with the moment method and the OTSU method based on SGA, and there are no failures when using OTSU threshold segmentation method based on IAGA. The experiments for actual industrial Fig. 6. Experiment setup for vision alignment
TABLE V
ERRORS OF X- AND Y-AXES VISION ALIGNMENTS (UNIT: PIXEL)
Displacement Moments OTSU based on SGA OTSU based on IAGA
(-20, -20) (0.92, 1.39) (0.31, 0.50) (0.16, 0.23) (-10, -10) (0.83, 1.41) (0.25, 0.26) (0.11, 0.09) (10, 10) (0.15, 0.12) (0.35, 0.32) (0.17, 0.26) (20, 20) (0.13, 0.11) (0.22, 0.18) (0.05, 0.02) (-20, 20) Failure (0.24, 0.52) (0.10, 0.36) (-10, 10) Failure (0.37, 0.42) (0.17, 0.27) (10, -10) (0.72, 1.56) (0.22, 0.42) (0.20, 0.29) (20, -20) (0.87, 1.40) (0.31, 0.29) (0.25, 0.19)
TABLE IV
ERRORS OF Y-AXIS VISION ALIGNMENTS (UNIT: PIXEL)
Displacement Moments OTSU based on SGA OTSU based on IAGA -20 1.32 0.45 0.36 -10 1.58 0.37 0.05
10 Failure 0.32 0.08
20 Failure 0.51 0.27
TABLE III
ERRORS OF X-AXIS VISION ALIGNMENTS (UNIT: PIXEL)
Displacement Moments OTSU based on SGA OTSU based on IAGA
process of micro-vision alignment show that the OTSU method based on IAGA is superior to the OTSU method based on SGA in improving the precision and speed of the vision alignments, and shows great potential for microelectronic bonding.
REFERENCES
[1] Y.M. Li, and Q. S. Xu, “Design and robust repetitive control of a new parallel-kinematic XY piezostage for micro/nanomanipulation,”
IEEE/ASME Trans. Mechatronics, vol. 17, no. 6, pp. 1120–1132, Dec. 2012.
[2] Y. Tian, B. Shirinzadeh, D. Zhang, and G. Alici, “Development and dynamic modelling of a flexure-based scott-russell mechanism for nanomanipulation,” Mech. Syst. Signal Process., vol. 23, pp. 957–978, Apr. 2009.
[3] M. Rakotondrabe, Y. Haddab, and P. Lutz, “Development, modeling, and control of a micro-/nanopositioning 2-DOF stick-slip device,”
IEEE/ASME Trans. Mechatronics, vol. 14, pp. 733-745, Dec. 2009. [4] M. U. Khan, N. Bencheikh, C. Prelle, F. Lamarque, T. Beutel, and S.
Buttgenbach, “A long stroke electromagnetic XY positioning stage for micro applications,” IEEE/ASME Trans. Mechatronics, vol. 17, no. 5, pp. 866–875, Oct. 2012.
[5] F. Wang, X. Zhao, D. Zhang, and Y. Wu, “Development of novel ultrasonic transducers for microelectronics packaging,” J. Mater. Process. Technol., vol. 209, pp. 1291-1301, Feb. 2009.
[6] F. Wang, X. Zhao, D Zhang, Z Ma, and X. Jing, “Robust and precision control for a directly-driven XY table,” Proc. Inst. Mech. Eng. Part C J. Mech. Eng. Sci., vol. 225, pp. 1107-1120, May 2011.
[7] Y. Qin, Y. Tian, D. Zhang, B. Shirinzadeh, and S. Fatikow, “A novel direct inverse modeling approach for hysteresis compensation of piezoelectric actuator in feedforward applications,” vol. 18, no. 3, pp. 981–989, Jun. 2013.
[8] Y. Tian, B. Shirinzadeh, and D. Zhang, “Design and dynamics of a 3-DOF flexure-based parallel mechanism for micro/nano manipulation,” Microelectron. Eng., vol. 87, no. 2, pp. 230–241, Feb. 2010.
[9] Y. Li, and Q. Xu, “Development and assessment of a novel decoupled XY parallel micropositioning platform,” IEEE/ASME Trans. Mechatronics, vol. 15, no. 1, pp. 125–135, Feb. 2010.
[10] M. N. Mohd Zubir, B. Shirinzadeh, Y. Tian, “Development of a novel flexure-based microgripper for high precision micro-object manipulation,” Sens. Actuators A Phys., vol. 150, no. 2, pp. 257–266, Mar. 2009.
[11] B. J. Kenton, and K. K. Leang, “Design and control of a three-axis serialkinematic high-bandwidth nanopositioner,” IEEE/ASME Trans. Mechatronics, vol. 17, no. 2, pp. 356–369, Apr. 2012.
[12] M. Barp, and D.Vischer, “Achieving a world record in ultra high speed wire bonding through novel technology,” In Proc. IEEE/CPMT Int. Electron. Manuf. Technol. IEMT Symp., CA, USA, 2002, pp. 342-347. [13] J. Zimmermann, and O. Sawodny, “Modeling for simulation and control
of a X-Y high precision positioning table,” In Proc. IEEE Int. Conf. Autom. Sci. Eng., AZ, US, 2007, pp. 1093-1098.
[14] M. T. Yan, K. Y. Huang, Y. J. Shiu, and Y.Chen, “Disturbance observer and adaptive controller design for a linear-motor-driven table system,” Int. J. Adv. Manuf. Technol., vol. 35, pp. 408-415, Dec. 2007.
[15] A. Yamauchi, “Submicron flip chip bonding technology for opto-electronic devices,” In Proc. Electron. Compon. Technol. Conf., NV, USA, 2000, pp. 1743-1746.
[16] L. Ren, L. Wang, J.K. Mills, and D. Sun, “3-D automatic microassembly by vision-based control,” In Proc. IEEE Int. Conf. Intell. Rob. Syst., CA, USA, 2007, pp. 297-302.
[17] Y.S. Ihn, S.H. Ryu, B.J. Choi, S.H. Ha, H.R. Choi, S.M. Lee, and J.C. Koo, “An enhanced vision processing algorithm for a micro-manipulation system,” In Proc. Int. Workshop Rob. Sensor Environ., ON, Canada, 2007, pp. 7-12.
[18] F.-Y. Wang, P.J.A. Lever, and B. Pu, “A robotic vision system for object identification and manipulation using synergetic pattern recognition,”
Robot. Comput.-Integr. Manuf., vol. 10, pp. 445-459, Dec. 1993. [19] M. Moganti, F. Ercal, C. H. Dagli, and S. Tsunekawa, “Automatic PCB
inspection algorithms: a survey,” Comput. Vision Image Undersanding, vol. 63, pp. 287-313, Mar. 1996.
[20] B. Heinz, “ESWIS-ESEC Wire bonder image system”, Microelectron. J., vol. 28, pp. 18-24, Feb.1993.
[21] W. Zhang, L.M. Koh, and E. Wong, “Computer vision system for the measurement of IC wire-bond height,” In Proc. 1993 IEEE Reg. 10 Conf. Comput. Commun. Control Power Eng., Beijing, China, 1993, pp. 948-951.
[22] Q.Z. Ye, S.H. Ong, and X. Han, “A stereo vision system for the inspection of IC bonding wires,” Int. J. Imaging Syst. Technol., vol. 11, pp. 254-262, 2000.
[23] H.G. Luo, L.M. Zhu, and H. Ding, “An industrial solution to object pose estimation for automatic semiconductor fabrication,” Int. J. Adv. Manuf. Technol., vol. 32, pp. 969-977, Apr. 2007.
[24] J. Li, Y. Wang, D. Zhang, and X. Zhao, “Design and simulation of the positioning system using computer vision for IC packaging,” J. Shanghai Jiaotong Univ. Sci., vol. 13, pp. 91-95, Apr. 2008.
[25] Z. G. Yang, and G. H. Xie, “The precision positioning of solder joints in the micro chips based on wavelet theory,” Comput. Apps, vol. 24, pp. 230-232, 2004.
[26] S. D. Wei, and S. H. Lai, “Robust and efficient image alignment based on relative gradient matching,” IEEE Trans. Image Process., vol. 15, pp. 2936-2943, Oct. 2006.
[27] D. Aiger, and K. Kedem, “Geometric pattern matching for point sets in the plane under similarity transformations,” Inf. Process. Lett., vol. 109, pp. 935-940, Jul. 2009.
[28] D.E. Goldberg, Genetic algorithms in search, optimization and machine learning. Reading, MA: Addison Wesley. 1989.
[29] J.H. Holland, Adaptation in natural and artificial systems, Ann Arbor: Univ. Michigan Press, 1975.
[30] W.-Y. Lin, W.-Y. Lee, and T.-P. Hong, “Adapting crossover and mutation rates in genetic algorithms,” J. Inf. Sci. Eng., vol. 2, pp. 889-903, Sep. 2003.
[31] M. Srinivas, and L.M. Patnaik, “Adaptive probabilities of crossover and mutation in genetic algorithms,” IEEE Trans. Syst. Man. Cybern., vol. 24, pp. 656-667, Apr. 1994.
[32] Z. Ren, and Y. San, “Improved adaptive genetic algorithm and its application research in parameter identification,” J. Syst. Simul., vol. 18, pp. 41-66, Jan. 2006.
[33] L. Wang, and T. Shen, “Improved adaptive genetic algorithm and its application to image segmentation,” In Proc. SPIE Image Ext., Segment., Recognit., China, 2001, pp. 115-120.
[34] Z. Chen, X. Fu, and X. Zhou, “Image segmentation based on Improved Adaptive Genetic Algorithm,” Key Eng. Mat., Vol. 464, pp. 151-154, 2011.
[35] J. Huang, “Function optimization and image matching based on improved adaptive Genetic algorithm,” Int. J. Adv. Comput. Technolog., Vol. 4, no. 19, pp. 57-64, 2012.
[36] M.-K. Hu, “Visual pattern recognition by moment invariants,” IRE Trans. Information Theory, vol.2, pp. 179-188, 1962.
[37] F. Wang, X. Zhao, D. Zhang, Y. Wu, B. Shirinzadeh, and Y. Tian, “Design and control of a high-acceleration precision positioning system with a novel flexible decoupling mechanism,” Proc. Inst. Mech. Eng. Part C J. Mech. Eng. Sci., vol, 224, pp. 431-442, Jan. 2010.
[38] S.W. Liu, “Vision positioning method and system development for wire bonder,” M.S. dissertation, Dept. Mech. Eng., Univ. Tianjin, Tianjin, 2011.
Fujun Wang received the B.Eng. degree in
mechanical manufacturing and automation from Hebei University of Technology, Tianjin, China, in 2005, and the M.Sc. and Ph.D. degrees in mechanical manufacturing and automation from Tianjin University, Tianjin, China, in 2007 and 2010, respectively.
Shiwei Liu received the B.Eng. degree in mechanical manufacturing and automation in the School of Mechanical Engineering, Xi’an Jiaotong University, Xi’an, China, in 2009, and he is currently working towards the M.Sc. degree in mechanical engineering in the School of Mechanical Engineering, Tianjin University, Tianjin, China.
His current research interests include high speed and high precision positioning system, vision positioning, and image processing.
Xingyu Zhao received the B.Eng. and M.E. degrees from Hebei University of Technology in 1995 and 1998, respectively, and Ph.D. degree in mechanical manufacturing and automation from Tianjin University, Tianjin, China, in 2001.
Now she is an Associate Professor in the School of Mechanical Engineering, Tianjin University. Her current research interests are the kinematics and dynamics of parallel manipulators, finite element analysis, and micro/nanopositioning technique.
Dawei Zhang received the B.Eng. degree in mechanical engineering from Shenyang University of Technology, Shenyang, China, in 1984, and the M.Sc. and Ph.D. degrees in mechanical engineering from Tianjin University, Tianjin, China, in 1990 and 1995, respectively.
From 1984 to 1987, he was an Associate Engineer with the Tianjin Institute of Power Source, China. He is currently a Professor in the School of Mechanical Engineering, Tianjin University. His current research interests include micro/nanopositioning technique, structural dynamics, signal processing, high-speed machining methodologies, and dynamic design of machine tools.
Yanling Tian received the B.Eng. degree in mechanical engineering from Northwest Institute of Light Industry, Xianyang, China, in 1997, and the M.Sc. and Ph.D. degrees in mechanical engineering from Tianjin University, Tianjin, China, in 2002 and 2005, respectively.