warwick.ac.uk/lib-publications
Original citation:
Uddin, Kotub, Jackson, Tim, Widanage, Widanalage Dhammika, Chouchelamane, Gael,
Jennings, P. A. (Paul A.) and Marco, James. (2017) On the possibility of extending the lifetime
of lithium-ion batteries through optimal V2G facilitated by a flexible integrated vehicle and
smart-grid system. Energy, 133 . pp. 710-722.
Permanent WRAP URL:
http://wrap.warwick.ac.uk/88018
Copyright and reuse:
The Warwick Research Archive Portal (WRAP) makes this work of researchers of the
University of Warwick available open access under the following conditions.
This article is made available under the Creative Commons Attribution 4.0 International
license (CC BY 4.0) and may be reused according to the conditions of the license. For more
details see:
http://creativecommons.org/licenses/by/4.0/
A note on versions:
The version presented in WRAP is the published version, or, version of record, and may be
cited as it appears here.
On the possibility of extending the lifetime of lithium-ion batteries
through optimal V2G facilitated by an integrated vehicle and
smart-grid system
Kotub Uddin
a,*, Tim Jackson
a, Widanalage D. Widanage
a, Gael Chouchelamane
b,
Paul A. Jennings
a, James Marco
aaWMG, International Digital Laboratory, The University of Warwick, Coventry CV4 7AL, UK bJaguar Land Rover, Banbury Road, Warwick, CV35 0XJ, UK
a r t i c l e i n f o
Article history:
Received 10 December 2016 Received in revised form 18 April 2017
Accepted 21 April 2017 Available online 25 April 2017
Keywords:
Battery degradation Ageing model V2G Smart grid Electric vehicle
a b s t r a c t
Renewable energies are a key pillar of power sector decarbonisation. Due to the variability and uncer-tainty they add however, there is an increased need for energy storage. This adds additional infra-structure costs to a degree that is unviable: for an optimal case of 15 GW of storage by 2030, the cost of storage is circa:£1000/kW. A promising solution to this problem is to use the batteries contained within electric vehicles (EVs) equipped with bi-directional charging systems to facilitate ancillary services such as frequency regulation and load balancing through vehicle to grid (V2G) technologies. Some authors have however dismissed V2G as economically unviable claiming the cost of battery degradation is larger than arbitrage. To thoroughly address the viability of V2G technologies, in this work we develop a comprehensive battery degradation model based on long-term ageing data collected from more than fifty long-term degradation experiments on commercial C6/LiNiCoAlO2batteries. The comprehensive model accounts for all established modes of degradation including calendar age, capacity throughput, temperature, state of charge, depth of discharge and current rate. The model is validated using six operationally diverse real-world usage cycles and shows an average maximum transient error of 4.6% in capacity loss estimates and 5.1% in resistance rise estimates for over a year of cycling. This validated, comprehensive battery ageing model has been integrated into a smart grid algorithm that is designed to minimise battery degradation. We show that an EV connected to this smart-grid system can accom-modate the demand of the power network with an increased share of clean renewable energy, but more profoundly that the smart grid is able to extend the life of the EV battery beyond the case in which there is no V2G. Extensive simulation results indicate that if a daily drive cycle consumes between 21% and 38% state of charge, then discharging 40%e8% of the batteries state of charge to the grid can reduce capacity fade by approximately 6% and power fade by 3% over a three month period. The smart-grid optimisation was used to investigate a case study of the electricity demand for a representative University office building. Results suggest that the smart-grid formulation is able to reduce the EVs' battery pack capacity fade by up to 9.1% and power fade by up to 12.1%.
©2017 The Authors. Published by Elsevier Ltd. This is an open access article under the CC BY license (http://creativecommons.org/licenses/by/4.0/).
1. Introduction
There is a recognised duality between energy consumption and economic growth which underpins quality of life[1]. Strong eco-nomic growth and expanding populations are leading to increased global energy demands and consequently carbon dioxide emissions
[2]. Given that a large part of the emissions arises from consump-tion of fossil fuels the obvious route to decarbonisaconsump-tion is reducing energy consumption. The possible negative impacts on economic growth arising from cutting back energy demand however, forces us to seek more environmentally clean alternative energy resources
[3]. To this end, renewable energy technologies offer the promise of clean, abundant energy gathered from self-renewing resources[4]. A challenge with renewable energy systems such as solar, wind and tidal energy is theflexibility needed to match demand and supply. *Corresponding author.
E-mail address:[email protected](K. Uddin).
Contents lists available atScienceDirect
Energy
j o u r n a l h o me p a g e : w w w . e l s e v i e r . c o m/ l o ca t e / e n e r g y
http://dx.doi.org/10.1016/j.energy.2017.04.116
This requirement is particularly pronounced in electrical energy systems in which demand and supply need to match at each time point[5]. To balance the supply/demand problem, energy storage is required, which can be costly. Therefore, in addition to technical challenges, there are economic questions regarding the feasibility of large scale energy storage systems.
For electrical energy storage, an attractive solution to this challenge which has recently gained much attention[6e9]is the possibility of using electric vehicles equipped with bi-directional charging systems to facilitate ancillary services such as frequency regulation[10,11]and load balancing through the use of their on-board batteries[12e14]. In addition to the provision of ancillary services, Lund and Kempton[15]show that adding such vehicle-to-grid technologies to EVs can provide the necessary matching be-tween the time of generation and time of load. Commercially available EVs that facilitate such services using V2G technologies are becoming available on the market today. The economic viability of V2G services however, will depend on thefinancial profitability of the service for the end customer, aggregator, distributed network operator, distributed system operator; for example, the profitability of energy arbitrage.
The revenue from energy arbitrage is governed by real time pricing tariffs, transmission and distribution costs and round-trip efficiency[16]which is a combination of discharge efficiency and charge efficiency (in excess of 95% for discharge/charge cycles for lithium ion batteries[17]). The resulting profit from energy arbi-trage is calculated by subtracting the degradation cost and the cost of buying electricity from that of selling it to offset the owner's use and multiplying by the number of kWhs transacted and adjusting for efficiency [16]. While energy tariffs, transmission costs and distribution costs are well defined, battery degradation and effi -ciency (which changes with degradation) is less well defined and understood. For an accurate account of viability, costs associated with battery degradation must be considered to a suitable degree of accuracy.
Previous studies, such as Refs.[15,16,18], which considered the Vehicle-to-Grid (V2G) cycling costs associated with battery degradation concluded that V2G profits are outweighed by the possible reductions in battery lifetimes. These studies however,
calculated degradation costs using simple regression models based on laboratory data for a limited set of ageing stress factors, namely depth of discharge (
D
SoC) and current rate (Crate). In fact, the moresevere stress factorseelevated temperature (T) and state of charge
(SoC) during cycling and storage [19] e were not considered.
Bashash et al.[20]considered a 1D electrochemistry model coupled with a simple model for the growth of the solid electrolyte interface (SEI). Although the model is more grounded in electrochemistry theory, the authors chose not to include other mechanisms of battery degradation in addition to SEI growth. Ignoring the fact that the SEI is only one mechanism from the many mechanisms of battery degradationealbeit dominant under particular conditions
eboth the electrochemical and SEI models used in the study were
not validated using real or hypothetical data. Marongiu et al.[21], on the other hand, carried out V2G viability studies by optimising energy cost and battery longevity using a more complete empirical model for battery degradation. In addressing this optimisation problem, in addition to reducing battery degradation arising from V2G use, their strategy required grid requests in terms of power requirements to be satisfied. Most recently, Duabbary et. al.[50]
have written about the viability of V2G operations. Although their approach is simplistic in comparison to the study of Marongiu et al.
[21]ethat is, the study considered simple charge discharge
pro-files, without any intelligent control algorithms e their results
suggest that in terms of exchanged capacity, the worst-case sce-nario is the case involving rest periods at work and no V2G at home. This means that by intelligently optimising the condition of the battery during these rest periods via V2G operations, there may be an opportunity to positively impact the state of health of an electric vehicle’s battery, as will be studied in this paper.
In this study we present a comprehensive battery ageing model based on data collected from more than 50 long-term ageing tests in which commercial batteries were cycled under a wider range of operational conditions spanning 0CT45C, 15%SoC95%, 0%
D
SoC80%, with charging and discharging rates up-to and including the maximum manufacturer defined limits. A phenom-enological ageing model based on equivalent circuits, as described in Ref. [22], is developed and parametrised using the long-term ageing test data. This ageing model is then validated using long-AbbreviationsBMS Battery Management System CC Constant Charge
CF Capacity Fade CV Constant Voltage ECM Equivalent Circuit Model
EIS Electrochemical Impedance Spectroscopy EV Electric Vehicle
LCO Lithium cobalt oxide LFP Lithium iron phosphate LTO Lithium titanium oxide
NCA Lithium nickel cobalt aluminium oxide NMC Lithium nickel cobalt manganese oxide PF Power Fade
ULCVDP Ultra-Low Carbon Vehicle Demonstrator Programme V2G Vehicle to Grid
Nomenclature
A Cell surface area [m2]
Aref Pre-exponential factor in Arrhenius equation
cp Cell heat capacity [J/(kg.K)]
Crate Cerate
EA
act Activation energy [J/mol]
h Heat transfer coefficient [W/(m2K)] I Current load [A]
K Capacity throughput [Ah] m Cell mass [g]
N Cycle number Q Cell capacity [Ah]
Qrated Maximum discharge capacity defined by manufacturer
[Ah]
R Molar gas constant [J/(mol K)] SoC State of Charge
D
SoCDriveState of Charge used in drivingD
SoCV2G State of Charge used in V2GD
SoC Change in State of Charge t Time [Hour]term ageing data from six, operationally diverse, real-world usage cycles. This comprehensive and validated ageing model is used to design an algorithm which seeks to minimise battery degradation. In further contrast with previous works, V2G is just an effective and efficient mechanism that is employed to facilitate this. V2G cycling is used to reduce/increase the batteries SoC to values where degradation resulting from storage is minimised. Furthermore, at SoCs between 60 and 40%, the internal resistance of the battery is at a minimum; in this SoC region the associated Joule heating under cycling is also minimised. For thefirst time, we show that under specific circumstances V2G cycling can conserve, and even increase, the lifetime of an EV beyond the case in which there is no V2G cycling. As such, V2G can provide an effective mechanism by which the lifetime of an EV can be extended.
In the next section the formulation of the battery ageing model is presented. This section also includes a description of the lithium ion batteries used for this study, the experimental set-up for ageing experiments, the tests carried out to characterise battery ageing, model parametrisation and model validation. The authors consider a grid topology that facilitates the storage and transfer of renewable energy; the grid structure and V2G scenario is presented in Section
3. Using the battery degradation model developed in Section2, in Section4, a smart-grid system is proposed in which an algorithm aimed at minimising capacity and power fade is integrated. This smart-grid system is used in Section5for a case study investigating the impact of V2G on the electricity demand for a representative University office building. In Section6, the results are discussed and potential further work is stated. Finally, in Section7the conclusions of the work are presented.
2. Battery ageing model
2.1. Model definition
Battery degradation occurs due to chemical side reactions dur-ing storage and electrochemical side reactions durdur-ing cycldur-ing. Electrical and thermal loads also cause electrochemo-mechanical degradation through volumetric changes of the active material. A complete discussion on battery degradation mechanisms is beyond the scope of this paper, interested readers are directed to Refs.[19,23]. Previous experimental studies of cell ageing show that the rate of battery degradation due to storage and cycling is pro-portional totb[24]and cycle numberN[25]respectively, wheretis calendar age and
b
is 0.5 when SEI growth is the dominant ageing mechanism [26],[27]. The rate of battery degradation will also depend on the environmental, chemical and electrochemical state of the battery. From a systems perspective, these environmental and operational states are expressed as battery degradation accel-eration/stress factors which include elevated temperatureT[17,22], state of chargeSoC[29], depth of dischargeD
SoC[30]and current rateCrate[31]. The rate of degradation during storage is dependanton stress-factors T and SoC, while the rate of cycling related degradation is dependent onT,SoC,
D
SoCandCrate:The effects ofthese stress factors e based on published literature e at the
microscopic level are presented usingflow charts in Ref.[23]. The stress factorsT,SoC,
D
SoCandCrateare dynamic and evolveunder a batteries dynamic environmental conditions and usage, see Ref. [32] for mathematical definitions. The cell temperature is calculated using a bulk thermal model
mcpd
dtTðtÞ þhAðTðtÞ TambÞ ¼IðVVOCÞ (1)
whereTambis the ambient temperature,mis the cell mass,cpis the
heat capacity of the cell,Ais the surface area of the cell,his the heat
transfer coefficient of the cell andIðVVOCÞrepresents irreversible
joule heating caused by Li-ion transport under cyclingewhereVis
the terminal voltage andVOCis the open circuit potential.
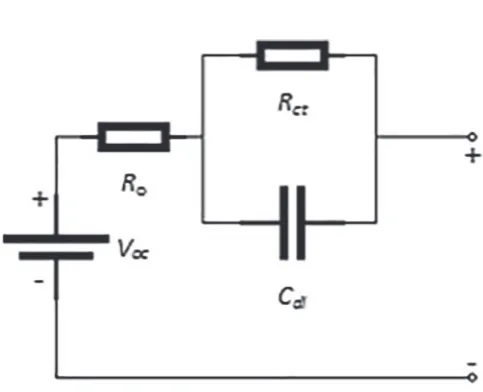
To predict battery degradation, an accurate account of the long-term history of these stress factors for a given usage cycle is required. As such, the equivalent circuit model (ECM) presented withinFig. 1 [17]is employed to estimate the time varying evolu-tion of these stress factors. The ECM, more than other models, lends itself to parametrisation from standardised ageing characterisation tests. Such phenomenological models are well established in the field of battery modelling [33]. The lumped-parameter ECM structure comprises an ideal voltage source which represents the open circuit potential (VOC) of the paired electrode systemein this
case C6/LiNiCoAlO2. This is serially connected to a variable resistor representing the internal resistanceR0, i.e., the Ohmic resistance which comprises all electronic resistances. The resistor-capacitor (RC) pair represents the charge-transfer resistance (Rct) coupled
with surface layer capacitancesCdl;c.f., Ref[17]for model
equa-tions. While all the circuit elements vary withT,SoCandCrate, the
resistance elements, as well as the cell capacity QðtÞ; are also dependent on the varying time history of TðtÞ, SoCðtÞ,
D
SoCðtÞ; CrateðtÞ. After every time step therefore, batterydegra-dation needs to be assessed and the circuit parameters need to be updated. Capacity fade (CF) and power fade (PF)ewhich are the
conventional engineering metrics used to define battery degrada-tioneare defined as:
CF¼1 Q
m
CFQrated Qratedm
CFQrated(2)
PF¼
m
1PF1
R0þRCT R0ð0Þ þRCTð0Þ
1
(3)
where
m
CFis the factor of the cells rated capacity at which point thebattery is considered notfit for purpose (for automotive applica-tions it is often cited as 0.8 or a 20% loss in capacity[34]) and
m
PFis the factor of the cells total resistance at which point the battery is considered not fit for purpose (for automotive applications it is cited as 2 or a 100% increase in total resistance[34]). CF and PF are designed such that at 100% the battery is considered notfit for purpose. The cost of battery degradation (£deg) is defined as [image:4.595.305.547.533.729.2]£deg¼max½CF£batt;PF£batt (4)
where£battis the cost of replacing the battery.
2.2. Ageing experiments
Within this study, a total of 63 (45 cells for isolated ageing tests and 18 cells for validation ageing tests) commercially available 3 Ah 18650 cells were used. Each cell comprises of a LiC6 negative electrode, LiNiCoAlO2 positive electrode, separated by a poly-ethylene separator, sandwiched between two current collectors and immersed in an electrolyte solution. The manufacturers rec-ommended maximum continuous charge and discharge current rates are defined as 1.2C and 0.3C respectively. The maximum instantaneous charge and discharge current rates are defined as 5C and 1.5C respectively.
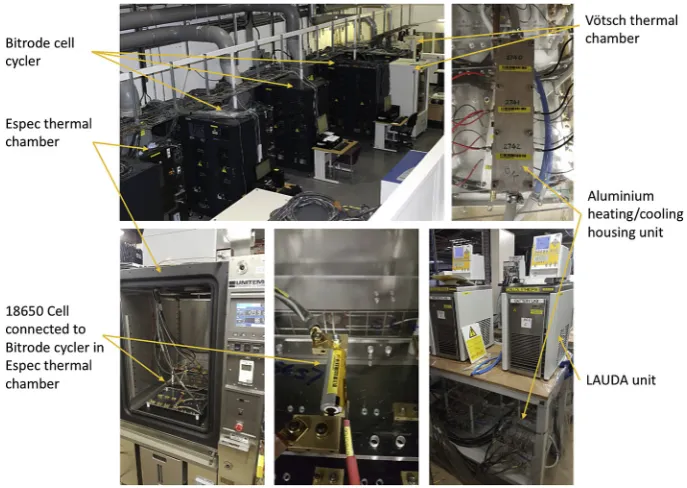
Each cell was allocated a unique number ranging from 1 to 63 and adjusted to the requiredSoCvalue ofSoCusing a Bitrode cell cycler (with associated monitoring and control software). The cells aged under storage conditions were then placed in a Votsch ther-€ mal chamber. The cells aged by cycling were exercised using the Bitrode cell cycler within an Espec thermal chamberfixed to 25C. The experiential set-up is shown inFig. 2. The storage and cycling conditions used are summarised inTable 1.
For the validation cycles presented insubsection 2.5, a varying temperature profile which reflects daily and annualfluctuations in ambient temperature is required. For this purpose, the thermal management solution adapted the use of a commercially available LAUDA (Model Proline RP845C) heating and cooling unit. The cells under test were embedded into an aluminium housing unit con-nected on either side to a water inlet and outlet. The temperature of the water was controlled by using the commercially available LAUDA unit. This thermoregulatory unit provided 0.01C resolution for the control temperature. Theflow rate was adjusted as neces-sary to mimic the ambient temperature rises and falls of the different regions considered in the work. The water passed through a heating/cooling jacket in contact with the radial surface of each cell. The temperature at the water cooled/heated cell jacket was measured at the inlet to the LAUDA unit and was found to be stable to±0.5C.
The cells were characterised every 8 weeks (approximately) for degradation. The characterisation tests employed to track the evolution of cell ageing are described in the next subsection.
2.3. Ageing characterisation and ageing experimental results
In this work several 3 Ah, C6/LiNiCoAlO2, 18650, commercial cells are aged under various cycling and storage conditions. The cells arefirst characterised upon delivery. The characterisation tests involved:
[image:5.595.312.564.85.234.2]A retained capacity measurement at a temperature of 25C for a constant discharge current of 1C, C/10 and C/25. After taking the cells out of storage, this test entailed discharging the cells at a 1C rate to the manufacturer's recommended cut-off voltage (in this case 2.5V) at 25C using a commercial Bitrode Li-ion cell cycler. The cells were then allowed to rest for 3 h before being fully recharged via the constant current constant voltage (CC-CV) protocol using a 1C, C/10 or C/25 current for the CC part until the
[image:5.595.130.474.484.728.2]Fig. 2.Pictures showing the experimental set up for long term ageing tests at WMG's Energy Innovation Centre. Table 1
Summary of storage and cycling ageing tests carried out. Test T SOCstart DSoC Ccharge
rate C
discharge rate
1 10C 90%
2 10C 50%
3 10C 20%
4 25C 90%
5 25C 50%
6 25C 20%
7 25C 95% 80% 0.3C 1.2C
8 25C 95% 80% 0.3C 0.4C
9 25C 95% 30% 0.3C 1.2C
10 25C 95% 30% 0.3C 0.8C
11 25C 95% 30% 0.3C 0.4C
12 25C 50% 30% 0.3C 1.2C
13 45C 90%
14 45C 50%
voltage cut-off is reached (4.1 V) and a C/25 cut-off rate for the CV part.
The use of power pulse tests to estimate the resistance of each cell, in which the voltage response of each cell is measured for a 10 s current pulse at 20%, 40%, 60%, 80% and 100% of the man-ufacturers recommended maximum continuous charge and discharge current. Pulses are applied to each cell when pre-conditioned to an SoC of 90%, 50% and 20%, with all tests con-ducted at an ambient temperature of 25 C. To calculate resistance, the voltage/current data for each pulse isfitted to the ECM model (shown inFig. 3) using a least squares method. The measurement of the cells' impedance is made through
electrochemical impedance spectroscopy (EIS) using a Solatron ModuLab EIS System with a 2A booster card, with the cells preconditioned to an SoC of 90%, 50% and 20%. All tests were conducted at an ambient temperature of 25C.
After initial characterisation, the cells were stored/cycled under the defined ageing usage cycles. For each storage and cycling con-dition listed inTable 1three cells of the same type are aged. This ensures that the resulting ageing data set is robust. The cells are stored or cycled for approximately 10 weeks or 400e500 Ah
respectively, before they were re-characterised using the same
characterisation procedures noted above. The total test duration for the storage tests were 385 days and approximately 850/2300 cycles for 80%/30%
D
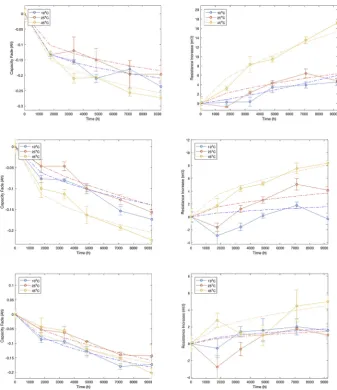
SoCcycling tests.Storage ageing results are presented inFig. 3. The results indi-cate, in agreement with established theory[19,23], that higher SoC and higher temperature storage leads to more pronounced battery degradation. Resistance rise results exhibit a trend consistent with Arrhenius behavior[35,36]:
Aref "
EA act R
1
Tref
1
T
!#
(5)
where Aref is a pre-exponential factor andRis the molar gas
con-stant; the activation energyEA
act was shown by Liaw et al.[36]to
[image:6.595.123.461.328.719.2]depend onSoC:The SoC and temperature dependent activation energy is deduced from gradient of lnðCFÞ vs the reciprocal of temperature plot shown inFig. 4, which shows a trend similar to that found in Ref. [36]. Capacity fade results suggest that cell degradation due to storage at 10C is marginally worse than at 25C. However, careful consideration highlights that capacity fade results for 10C and 25C lie within each other's error bounds. As such, we conclude that capacity fade for 10C and 25C are pre-dominantly similar.
Cycle ageing results are shown inFig. 5. The results suggest that, for the batteries considered in this work, discharging rate and
D
SoC have little impact on battery degradation; cycle degradation essentially only depends on capacity throughput. The observed marginal outlier (corresponding to Test 12, c.f.,Table 1) inFig. 5is due to the lower average SoC for that test because of the lower starting SoC.2.4. Model parametrisation
In order to facilitate the estimation of capacity fade and resis-tance rise for both cycling and storage, the capacity fade and resistance rise data for each curve inFigs. 3 and 5 isfitted to a fractional polynomial of the form:
Y¼Y0±
a
Xb (6)whereY is either capacity or resistance,Y0 is the corresponding initial value determined from thefirst characterisation test,Xis either time or capacity-throughout K, and
a
andb
are fittingparameters to be determined. The model parameters
a
andb
are linearly interpolated to estimate degradation for usage cycles that are beyond the parametrisation data set (c.f.,Table 1). While the form of the fractional polynomial (equation (6)) is established within lithium-ion battery literature [37], interpolation using phenomenological models such as those presented in Ref.[38]was not adopted due to the poorfitting results to the validation data.2.5. Ageing model validation
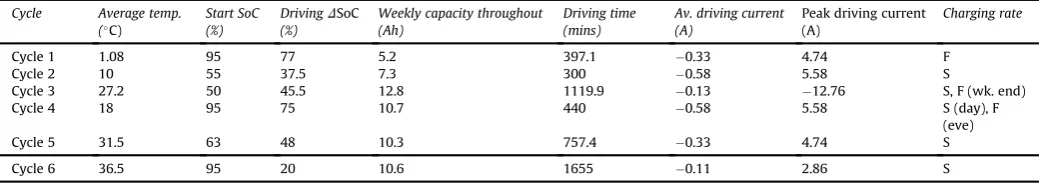
In order to validate the ageing model, six operationally diverse, real-world usage cycles are used. These validation usage cycles are expressed in terms of parameter-space inFig. 6and summarised in
Table 2. Each cycle is defined over a week and represents a range of driving behaviours and environments. The driving portion of the usage cycles are derived using a tool akin to therapid optimisation tooldeveloped by the authors[39]which constructs drive cycles by transforming established cycles such as Artemis, FTP, NEDCebased
on either a power requirement profile or a velocity profile and a simple road vehicle model (with configurable powertrains)eto
give the desired averageT,SoC;
D
SoCandCrate. Charging is dividedinto slow and fast charge. Slow charge consists of a 0:3Ccharge rate while fast charging follows the CC-CV (constant currenteconstant
voltage) protocol with a 1CCC rate and a 4:1VCV maintained until current falls below 0.14 A.
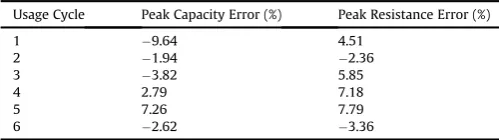
[image:7.595.133.475.61.311.2]Validation results are presented inFig. 7 and summarised in
Table 3. The peak error in all validation cycles are below 8%, except for capacity fade for Cycle 1 which had a poorerfitting to experi-mental data because the ambient temperature for the cycle was considerably outside the range of the parametrisation data set. For usage cycles that were within the range of the parametrisation data set, c.f.Fig. 6, the errors were lower (approximately <5%). The ambient temperature of 10C for Cycle 2 corresponded to the storage temperature of one of the long term ageing tests used for parameterisation; the error for Cycle 2 is thus the lowest out of the six validation cycles. This indicates, as expected, that the model works well when the usage cycle characteristics are close to the parametrisation data set.
2.5 2.6 2.7 2.8 2.9 3 3.1 3.2 3.3 3.4
3.1 3.15 3.2 3.25 3.3 3.35 3.4 3.45 3.5 3.55 3.6
ln
(C
F
)
-1000/T[K]
90% SoC50% SoC
20% SoC
Fig. 4.The Arrhenius plots of logarithmic capacity fades vs. reciprocal temperature for cells aged at 90%, 50% and 20% SoC.
[image:7.595.48.292.575.665.2]3. V2G system topology
3.1. Grid system architecture
There are two main V2G architectures that have been proposed in Ref.[40]: the deterministic architecture and the aggregative ar-chitecture. In the former, V2G is provided by each EV autono-mously, directly controlled and linked to the system operator by communication and power lines while in the latter it is provided by afleet of EVs. The deterministic architecture is limited and does not facilitate V2G in providing several services that require high power and energy minimum thresholds [40]. On the other hand, an aggregative framework is less restrictive in delivering services, but introduces the need for a smart grid[21].
In contrast to the work of Marongiu et al.[21], in this work we consider an aggregative framework where the principal function-ality of V2G energy transfer is to minimise battery degradation. The proposed architecture, depicted inFig. 8, addresses the challenges presented in Section1, namely the supply/demand mismatch in the renewable energy market [5] and the economic unviability of introducing large scale infrastructure required to support the grid at an industry level.
The architecture prosed inFig. 8isflexible and focuses on clean energy arbitrage with commercial buildings which can be more profitable than arbitrage with domestic households due to more expensive commercial electricity tariffs, discussed further in Sec-tion 5. A study by Koh [41] found that electricity storage in a building provides financial benefits to multiple parties through reduced load variability, reduced network losses, and improved
power system stability. Moreover, energy demand in commercial buildings is significantly higher (63%[42]) than homes and so V2G can be more effective from an environmental perspective. The system architecture proposed inFig. 8requires the use of a rela-tively cheap intermediary electricity storage technology such as pumped storage and compressed air which are typically regarded as having the lowest costs per unit of storage capacity and power capacity[43].
3.2. Algorithm used to minimise vehicle battery degradation
The smart grid interacts with the vehicle battery management system (BMS) to calculate the energy and power available from the car and the operational condition of the battery which minimises degradation. The logic employed by the integrated system is shown inFig. 9. This work assumes that the BMS can inform the grid of the energy required for the drivers return journey home, this energy is not accessible to the grid and thus provides a stringent SoC constraint. For a comprehensive review of electricity smart grids, interested readers are directed to Ref.[44].
The algorithm works by calculating the expected cost of battery degradation when the EV is connected to the smart grid
£degðTi;SoCiÞand compares this to a case where some capacity
D
SoC is discharged to the grid. If the algorithm finds that dis-chargingD
SoC to the grid causes a change in £deg such that £degðTi;SoCiÞ>£degðTiþ1; SoCiþ1;D
SoCÞ, it dischargesD
SoC to thegrid, otherwise the system remains idle. The algorithm works in two parts, first comparing the expected degradation between storing atSoCiandSoCiþ1ð¼SoCi
D
SoCÞand then comparing thedegradation expected for storing atSoCiþ1with degradation due to cycling fromSoCi/SoCiþ1, i.e., the capacity fade and power fade associated with capacity throughput (K¼Q
D
SoC) and tempera-ture riseD
T¼Tiþ1Ti. To calculate the optimialD
SoC whichminimises£deg, the algorithm works iteratively in
D
SoCincrements of 1%.4. Minimising battery degradation through optimal V2G cycling
Since the time history ofT,SoC;
D
SoCandCrateall contribute to [image:8.595.40.280.68.245.2]battery degradation, in this section we investigate the possibility of using V2G cycling to reduce battery degradation from a reference case where no V2G cycling occurs. The two mechanisms identified as most likely to limit battery ageing are: 1) modifying the storage SoC to one which minimises storage related degradation and 2) modifying theSoCsuch that high RMS cycling occurs in a region of lowest resistance thereby minimising Joule heating. As illustrated inFig. 9, the algorithm involves balancing between modifying to an optimal value and the cost associated with discharging the battery to that value. A request for power is made by the electricity network to the vehicles BMS, which is translated by the BMS into
D
SoCV2G. Fig. 6.The validation usage cycles depicted in parameter space. Cycle 1 is the furthestaway from the parametrisation data set while Cycles 2 and 3 are the closest.
Table 2
A summary of the validation usage cycles. Two charging rates: fast (F) and/or slow (S) was adopted. The Ah throughput is for a single cell where 100%. In regards to geographical locations, Cycles 1 to 6 correspond to Anchorage, Alsaka; Beijing, China; Phoenix, USA; London, UK; Riyadh, Saudi Arabia; Dallol, Ethiopia, respectively.
Cycle Average temp. (C)
Start SoC (%)
DrivingDSoC
(%)
Weekly capacity throughout (Ah)
Driving time (mins)
Av. driving current (A)
Peak driving current (A)
Charging rate
Cycle 1 1.08 95 77 5.2 397.1 0.33 4.74 F
Cycle 2 10 55 37.5 7.3 300 0.58 5.58 S
Cycle 3 27.2 50 45.5 12.8 1119.9 0.13 12.76 S, F (wk. end)
Cycle 4 18 95 75 10.7 440 0.58 5.58 S (day), F
(eve)
Cycle 5 31.5 63 48 10.3 757.4 0.33 4.74 S
[image:8.595.33.553.651.743.2]The BMS then estimates and compares the degradation associated with storing at SoCjk and the degradation associated with the transition SoCjk
D
SoCV2G where k represents a particular state. If the degradation associated with storing at SoCjkD
SoCV2Gis lower than storing at SoCjk; the BMS evaluates the degradation associ-ated with a discharge-capacity throughput ofD
SoCV2G. If the degradation caused by dischargingD
SoCV2Gis found to be less thanstoring at SoCjkthen the BMS authorises the discharge of
D
SoCV2G as power to the grid.For this particular task, we assume a simple usage profile whereby a driver drives to work, connects to the local building electricity network (from a smart car park) for electricity arbitrage at 8.30am and at the end of the work day (5pm) drives home and re-charges the vehicle from the intermediary electricity storage to 100%SoC. The results for capacity fade and power fade for this user as a function of single trip
D
SoCused for driving from/to home to/ from work (D
SoCDrive) andD
SoCdischarged to the grid (D
SoCV2G) isshown inFig. 10.
The results inFig. 10are arranged such that the top, middle and bottom panels show degradation after 3, 6 and 12 months respectively. As expected, capacity fade (left hand panels inFig. 10) and power fade (right hand panels in Fig. 10) are progressively worse with increased time; battery degradation is lowest when the car is not used at all, i.e.,
D
SoCDrive¼D
SoCV2G¼0. In the referencecase, where
D
SoCV2G¼0, CF and PF increase asD
SoCDriveincreaseswith a turning point at
D
SoCDrive¼29%; after this point CF and PFCycle 1 Cycle 2
Cycle 3 Cycle 4
[image:9.595.147.470.70.489.2]Cycle 5 Cycle 6
Fig. 7.Presents results of model validation where the solid line is the measured battery degradation and dashed line is the model estimate. For each usage cycle (labelled 1e6,
corresponding toTable 2) the results for capacity loss (blue) and resistance rise (red) is shown for 1 year. (For interpretation of the references to colour in thisfigure legend, the reader is referred to the web version of this article.)
Table 3
Summary of validation results showing the maximum transient error recorded be-tween estimated degradation and observed degradation. A minus sign indicates under-estimation while a positive value means over-estimation.
Usage Cycle Peak Capacity Error (%) Peak Resistance Error (%)
1 9.64 4.51
2 1.94 2.36
3 3.82 5.85
4 2.79 7.18
5 7.26 7.79
[image:9.595.42.292.578.648.2]recover. This turning point is associated with the shift in balance between degradation due to capacity throughput and degradation due to storage; although the capacity throughput is relatively low when
D
SoCDrive <29%, the storageSoC is high; whenD
SoCDrive>29%, a storageSoC<71% yields lower degradation.
Profoundly, the results presented inFig. 10show that, for the scenario considered, there are circumstances when V2G cycling will extend the lifetime of automotive batteries beyond the refer-ence case, i.e., when there is no V2G. The results indicate that if the driving
D
SoC is between 21%D
SoCDrive38% then dischargingbetween 40%
D
SoCV2G8% for V2G can reduce CF byapproximately 6% and PF by 3% over three months. This is because at higherSoCsthe degradation associated with storage is large, see
Fig. 3. Furthermore, internal resistance at large and smallSoCs is higher, meaning that cycling in these regions result in higher Ohmic heat generation and therefore higher battery temperatures.
In the scenario considered here, charging occurs opportunisti-cally, meaning that the vehicle is charged as soon as it arrives at home. In a scenario ofjust in time charging,where the initialSoC is maintained and charging is delayed up to a point just before the driver requires the use of the vehicle (usually estimated), the
Energy arbitrage
Slow
charging
Storage
[image:10.595.126.463.74.217.2]Renewable
[image:10.595.34.283.269.588.2]Fig. 8.Illustration of the V2G topology proposed in this work. Renewable energy is stored in a cheap, efficient storage device and trickle charged to the vehicle overnight. The clean energy is then sold to commercial building during peak times. The balance of energy required to power commercial vehicles, homes and in some instances the car comes from the grid.
[image:10.595.297.550.274.568.2]Fig. 9.Algorithm employed by the connected smart-grid and BMS in assessing the level of V2G services to provide.
Fig. 10.Showing modelled capacity fade and resistance rise (c.f., Equations(2) and (3)) as a function of capacity consumed in driving mode (DSoCDrive) and V2G (DSoCV2G)
results are expected to be more pronounced[45].
5. Using a smart car park for load levelling energy demand of a commercial building
5.1. Electricity demand for the international digital laboratory
The International Digital Laboratory (IDL) is four story office building located on the University of Warwick campus near Coventry. The University is situated in the centre of England, adjacent to the city of Coventry and on the border with Warwick-shire. The building compromises of a 100-seater auditorium, two electrical laboratories, a boardroom, 3 teaching laboratories, eight meeting rooms and houses approximately 360 researchers and administration staff. The buildings electricity demand is in excess of 0.8 GWh/year, with a daily typical consumption of 2.2 MWh/day, resulting in a total spend on electricity of around£82 k p.a. The electricity demand for a week in July 2016 is shown inFig. 12with a visible reduction in energy demand during weekends from week-days. Electricity demand peaks between 6.30am and 9pm on weekdays with a smaller embedded peak at 7e9pm likely to be
associated with the use of kitchen facilities. The average daily po-wer demand for the building is 93 kW.
In 2015/2016 the average cost of electricity payed by the Uni-versity of Warwick was 10p/kWh though this doesn't take into consideration Triads. The average UKEconomy 7cost of electricity was 7p/kWh[46]. This means, as concluded by Koh et al.[41], there are strong financial incentives for clean energy arbitrage with commercial buildings such as the IDL.
5.2. Load levelling and battery degradation results
There are 54 car parks on the University of Warwick campus (including bay parking zones) with an approximate total capacity of 5560 car parking spaces. It is assumed that 120 of the maximum possible 5560 cars on campus are electric vehicles (approximately 2.1%, in line with the estimated UK market share for EVs in 2016[2]) that can be connected to the universities electricity network. These cars are parked in one of four carparks that are in the vicinity of the IDL with a total capacity of 1721 car parking bays. To consider the high variability of the different participants (i.e. EVs), it is funda-mental to take into account the varying battery capacities at the
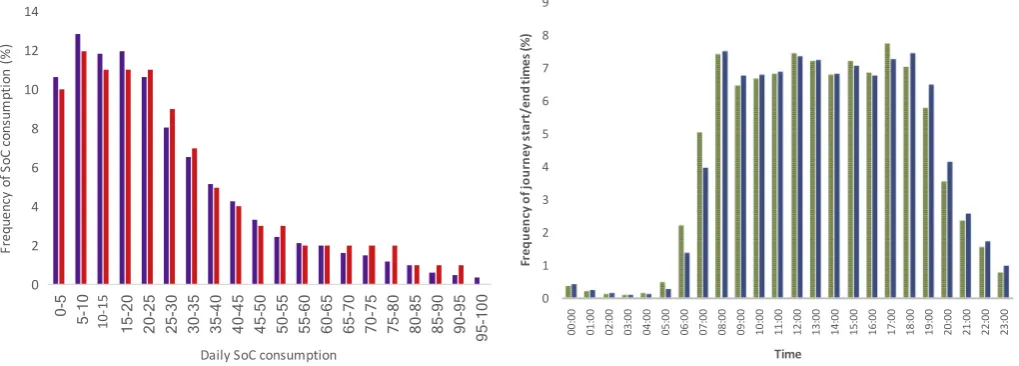
point of connection to the universities electricity network related to the varying SoC consumption of driving to work. For a represen-tative distribution, we mimic the
D
SoCDriveadopted in thesimula-tion with daily SoC consumpsimula-tion from data from the Ultra-Low Carbon Vehicle Demonstrator Programme (ULCVDP) [47] which trialed 349 EVs, PHEVs and FCEVs for over 276,000 individual trips covering over 1.5 million miles, seeFig. 11. Journey start and end times in the ULCVDP data set highlights a similar distribution of journey start and end times suggesting single journeys are typically short. The morning peak for journey start times was at 8am and the evening peak for journey end times was 5pm; over 70% of journeys started and ended between 8am and 5pm[47].
Using the representative, distributed data presented inFig. 11
and assuming an ambient temperature for Coventry of 18C, we study the impact V2G can have for load levelling IDLs power de-mand shown inFig. 12and simultaneously extending participant EVs battery service life where applicable (i.e., reduce CF an PF) through the routine presented in Fig. 9. For this case study we consider that each car has a 30 kWh battery comprising 50 cells in parallel and 50 in series, which is representative of EVs currently on the market today.
The results for load levelling of IDLs power demand using the smart-grid algorithm is shown inFig. 12. Each car supplies the grid with energy, provided that doing so does not further degrade the battery and up to a level which minimises degradation of each EVs battery. Since energy demand is only provided in 30-min time bins and the ULCVDP data suggests the morning peak for journey start times is 8am, the earliest time at which an EV can connect to the universities electricity network is assumed to be 8.30am. Hence, the demand peak on weekdays that commences at 6.30am cannot be suppressed until 8.30am. For the week depicted inFig. 12, EVs provide 2.8 MWh of energy; assuming the same level of network support for every week in the year, this equates to 0.145 GWh of annual clean energy support which is just over 18% of IDLs annual energy demand.
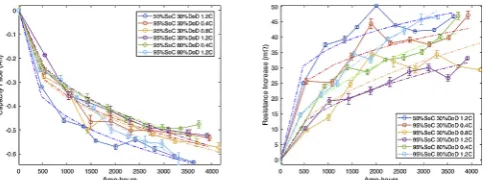
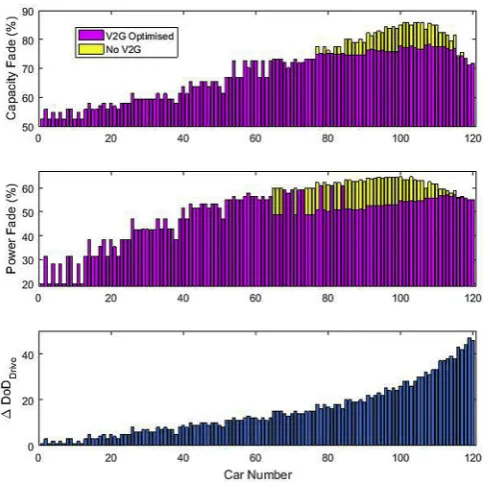
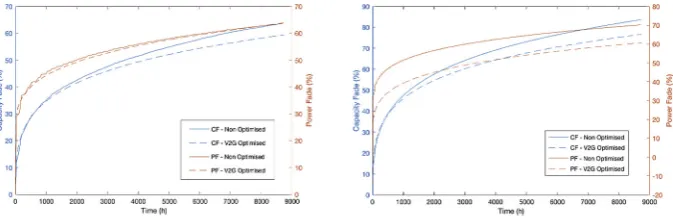
Of the 120 EVs connected to the electricity network only 46 participated in V2G; 74 are excluded because the smart-grid esti-mated that for those EVs V2G will degrade the battery more than if they were left idle. The capacity fade and power fade after 1 year of cycling for each of the 120 EVs is shown inFig. 13; the smart-grid algorithm was able to reduce capacity fade by up to 9.1% and po-wer fade by up to 12.1%.
[image:11.595.49.559.69.252.2]0 1 2 3 4 5 6 7 8 9 00: 00 01: 0 0 02: 0 0 03: 0 0 04: 0 0 05: 0 0 0 6 :0 0 07: 00 08: 0 0 09: 0 0 10: 0 0 11: 0 0 12: 0 0 1 3 :0 0 14 :0 0 15 :0 0 1 6 :0 0 1 7 :0 0 1 8 :0 0 1 9 :0 0 2 0 :0 0 21 :0 0 22 :0 0 23: 0 0 Fr e q u en cy o f jo u rn ey st ar t/ e n d ti m es (% ) Time
6. Discussion
6.1. Savings yielded by smart grid algorithm
For the scenario considered in this work, smart-grid algorithm was able to reduce capacity fade by up to 9.1% and power fade by up to 12.1% which is significantly larger than the estimated maximum transient error in CF and PF arising from the ageing model of 3% and 7% respectively. The minimisation of CF and PF is equivalent to a saving of $555 for a single EV owner over the year, assuming a
battery replacement cost of circa: $200/kWh[48].
6.2. Comparison of results to a case when the battery is only charged when it is close to depletion
In this work we assumed a particular driver behavior, namely that drivers recharge their vehicles to 100% every night. Data from ULCVDP however suggests that, on average, EVs were placed on charge 3.5 times per week, i.e., once every two days. More inter-estingly, the study found that as drivers gradually became more confident they began to undertake more journeys between charge events such that the distance travelled between charging steadily rose by an average of 15%[47]. Therefore, in order to further con-textualise our results, we use the battery degradation model to estimate CF and PF if an EV is only charged when the battery is close to depletion (SoC<
D
SoCDrive). ForD
SoCDrive of 7% and 15%ewhichcorresponds to the ULCVDP average daily consumption[47]and the value inFig. 13resulting in the maximum battery lifetime extension respectively e the CF is 4.4% and 7% and PF is 0% and 9.5%
respectively shown in Fig. 14. This is equivalent to a monetary saving in thefirst year of $201 and $436 for
D
SoCDriveof 7% and 15%,respectively.
6.3. The effect of colder ambient temperatures
An ambient temperature of 18C corresponding to the annual average temperature of Coventry was assumed in this work. With this environmental condition, CF dominates£degcompared with PF, as suggested byFig. 13. In colder climates or in usage cycles where large charging currents are applied at high SoCs, ion dynamics at the electrode-electrolyte boundary are hindered and lithium plating is energetically favourable. Under such conditions, PF is likely to dominate CF as illustrated inFig. 7(Cycle 1). Given that different extremes of ambient temperature degrade the battery in different ways [23], the optimal battery state which minimises battery degradation will vary with ambient temperature; the bat-tery degradation model presented in this work is able to address this issue.
6.4. The applicability of C6/LiNiCoAlO2technologies
A central concept of the smart-grid proposed in this work is its ability to accurately estimate battery degradation. The ageing model, based on afirst order ECM, can predict CF and PF to less than 10% error; less than 5% when the usage cycles are within the re-strictions of the parametrisation data set. The ageing model pre-sented and validated in Section 2 pertains to a commercially available C6/LiNiCoAlO2battery. The NCA battery chemistry is used in the Toyota RAV4 Hybrid, VW e-golf, VW e-up, Mercedes Smart for two electric drive and the Tesla roadster, model S and model X. While the C6/LiNiCoAlO2 battery technology is established for electric powertrain applications, there are other commercial intercalation materials such as lithium cobalt oxide (LCO), lithium nickel cobalt manganese oxide (NCM), lithium iron phosphate (LFP) and lithium titanium oxide (LTO) that exist on the market. Although the ageing model presented in this work is able to provide an approximation of degradation for these alternative technologies, a confident quantitative valuation for CF and PF with an acceptable level of error requires re-parametrisation using original data.
6.5. Further work
[image:12.595.38.281.67.235.2]As mentioned in the previous subsection, the cell employed in this work was a 3 Ah C6/NCA cell which is one of many battery technologies that exists on the market. To consider the high Fig. 12.Depicting the grid electricity demand for the IDL for a week in July 2016 (blue)
compared with the grid demand when including V2G using the smart grid algorithm (red). Thefirst 24-h period begins at 00:00 Monday 25th July 2016. (For interpretation of the references to colour in thisfigure legend, the reader is referred to the web version of this article.)
Fig. 13.Results for V2G optimised and non-V2G optimised capacity fade (top panel) and power fade (middle panel) for all 120 EVs connected to the university electricity network. The yellow bars highlight the potential lifetime savings by utilising the smart-grid algorithm. The bottom panel shows theDSoCDriveattributed to each car,
[image:12.595.38.282.307.548.2]variability of the different participant electric vehicles, it is bene-ficial to expand the scope of the experimental study to encompass a greater number of cells of various types, manufacturers and chemistries. Furthermore, in any subsequent testing, it is beneficial to increase the range of ambient temperatures considered for the ageing cycling tests, thereby expanding the boundaries of the parametrisation data set and subsequently lowering model errors at extreme temperatures.
While the battery ageing model developed in this work was adequate in quantifying the benefit of smart grid V2G, the open loop model can be further developed by including an additional feedback loop for an online application. This is expected to reduce error in CF and PF and assist the convergence of prediction and measurement.
A central concept of this work has been the information transfer between the smart-grid and the BMS. Such a communication sys-tem does not exist today. With the increased realisation of Coop-erative Intelligent Transport Systems around the world however
[49], the regulations and methods for integrating a vehicle to the road and parking infrastructure already exists. In future work, we will develop a small-scale pilot study on integrating the BMS with a smart-grid car park.
7. Conclusion
As the market penetration of EVs increases, the impact on an already over-burdened energy distribution network will become more significant. V2G technologies allow vehicles equipped with high capacity bi-directional charging systems to facilitate ancillary services such as frequency regulation and load balancing through the use of their on-board batteries, thereby alleviating some of the burden placed on the electricity network. In this paper, the eco-nomic viability of EVs supporting the electricity grid has been addressed, particularly considering the associated issues of battery degradation. As such, in this work we developed a comprehensive battery degradation model based on long-term ageing data for a commercial C6/LiNiCoAlO2battery. The model was validated using six operationally diverse real-world usage cycles and shows an average maximum transient error of 4.6% in capacity loss estimates and 5.1% in resistance rise estimates for over a year of cycling. The ageing model was used to study several cases of V2G scenarios with varying consumption of driving mode SoC (
D
SoCDrive) and V2G SoC (D
SoCV2G) which showed afixed range ofD
SoCDriveandD
SoCV2G that can extend the life of the EV beyond the case in which there is no V2G. This effective “degradation reversing”D
SoCDrive andD
SoCV2Grange arises through the optimal balancing of storage and cycling degradation.This result has motivated further investigations into the possi-bility of maximizing battery SoH by utilising an integrated smart grid to manipulate the EVs operational conditions before V2G op-erations commence. The authors have studied how the optimal range of
D
SoCDriveandD
SoCV2Gcan be harnessed to extend the life of the EV battery system. An integral part of this type of smart grid system is the ability to predict and quantify battery degradation. In this work, it is assumed that the smart grid interacts with the vehicle BMS to calculate the energy and power available from the vehicle and the operational condition of the battery which mini-mises degradation.The smart-grid algorithm was used to investigate a case study of the electricity demand for the University of Warwick IDL building. Simulation results suggest that the smart-grid formulation is able to reduce the EVs' battery pack capacity fade by up to 9.1% and power fade by up to 12.1% within the context of the grid topology considered or if the EV is charged to 100% daily. In comparison, if the EV is charged only when the battery is close to depletion, the smart grid optimisation was able to reduce capacity fade by 4.4% and power fade by 9.5%. In conclusion, we show that an EV con-nected to this smart-grid system can accommodate the demand of the power network with an increased share of clean renewable energy, but more profoundly that the smart grid is able to extend the life of the EV battery beyond the case in which there is no V2G.
Acknowledgment
This research was supported by EPSRC grants (EP/M507143/1) and (EP/N001745/1), the WMG Centre High Value Manufacturing Catapult (funded by Innovate UK) in partnership with Jaguar Land Rover (JLR) and Warwick Research Development Fund Develop-ment Award. The authors thank Julie Chevalier (JLR) for her part in collecting the ageing data. The authors also thank Cenex for the provision of the ULCVDP data used in this paper, provided as part of the Ebbs and Flows of Energy Systems project (part funded by Innovate UK).
References
[1] Baranzini A, Weber S, Bareit M, Mathys NA. The causal relationship between energy use and economic growth in Switzerland. Energy Econ 2013;36: 464e70.
[2] Diefenderfer J, Vipin Arora M, Singer LE. International energy outlook 2016 liquid fuels. 2004. p. 202e586.
[3] Soytas U, Sari R. Energy consumption, economic growth, and carbon emis-sions: challenges faced by an EU candidate member. Ecol Econ 2009;68(6): 1667e75.
[4] Bull SR. Renewable energy today and tomorrow. Proc IEEE 2001;89(8): 1216e26.
[image:13.595.135.472.65.174.2]measures to enable high levels of variable renewable electricity. Renew Sus-tain Energy Rev2015;45:785e807.
[6] Tan KM, Ramachandaramurthy VK, Yong JY. Integration of electric vehicles in smart grid: a review on vehicle to grid technologies and optimization tech-niques. Renew Sustain Energy Rev 2016;53:720e32.
[7] Guille C, Gross G. A conceptual framework for the vehicle-to-grid (V2G) implementation. Energy Policy 2009;37(11):4379e90.
[8] Kempton W, Tomic J. Vehicle-to-grid power implementation: from stabilizing the grid to supporting large-scale renewable energy. J Power Sources 2005;144(1):280e94.
[9] Kempton W, Tomic J. Vehicle-to-grid power fundamentals: calculating ca-pacity and net revenue. J Power Sources 2005;144(1):268e79.
[10] Kempton W, Udo V, Huber K, Komara K, Letendre S, Baker S, et al. A test of vehicle-to-grid (V2G) for energy storage and frequency regulation in the PJM system results from an industry-university research partnership. 2008. [11] Han Sekyung, Han Soohee, Sezaki K. Development of an optimal
vehicle-to-grid aggregator for frequency regulation. IEEE Trans. Smart Grid Jun. 2010;1(1):65e72.
[12] Wang Zhenpo, Wang Shuo. Grid power peak shaving and valleyfilling using vehicle-to-grid systems. IEEE Trans Power Deliv Jul. 2013;28(3):1822e9. [13] White CD, Zhang KM. Using vehicle-to-grid technology for frequency
regu-lation and peak-load reduction. J Power Sources 2011;196(8):3972e80. [14] Divya KC, Østergaard J. Battery energy storage technology for power
sys-temsdan overview. Electr Power Syst Res 2009;79(4):511e20.
[15] Lund H, Kempton W. Integration of renewable energy into the transport and electricity sectors through V2G. Energy Policy Sep. 2008;36(9):3578e87. [16] Peterson SB, Whitacre JF, Apt J. The economics of using plug-in hybrid electric
vehicle battery packs for grid storage. J Power Sources 2010;195(8):2377e84. [17] Uddin K, Picarelli A, Lyness C, Taylor N, Marco J. An accusal Li-ion battery pack
model for automotive applications. Energies 2014;7(9):5675e700. [18] Lunz B, Walz H, Sauer DU. Optimizing vehicle-to-grid charging strategies
using genetic algorithms under the consideration of battery aging. In: 2011 IEEE vehicle power and propulsion conference; 2011. p. 1e7.
[19] Vetter J, Novak P, Wagner MR, Veit C, M €oller K-C, Besenhard JO, et al. Ageing mechanisms in lithium-ion batteries. J Power Sources 2005;147(1):269e81. [20] Bashash S, Moura SJ, Forman JC, Fathy HK. Plug-in hybrid electric vehicle
charge pattern optimization for energy cost and battery longevity. J Power Sources 2011;196(1):541e9.
[21] Marongiu Andrea, Roscher Marco, Sauer Dirk Uwe. Influence of the vehicle-to-grid strategy on the aging behavior of lithium battery electric vehicles. Appl Energy 2015;137:899e912.
[22] Schmalstieg J, K€abitz S, Ecker M, Sauer DU. A holistic aging model for Li(NiMnCo)O2 based 18650 lithium-ion batteries. J Power Sources Jul. 2014;257:325e34.
[23] Uddin K, Perera S, Widanage W, Somerville L, Marco J. Characterising lithium-ion battery degradatlithium-ion through the identificatlithium-ion and tracking of electro-chemical battery model parameters. Batteries, vol. 2, no. 2. Multidisciplinary Digital Publishing Institute; 26-Apr. p. 13.
[24] Schmidt AP, Bitzer M, Imre AW, Guzzella L. Experiment-driven electro- chemical modeling and systematic parameterization for a lithium-ion battery cell. J Power Sources 2010;195(15):5071e80.
[25] Santhanagopalan S, Guo Q, White RE. Parameter estimation and model discrimination for a lithium-ion cell. J Electrochem Soc 2007;154(3):A198. [26] Ploehn HJ, Ramadass P, White RE. Solvent diffusion model for aging of
lithium-ion battery cells. J Electrochem Soc 2004;151(3):A456.
[27] Pinson MB, Bazant MZ. Theory of SEI formation in rechargeable batteries: capacity fade, accelerated aging and lifetime prediction. J Electrochem Soc Dec. 2012;160(2):A243e50.
[29] Fu R, Xiao M, Choe S-Y. Modeling, validation and analysis of mechanical stress
generation and dimension changes of a pouch type high power Li-ion battery. J Power Sources 2013;224:211e24.
[30] Savoye F, Venet P, Millet M, Groot J. Impact of periodic current pulses on Li-Ion battery performance. IEEE Trans Ind Electron Sep. 2012;59(9):3481e8. [31] Abraham D, Liu J, Chen C, Hyung Y, Stoll M, Elsen N, et al. Diagnosis of power
fade mechanisms in high-power lithium-ion cells. J Power Sources 2003;119: 511e6.
[32] Ng KS, Moo C-S, Chen Y-P, Hsieh Y-C. Enhanced coulomb counting method for estimating state-of-charge and state-of-health of lithium-ion batteries. Appl Energy 2009;86(9):1506e11.
[33] Hu X, Li S, Peng H. A comparative study of equivalent circuit models for Li-ion batteries. J Power Sources 2012;198:359e67.
[34] Pastor-Fern Andez C, Bruen T, Widanage WD, Gama-Valdez MA, Marco J. A study of cell-to-cell interactions and degradation in parallel strings: im-plications for the battery management system experimental evaluation. 2016. [35] Bloom I, Cole B, Sohn J, Jones S, Polzin E, Battaglia V, et al. An accelerated calendar and cycle life study of Li-ion cells. J Power Sources 2001;101(2): 238e47.
[36] Liaw BY, Roth EP, Jungst RG, Nagasubramanian G, Case HL, Doughty DH. Correlation of Arrhenius behaviors in power and capacity fades with cell impedance and heat generation in cylindrical lithium-ion cells. J Power Sources Jun. 2003;119e121:874e86.
[37] Wright R, Motloch C, Belt J, Christophersen J, Ho C, Richardson R, et al. Cal-endar- and cycle-life studies of advanced technology development program generation 1 lithium-ion batteries. J Power Sources Aug. 2002;110(2):445e70. [38] Smith K, Earleywine M, Wood E, Neubauer J, Pesaran A. Comparison of plug-in hybrid electric vehicle battery life across geographies and drive cycles. 2012. [39] Taylor J, Ball R, McGordon A, Uddin K, Marco J. Sizing tool for rapid optimi-sation of pack configuration at early-stage automotive product development. 2015.
[40] Quinn C, Zimmerle D, Bradley TH. The effect of communication architecture on the availability, reliability, and economics of plug-in hybrid electric vehicle-to-grid ancillary services. J Power Sources 2010;195(5):1500e9. [41] Koh SL, Lim YS. Methodology for assessing viability of energy storage system
for buildings. Energy 2016;101:519e31.
[42] Department of Energy&Climate Change. Sub-national electricity and gas consumption statistics Region, Local Authority, middle and lower layer super output area. 2014.
[43] Luo X, Wang J, Dooner M, Clarke J. Overview of current development in electrical energy storage technologies and the application potential in power system operation. Appl Energy 2015;137:511e36.
[44] Lund H, Andersen AN, Østergaard PA, Mathiesen BV, Connolly D. From elec-tricity smart grids to smart energy systems e a market operation based approach and understanding. Energy Jun. 2012;42(1):96e102.
[45] Smith K, Earleywine M, Wood E, Neubauer J, Pesaran A. Comparison of plug-in Hybrid electric vehicle battery life across geographies and drive cycles. 2012. [46] Department of Energy &Climate Change. Annual domestic energy bills
-statistical data sets - GOV.UK. 2016.
[47] Burgess M, Harris M, Walsh C, Carroll S, Mansbridge S, King N, et al. Assessing the viability of electric vehicles in daily life: a longitudinal assessment (2008e2012). In: 2013 world electric vehicle symposium and exhibition (EVS27); 2013. p. 1e5.
[48] Nykvist B, Nilsson M. Rapidly falling costs of battery packs for electric vehicles. Nat Clim Change Mar. 2015;5(4):329e32.
[49] Alexander P, Haley D, Grant A. Cooperative intelligent transport systems: 5.9-GHzfield trials. Proc IEEE Jul. 2011;99(7):1213e35.