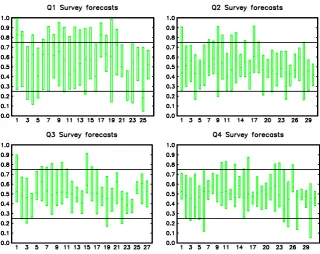
Probability distributions or point predictions? Survey forecasts of US output growth and inflation
Full text
Figure


Related documents
To investigate the phenomenon of natural recovery and to verify its success among pathological gamblers, I reviewed and compared two national studies: the Gambling Impact and
3. Therefore, based on what was said, spending leisure time has both individual and social consequences. In fact, this sector is as significant as other sectors like education
The aim of this paper is to describe the study design and implementation, sample characteristics, and treat- ment completion rates for the conventional and im-
Hunhu/Ubuntu philosophy thus acquaints an African and international audience with suitable local views and ideas on perspectives o f education that can guide
Figure 5.7: Connection latency for single connection for connection from audio IP to memory Setup MPEG 3x2 (128) tlT flitclocks 2x63;4x84;6x255 Load at probes MB/s
Enlarge page viewing for easy reading - “Zoom” option?. A lot of us have problems reading the small fonts of most web pages… but there is an easy and
7.6.3.2 The Head of the relevant HKEx Division/Department, LME’s Company Secretary or LMEC’s Company Secretary where the to-be disclosed matter, development or event is identified
