Original citation:
Bartling, Björn, Brandes, Leif and Schunk, Daniel. (2015) Expectations as reference points : field evidence from professional soccer. Management Science, 61 (11). 2646 -2661.
Permanent WRAP URL:
http://wrap.warwick.ac.uk/69990
Copyright and reuse:
The Warwick Research Archive Portal (WRAP) makes this work by researchers of the University of Warwick available open access under the following conditions. Copyright © and all moral rights to the version of the paper presented here belong to the individual author(s) and/or other copyright owners. To the extent reasonable and practicable the material made available in WRAP has been checked for eligibility before being made available.
Copies of full items can be used for personal research or study, educational, or not-for-profit purposes without prior permission or charge. Provided that the authors, title and full
bibliographic details are credited, a hyperlink and/or URL is given for the original metadata page and the content is not changed in any way.
Publisher’s statement:
http://dx.doi.org/10.1287/mnsc.2014.2048
A note on versions:
The version presented here may differ from the published version or, version of record, if you wish to cite this item you are advised to consult the publisher’s version. Please see the ‘permanent WRAP URL’ above for details on accessing the published version and note that access may require a subscription.
Expectations as Reference Points:
Field Evidence from Professional Soccer
∗Bj¨orn Bartling† Leif Brandes‡ Daniel Schunk§
July 19, 2014
Abstract
We show that professional soccer players and their coaches exhibit reference-dependent behavior during matches. Controlling for the state of the match and for unobserved heterogeneity, we show on a minute-by-minute basis that players breach the rules of the game, measured by the referee’s assignment of cards, significantly more often if their teams are behind the expected match outcome, measured by pre-play betting odds of large professional bookmakers. We further show that coaches implement significantly more offensive substitutions if their teams are behind expectations. Both types of behaviors impair the expected ultimate match outcome of the team, which shows that our findings do not simply reflect fully rational responses to reference-dependent incentive schemes of favorite teams to falling behind. We derive these results in a data set that contains more than 8’200 matches from 12 seasons of the German Bundesliga and 12 seasons of the English Premier League.
Keywords: reference points, expectations, experience, high stakes, competition JEL classification: C23, D03, D81, D84
∗
We would like to thank excellent referees, the associate editor, the department editor, and seminar and conference participants at the University of Zurich, the Economic Science Association World Meeting in Copenhagen 2010, the Nordic Conference on Behavioral and Experimental Economics in Helsinki 2010, the International Meeting on Experimental and Behavioral Economics in Barcelona 2011, the Royal Economic Society Meeting in London 2011, the Thurgau Experimental Economics Meeting on reference-dependent preferences in Kreuzlingen 2013 for very helpful comments and suggestions. Tizoc Jos´e Bachmann, Nicolai Gr¨uter, and Stefan Schmid provided excellent research assistance.
†
Bj¨orn Bartling, Department of Economics, University of Zurich, Bl¨umlisalpstrasse 10, 8006 Zurich, Switzerland, e-mail: [email protected]
‡
Leif Brandes, Warwick Business School, University of Warwick, Coventry, CV4 7AL, UK, e-mail:
§
1
Introduction
Understanding the determinants and behavioral effects of reference points is an active area of
research. The key idea is that a person’s assessment of an outcome is determined not only by the
outcome itself but also by how the outcome compares to a reference point (Kahneman and Tversky
(1979)). An important open question in the literature is what determines the reference point. A
growing number of theoretical contributions (e.g., Bell (1985), Loomes and Sugden (1986), Gul
(1991), K¨oszegi and Rabin (2006, 2007, 2009)) model reference points as shaped by expectations.
Direct tests of these ideas using field data are however difficult because “expectations are hard to
observe in the field” (Abeler et al. (2011), p. 470). In this paper, we report on a unique and large
panel field data set that allows exactly this: to observe (i) an exact quantitative measure of people’s
ex-ante expectations, (ii) the current state of the world relative to the ex-ante expectation, and (iii)
objective measures of behavior over time.
Empirical evidence on reference points and their behavioral consequences is of value for
eco-nomics in general and for managerial decision making in particular. Consider the impact of
ref-erence points on worker morale and effort choices. Bewley (1999) provides evidence from
inter-views with business executives, labor leaders, and professional recruiters that workers compare
current earnings to previous earnings and that wage cuts undermine work morale. This suggests
that previous earnings serve as an expectation-based reference point for current earnings, and
that workers dislike falling short of this reference point. Analyzing the relationship between pay
raises, expectations, and performance, Mas (2006) finds that in the months after New Jersey police
officers lose in final offer arbitration over salary demands, arrest rates and average sentence length
decline, and crime reports rise relative to when they win. Ockenfels et al. (forthcoming)
investi-gate how bonus payments affect managers’ satisfaction and performance in a large, multinational
company. They show that bonus payments falling short of individually assigned bonus targets—a
likely expectation-based reference point—reduce work satisfaction and performance.
Despite the importance of reference points in the literature, field evidence on the determinants
of reference points and on their influence on behavior is still relatively scarce.1 In this paper,
1
we use a data set from two leading soccer leagues, the German Bundesliga and the British
Pre-mier League, to show that the behavior of professional soccer players and coaches during matches
depends significantly on whether or not their team is behind the expected match outcome.
Profes-sional bookmakers’ pre-play betting odds on match outcomes allow us to construct a measure of
expectations. Our first behavioral outcome variable is the players’ breaches of the rules of the game,
such as fouling a player of the opposing team, measured by “cards,” which are shown for irregular
behavior to individual players by highly trained, impartial referees. The underlying motivations
for such irregular behavior can be manifold: cards may reflect a more risky or aggressive way of
playing, increased effort, or it may be that players engage in sabotage of the opponent’s effort. Our
second behavioral outcome variable is the coaches’ strategic adjustments that are implemented by
means of player substitutions during a match. Such adjustments may reflect risk taking behavior
by coaches, as substituting, say, a defender with a striker increases the probability of scoring a goal
but also increases the probability of receiving one.
We show that players receive significantly more cards per minute if their team is behind
expec-tations (e.g., the team is behind by one goal but the pre-play expectation was to win the match)
than if their team is not behind expectations (e.g., the team is behind by one goal and the pre-play
expectation was indeed to be defeated). This finding holds while we control for the state of the
match (e.g., the goal difference and the minute of play) as well as for unobserved match and team
specific heterogeneity. The size of the effect is considerable: players of a team that is behind the
expected match outcome receive 14 percent more cards per minute than players of a team that
is not behind expectations. Moreover, we show that coaches implement offensive strategy
adjust-ments by means of substitutions (they substitute, say, a midfielder with a striker rather than a
midfielder with another midfielder) significantly more often if their teams are behind expectations
than if their teams are not behind expectations, controlling for the state of the match as well as for
match and team specific effects. The size of the effect is again large: the probability of an offensive
substitution in a given minute more than doubles. These findings lend support to the idea that
expectations shape reference points and that people’s behavior depends on how a given outcome
contrasts with this reference point.
Importantly, we conduct a productivity analysis to address the possibility that our findings
simply reflect fully rational responses to reference-dependent incentive schemes of favorite teams
to falling behind. If this was the case, players of unexpectedly losing teams should play in a way
that leads to more cards and their coaches should implement a more offensive strategy of play.
However, we find that both receiving more cards and substituting players in an offensive way while
being behind expectations worsen the expected ultimate match outcome. Moreover, we analyze
the reasons for card assignments and find that reasons related to overreaction and aggression, such
as “violent conduct,” account for a much larger share in the loss frame (i.e., when a team is behind
expectations) than out of the loss frame. This latter finding provides additional evidence that the
observed behavioral pattern is not entirely driven by rational responses of favorite teams to being
behind.
Overall, our study thus provides evidence for a model of reference-dependent preferences where
being in a loss frame is “psychologically different” from not being in a loss frame. In particular,
players and coaches might feel pressure or frustration when being behind expectations, which can
manifest itself in different and potentially not entirely rational behaviors.
A much related paper is Card and Dahl (2011) who show the effect of unexpected emotional
cues, such as the unexpected loss of an NFL football team, on domestic violence. They find that a
10 percent increase in the rate of at-home violence by men against their women results when their
team loses a match while it was predicted to win by some margin. Similar to our paper, Card and
Dahl use betting market data to infer expected match outcomes. Our paper is however different in
that we analyze behavior by players and coaches during matches, i.e., behavior that can influence
the state of being in a loss frame, while Card and Dahl analyze violent and futile reactions to
unchangeable facts.
Also related to our paper is Pope and Schweitzer (2011) who analyze professional golfers’
perfor-mance.2 They find that golfers are significantly influenced by the reference point that is provided by
“par,” the typical number of strokes that a professional golfer takes to complete a hole. Our paper
is different because the betting odds data provide a measure of every single team’s expectation in
every single match, while par (or the average score on a hole, which might differ from par) not
2
One reason for the increasing usage of sports data sets in economic research is that they provide statistics that “are much more detailed and accurate than typical microdata samples” (Kahn 2000, p. 75). Other examples include
necessarily coincides with an individual golfer’s expectation in a given tournament.3
2
Data
Our data contains information on all 3’672 matches in the German Bundesliga (henceforth BL) in
the 12 seasons from 1998/99 to 2009/10 and on all 4’560 matches in the English Premier League
(henceforth PL) in the 12 seasons from 2000/01 to 2011/12.4 For each match, we have detailed
minute-by-minute information on goals, cards, and substitutions. For cards, we do not only know
the team and minute but also the reason, such as, e.g., “violent conduct” or “deliberate handball.”
For substitutions, the data contain not only the team and minute but also the strategic component,
i.e., whether, say, a midfielder was substituted with a midfielder (strategically neutral substitution)
or with a striker (offensive substitution).5
To quantify the offensiveness of substitutions, we construct a “strategy adjustment measure.”
In soccer, there exist four categories of players: strikers, midfielders, defenders, and goal keepers.
Strikers are the most offensive type of player, so we assign them a value of 4. Midfielder, defenders,
and goal keepers are assigned the values 3, 2, and 1, respectively. We define our strategy adjustment
measure as the category value of the incoming player minus the category value of the outgoing
player. For example, the measure takes on value 0 if a striker comes for another striker, it is +1 if a
midfielder comes for a defender, and it is -2 if a defender comes for a striker. A substitution is thus
classified as “offensive” if and only if the measure is strictly positive, and the higher the measure,
the higher the offensiveness of a substitution.
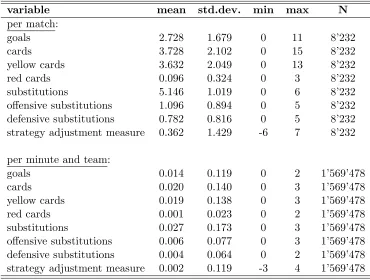
Table I contains summary statistics for goals, cards (yellow and red cards combined), yellow
cards, red cards, substitutions, and the strategy adjustment measure; all statistics are reported on
the match level and on the minute and team level. Altogether, 22’460 goals were scored, 30’694
cards were shown, and 42’359 substitutions were made. The average number of goals per match
3
Further related papers on reference-dependent behavior in the field include Camerer et al. (1997), Farber (2005), Farber (2008), Crawford and Meng (2011), Fehr and Goette (2007), and Gneezy et al. (2014).
4Background information on soccer and on the two leagues is provided in Appendix A. 5
is 2.73, which corresponds to 0.014 goals per minute per team. We find red cards to be very rare
events relative to yellow cards. On the match level, the average number of yellow and red cards is
3.63 and 0.10, respectively. The average number of substitutions per match is 5.15. On average,
about 1.1 of these 5 substitutions are offensive and about 0.8 are defensive. On the minute and team
level this corresponds to 0.027 substitutions, of which 0.006 are offensive and 0.004 are defensive.
The average values of the strategic adjustment measure are 0.362 on the match level and 0.002 on
the minute and team level, i.e., coaches tend to implement a more offensive strategy over the course
[image:7.612.120.490.273.553.2]of a match on average.
Table I: Summary Statistics
variable mean std.dev. min max N
per match:
goals 2.728 1.679 0 11 8’232
cards 3.728 2.102 0 15 8’232
yellow cards 3.632 2.049 0 13 8’232
red cards 0.096 0.324 0 3 8’232
substitutions 5.146 1.019 0 6 8’232
offensive substitutions 1.096 0.894 0 5 8’232
defensive substitutions 0.782 0.816 0 5 8’232
strategy adjustment measure 0.362 1.429 -6 7 8’232
per minute and team:
goals 0.014 0.119 0 2 1’569’478
cards 0.020 0.140 0 3 1’569’478
yellow cards 0.019 0.138 0 3 1’569’478
red cards 0.001 0.023 0 2 1’569’478
substitutions 0.027 0.173 0 3 1’569’478
offensive substitutions 0.006 0.077 0 3 1’569’478
defensive substitutions 0.004 0.064 0 2 1’569’478
strategy adjustment measure 0.002 0.119 -3 4 1’569’478
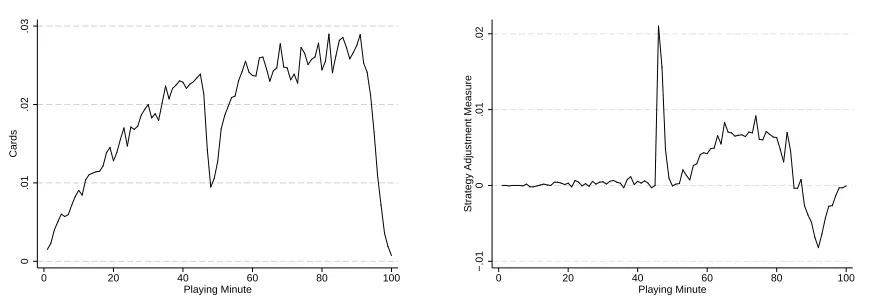
Our two behavioral outcome variables are the cards that players receive and the strategy
adjust-ment measure that is determined by the substitutions that coaches impleadjust-ment. Figure I shows the
dynamics of the per-minute average of these two outcome variables over the course of the match.
The left panel shows the average number of cards per minute over time. It can be seen that the
number of cards substantially increases over the course of a match. Only around half-time there
minutes of matches with very much injury time. There are relatively few observations for matches
with very long injury time. Only 16 percent of matches last longer than 97 minutes, 7 percent last
[image:8.612.91.526.163.315.2]longer than 98 minutes, and 3 percent last longer than 99 minutes.
Figure I: Dynamics of Cards and Strategy Adjustment Measure
0
.01
.02
.03
Cards
0 20 40 60 80 100 Playing Minute
−.01
0
.01
.02
Strategy Adjustment Measure
0 20 40 60 80 100 Playing Minute
Notes: The left panel shows the average number of cards per minute over time. The right panel shows the average of the strategy adjustment measure per minute over time.
The right panel of Figure I shows the average of the strategy adjustment measure per minute
over time. It can be seen that on average virtually no strategy adjustments are made in the first half
of the match. However, coaches tend to make offensive substitutions right after the break, a natural
point in time where many substitutions are made in general. The second half then sees a tendency
towards a more offensive strategy, followed by a pronounced shift towards a more defensive strategy
as the end of the match approaches.
In addition to our data on match events, we collected pre-play betting odds from professional
bookmakers for each match in our sample. These data allow us to derive ex-ante expectations
of match outcomes. For the BL, we (mainly) use the betting odds of the German bookmaker
ODDSET, one of the largest state-run betting providers in Europe. For the PL, we (mainly) use
the betting odds of Interwetten, one of the leading providers of online betting worldwide.6 As an
example, consider the match between Hannover 96 and Mainz 05 from November 5, 2005. The
odds from ODDSET for Hannover 96 winning, Mainz 05 winning, and tie, were 1.70, 3.50, and
6
We obtained the betting odds for the BL upon request directly from ODDSET (www.oddset.de).
ODD-SET betting odds are however unavailable for the 1998/1999 season, and we used betting odds from the website
www.betexplorer.com instead for this season. The betting odds of Interwetten for the PL can be retrieved on
2.70, respectively. Placing 1 Euro on, say, Hannover 96 winning results in receiving 1.70 Euro
if Hannover 96 wins but in losing the Euro otherwise. The odds allow constructing probabilities
for each possible match outcome. The implicit probability of Hannover 96 winning is 0.47 in this
example.7
3
Hypothesis and Estimation Method
3.1 The Loss Frame
We derive the ex-ante expectations of match outcomes as follows. For each match, we collect the
betting odds for all three possible match outcomes (home team wins, tie, guest team wins), which
imply a probability for each match outcome. We then take the most likely match outcome as the
teams’ ex-ante expectation and thus as the reference-point in our regression analysis below. We
refer to a team that expects to win as the “favorite team” (or simply the “favorite”).8
We view a team as being in a loss frame whenever (i) it is behind its reference point and (ii) at
least one goal has been scored in the match. If we did not impose the condition that at least one
goal has to be scored in a match, the favorite team would be considered to be in a loss frame right
at the beginning of a match, which starts with a tie at 0:0. However, not even a clear favorite will
feel to be in a loss frame if the team is not ahead after a few minutes of play. Indeed, in matches
with at least one goal, the first goal is not scored until the 33rd minute of play on average, i.e.,
after more than a third of the regular playing time is over. Hence, we exclude that the favorite is in
a loss frame when the state of the match is 0:0 and we adopt the assumption that the favorite is in
a loss frame only if an event occurs that goes against expectations. This is the case if the opposing
team scores and gains the lead or if the state of the match is a tie other than 0:0.9 A team that
expects to tie is in a loss frame when the opposing team gains the lead. A team that expects to
7The sum of the inverses of the odds is 1.244, reflecting the bookmaker’s margin. Adjusting the inverse of the odds forHannover 96 winning, 1/1.7 = 0.588 for this margin results in an implicit probability of 0.47.
8In 3.9 percent of all matches (321 out of 8’232) both teams were equally likely to win and these were the most likely match outcomes. In one single match a tie and the guest team winning were jointly the most likely match outcomes. In these 322 cases we adopted the assumption that the expectation was a tie. A tie was only twice the single most likely match outcome in our data.
9
lose (the “underdog”) can never be in a loss frame.10 On average teams are in a loss frame in about
14 percent of the minutes.11
3.2 Hypothesis
We employ two objective measures of behavior—assigned cards and strategy adjustments by way
of player substitutions—to test the following null hypothesis.
Hypothesis: Controlling for the state of the match, the behavior of players and coaches does not
depend on whether their team is in a loss frame or not, with the loss frame being determined by
the team’s standing relative to an expectation-based reference point.
In contrast to the null hypothesis, it is a central prediction of models of expectation-based
reference-dependent behavior that, in our context, the number of assigned cards that players receive
and the strategy adjustments that coaches implement is influenced by whether or not their team
is in the loss frame. The focus of this paper is to address this central prediction. The particular
model that we have in mind is that being in a loss frame is psychologically different from not being
in a loss frame. Specifically, players and coaches might feel increased pressure or stress, be nervous,
or even frustrated when being behind expectations. These states of mind can lead to a reduced
ability to always apply the best judgment and always opt for the best course of play (applies to
players and coaches), or they can lead to a “loss of control” (see Card and Dahl (2011)), i.e., to
overreaction and aggression (applies to players). We aim to capture these behavioral changes with
the two outcome measures at hand.
10
In Section 4.3 we provide another robustness check in which we use a team’s ex-ante expected number of points as an alternative reference point and show that our results also hold under this specification. Note however that this specification has the undesirable feature that the underdog team is always in a loss frame if they are behind (as it never occurred that the probability of loosing is 1) and that they can even be in a loss frame at a tie (if the expected number of points exceeds 1).
11
3.3 Estimation Equation
We construct two dependent variables. First, the dependent variable carditm is a function of the
number of cards in match i that players of team t receive in minute m.12 In one specification,
where we estimate a linear probability model, carditm is a binary variable that takes on value 0 if
no card was assigned and value 1 if at least one card was assigned in matchito a player of teamt
in minutem. In our other specifications,carditmis the exact number of cards that were assigned in
match ito a player of teamtin minutem. Minutes with multiple cards in a given minute however
account for less than 1 percent of minutes.13
Second, the dependent variable strategy adjustmentitm is a function of the strategic
adjust-ment measure (see Section 2) in match i of team t in minute m. In one specification, where
we estimate a linear probability model, strategy adjustmentitm is a binary variable that takes on
value 0 if no offensive substitution was implemented (i.e., the strategy adjustment measure is
neg-ative or zero) and value 1 if the coach of team t implements an offensive strategy adjustment in
minute m of match i (i.e., the strategy adjustment measure is positive). In our other
specifica-tions, strategy adjustmentitm is the exact value of the strategy adjustment measure of teamt in
minutemof match i. If there is more than one substitution in the same minute for the same team,
we calculate the net change of the strategy adjustment measure that results from all substitutions.
That is, multiple substitutions of a team in the same minute are treated as a single event.14
To estimate the influence of being in a loss frame on players’ and coaches’ behaviors, we specify
two estimation equations, one for cards per minute, and one for strategy adjustments per minute.
We model the number of cards that the players of teamtreceive in minutem of matchias follows:
carditm=c+lossf rameitm×β1+X
0
itm×β2+itm
(1)
where c is an intercept, lossf rameitm is an indicator variable that denotes whether team t was
in a loss frame in match i in minute m, and Xitm contains a set of control variables, such as,
e.g., minute-of-play dummy variables or previous match events, as specified for each regression in
12
See Appendix B for the details of the data preparation, e.g., how we dealt with several events within the same minute and how we determined whether a given card or substitution occurred in or out of the loss frame.
13
We observe 223 minutes in which two cards were assigned and two minutes in which three cards were assigned. 14
Tables II, III, and IV below.15 In addition, we always control for the state of the match by including
dummy variables on exact goal differences.
In estimation equation (1), unobserved factors such as contestedness, weather conditions,
audi-ence size, referees, location, or season could influaudi-ence both the loss frame and the number of cards
received. One can think of many different mechanisms by which third factors could have a joint
effect on the loss frame and the extent to which players breach the rules of the game. For example,
bad weather conditions could add randomness to the course of the game (say, because it is difficult
to control the ball), meaning that the team that is expected to win might be in a loss frame in a
larger part of the match than usual. At the same time, bad weather conditions could lead to a large
number of assigned cards (say, because it is more difficult not to breach the rules of the game while
trying to win a tackle), thus creating a correlation between occurrences of the loss frame and cards.
Our panel data allow us to control for these unobserved factors. To do so, we utilize a one-way
error component model for the disturbancesitm, with
itm=αit+uitm
(2)
In equation (2), αit denotes a match specific effect for each team (later referred to as
“Team-Match Fixed Effects”). Inserting equation (2) into (1) leads to estimation equation
carditm=c+lossf rameitm×β1+X
0
itm×β2+αit+uitm
(3)
which enables us to consistently estimate β1, the effect of being in the loss frame on behavior.
The same arguments apply to our second outcome variable, strategy adjustments, which leads
to the estimation equation
strategy adjustmentitm = ˜c+lossf rameitm×β˜1+X
0
itm×β˜2+ ˜αit+ ˜uitm
(4)
Note that, since we are interested in the behavioral responses of the players and coach of a team
that is either in a loss frame or not, each match is included twice in our sample: once from the
perspective of the home team, and once from the perspective of the away team. This also accounts
15
for possible effects of playing at home or away. Hence, equations (3) and (4) do not only account
for match but also for team specific effects. Since this procedure introduces interdependence across
match observations, we estimate heteroskedasticity-robust standard errors that are adjusted for
clustering on the match level.
4
Results
4.1 Descriptive Evidence
Figure II shows the average number of cards and our strategy adjustment measure for minutes
in which a team is not in a loss frame (light grey bars) and for minutes in which a team is in a
loss frame (dark grey bars). The error bars show the 95% confidence interval of these averages.
It can be seen that both behavioral outcome variables are substantially higher if a team is in a
loss frame. Figure II thus provides first evidence that professional players and coaches exhibit
[image:13.612.190.424.410.575.2]reference-dependent behavior.
Figure II: Cards and Strategy Adjustment Measure per Minute
0
.005
.01
.015
.02
.025
Mean per Minute
Cards Strategy Adjustment Measure
not in a loss frame in a loss frame
Notes: The two left bars show the average number of cards per minute separately for minutes where a team is not in a loss frame (0.0189) and minutes where a team is in a loss frame (0.0238). The two right bars show the respective averages of the strategy adjustment measure (0.0005 and 0.0106, respectively). The error bars show the 95% confidence interval of the averages.
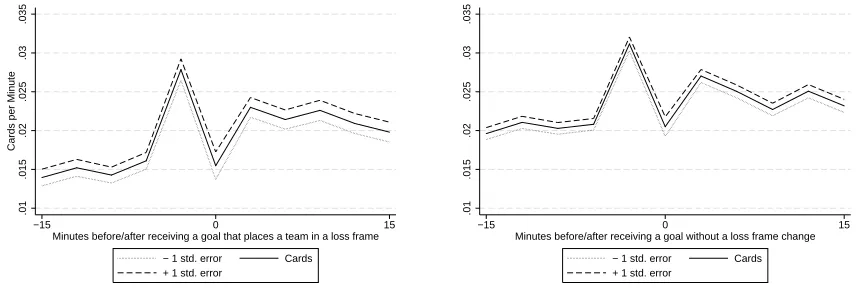
Next, we exploit the timing of events in our data and address the question whether the displayed
patterns in Figure II are causally related to being in the loss frame. Panel (a) of Figure III shows
frequency of cards in the minutes before and after it conceded a goal that places it in a loss frame.
In the 15 minutes before the goal, teams receive around 0.015 cards per minute. Directly before
the goal, however, we see that this average increases sharply to 0.027, most likely because assigned
cards are often associated with very good scoring opportunities for the opponent (e.g., penalties
and free-kicks). In the minute of the goal, the average number of cards drops again to 0.015, most
likely because the rules of the game prescribe that a conceded goal results in a kick-off and ball
possession for the non-scoring team. Therefore, there is a short break after the goal (while playing
time continues) which results in less time for foul play to occur in the minute of the goal. Once
the game has been restarted, however, we observe a considerably higher number of cards at a level
above 0.020 cards per minute, which corresponds to a 33% increase relative to the pre-goal period
(excluding the period directly before the goal).
The top right graph in Figure III is the equivalent graph for teams that concede a goal that
does not change the loss frame. Note that this includes, for example, favorites that are in a loss
frame already before they concede the current goal. We see that the average number of cards per
minute is somewhat higher at levels around 0.020 in the minutes before the goal already, reflecting
the fact that, for example, favorites in the loss frame receive more cards (as observed in the top
left picture). Again, we observe an increase in cards directly before the goal, followed by a decrease
in the minute of the goal. In the 15 minutes after the goal, we observe that the average number of
cards per minute raises to levels around 0.025, an increase of about 20%, relative to the pre-goal
period (again excluding the period directly before the goal).
The two graphs in panel (a) show that receiving a goal always leads to an increase of the assigned
number of cards, which in part reflects the pronounced increasing time trend in card assignments
that is displayed in the left panel of Figure I. Importantly, however, the two graphs reveal that
this increase is larger after receiving a goal that places a team in a loss frame.
Panel (b) of Figure III shows a similar pattern for our strategy adjustment measure. The lower
left picture shows the coaches’ strategy adjustments in the minutes before and after their teams
concede a goal that places them in a loss frame. We see that the average strategy adjustment
measure per minute is around 0 in the 15 minutes before the goal. However, as soon as a goal
places a team in a loss frame, we see a clear increase in the offensiveness of substitutions. In
was scored. This most likely reflects the fact that the short break in play after a goal is scored
provides a natural substitution opportunity. We also see that it takes some time before the level
of the strategy adjustment measure reaches its maximum (after around five to six minutes after
the goal). This might reflect the fact that substitution players typically require some preparation
time before they can be brought onto the field. Even 15 minutes after the goal, the average value
of the strategy adjustment measure per minute remains at levels around 0.008 and thus orders of
[image:15.612.92.525.285.432.2]magnitude higher than in the pre-goal period.
Figure III: Cards and Strategy Adjustment Measure Before and After Receiving a Goal
(a): Cards .01 .015 .02 .025 .03 .035
Cards per Minute
0
−15 15
Minutes before/after receiving a goal that places a team in a loss frame − 1 std. error Cards + 1 std. error
.01 .015 .02 .025 .03 .035 0 −15 15
Minutes before/after receiving a goal without a loss frame change − 1 std. error Cards + 1 std. error
(b): Strategy Adjustment Measure
−.005
0
.005
.01
.015
Strategy Adjustment Measure per Minute
0
−15 15
Minutes before/after receiving a goal that places a team in a loss frame −1 std. error Strategy Adjustment Measure + 1 std. error
−.005
0
.005
.01
.015
Strategy Adjustment Measure per Minute
0
−15 15
Minutes before/after receiving a goal without a loss frame change −1 std. error Strategy Adjustment Measure + 1 std. error
The lower right picture in Figure III shows the strategy adjustment measure for conceded goals
that do not change the loss frame. Similar to the top right picture for cards, we observe that
pre-goal levels are somewhat higher (around 0.003) than in the left graph. Once the goal has been
scored against the team, we see an increase in the offensiveness of substitutions that remains at a
level of about 0.007 even 15 minutes after the goal.
The two graphs in panel (b) show that receiving a goal always leads to an increase of the strategy
adjustment measure. Importantly, however, the two graphs reveal that this increase is again larger
after receiving a goal that places a team in a loss frame.
As a final piece of descriptive evidence, Figure IV provides a comparison between the behaviors
of favorites and underdogs when being one goal down and when being one goal ahead.16 The left
panel shows that favorites receive many more cards per minute when being down by one goal (and
thus in a loss frame) than when being ahead by one goal. For underdogs, in contrast, the number of
cards per minute is not much different when being down by one goal (expectedly, and thus not in a
loss frame) than when being ahead by one goal; it is even slightly higher when they are ahead. The
right panel shows that the coaches of favorite teams implement offensive strategy adjustments when
being down by one goal and defensive strategy adjustments when being ahead by one goal. The
same pattern emerges for underdogs but, importantly, the extent of offensive strategy adjustments
when being behind by one goal is smaller for underdogs than for favorites. The extent of defensive
strategy adjustments is more comparable when favorites and underdogs are one goal ahead, with
slightly more defensive substitutions made by underdogs.17
4.2 Main Results
Regressions (1) to (8) in Table II display our main results. To test our null hypothesis, all
spec-ifications include the dummy variable “Loss frame” that equals 1 if a team is in a loss frame and
0 otherwise. The top panel of Table II shows our regressions with carditm as dependent variable.
The dependent variable is binary (it equals 1 if at least one card was received and 0 otherwise) in
regression (1) and it equals the exact number of cards in regressions (2) to (4). The coefficient of
the dummy variable “Loss frame” is positive, large, and highly significant in regressions (1) to (4),
16
We are grateful to the associate editor for suggesting this particular analysis.
Figure IV: Cards and Strategy Adjustment Measure for Favorites and Underdogs
.018
.02
.022
.024
.026
.028
Mean per Minute
Favorites Underdogs one goal down one goal ahead
Cards
−.005
0
.005
.01
.015
Mean per Minute
Favorites Underdogs one goal down one goal ahead
Strategy Adjustment Measure
Notes: The left panel shows the average number of cards per minute for favorites and underdogs when being one goal behind and when being one goal ahead. The right panel shows the average of the strategy adjustment measure per minute for favorites and underdogs when being one goal behind and when being one goal ahead.
revealing that the players of a team receive more cards when they are in a loss frame.
Regression (1) is a linear probability model that controls for team-match fixed effects, and the
exact goal difference. The regression shows that the probability that a player is assigned a card
increases by over 50 percent if his team is in a loss frame (recall that a team that is not in a loss
frame receives 0.0189 cards per minute; see Figure II). Regression (2) shows that the coefficient is
very similar with the total number of cards per minute as the dependent variable. Regression (3)
controls additionally for minute fixed effects, and regression (4) also for previous match events. In
particular, the latter regression controls for the total number of cards assigned in the match so far
and for the number of cards squared. Regressions (3) and (4) show that our result is robust to the
introduction of controls for in-match time-dynamics (recall that the left panel of Figure I reveals
that there is a clear time trend in the number of cards assigned). The size of the coefficient of
the loss frame dummy is 0.0027 in regression (4), implying that the average number of cards per
minute increases by more than 14 percent, even after we control for time effects.
Result 1: Players receive significantly more cards if their teams are in a loss frame. While
controlling for the state of the match, being in a loss frame increases the number of cards in a
Table II: Expectations as Reference Points: Main Lossframe
Panel A: Cards per Minute
LPM OLS OLS OLS
(1) (2) (3) (4)
loss frame 0.0101*** 0.0102*** 0.0019*** 0.0027***
(17.42) (17.35) (3.22) (4.09)
Team-Match Fixed Effects X X X X
Exact Goal Difference X X X X
Minute Fixed Effects X X
Previous Match Events (Cards) X
Observations 1’569’478 1’569’478 1’569’478 1’569’478
Panel B: Strategy Adjustment Measure per Minute
LPM OLS OLS OLS
(5) (6) (7) (8)
loss frame 0.0053*** 0.0038*** 0.0031*** 0.0045***
(16.96) (8.03) (6.28) (7.17)
Team-Match Fixed Effects X X X X
Exact Goal Difference X X X X
Minute Fixed Effects X X
Previous Match Events (Substitutions) X
Observations 1’569’478 1’569’478 1’569’478 1’569’478
tstatistics in parentheses
*p <0.10, **p <0.05, ***p <0.01
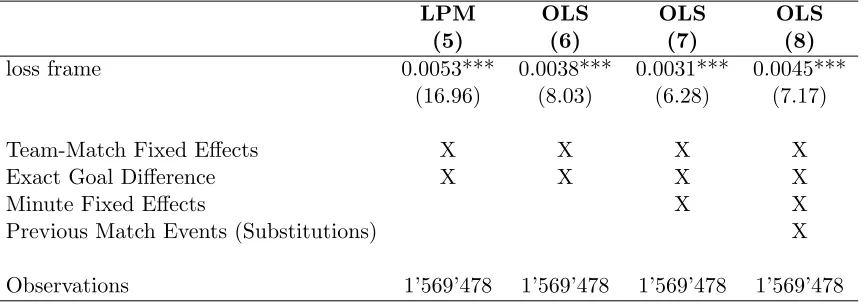
The bottom panel of Table II shows our regressions (5) to (8), which are equivalent to regressions
(1) to (4), but with strategy adjustmentitm as dependent variable. The dependent variable in
regression (5) is a dummy that equals 1 if the strategy adjustment measure is strictly positive,
while the dependent variable in regressions (6) to (8) is the exact value of the strategy adjustment
measure. The previous match events that we control for in regression (8) are the number of previous
substitutions and the cumulated strategy adjustment by each team.
The coefficient of the dummy variable “Loss frame” is again positive, large, and highly significant
an offensive substitution and that substitutions are in general more offensive when a team is in
a loss frame. Regression (5) shows that the probability of making an offensive substitution more
than doubles if a team is in a loss frame (the average numberof offensive substitutions per minute
out of the loss frame is 0.0045). The size of the coefficient of the loss frame dummy is 0.0045 in
regression (8), which indicates that the strategy adjustment measure increases by more than 800
percent (the average value of the strategy adjustment measure per minute out of the loss frame is
0.0005; see Figure II).18
Result 2: Coaches implement significantly more offensive strategy adjustments if their teams are
in a loss frame. While controlling for the state of the match, being in a loss frame increases the
per minute average of the strategy adjustment measure by more than 800 percent.
The above analysis demonstrates that the players’ and coaches’ behavior depends on whether
or not their team is in a loss frame.19 Results 1 and 2 thus both reject the null hypothesis that the
reference point that is given by the ex-ante expected match outcome does not affect behavior.
4.3 Alternative Loss Frame Specifications
To check the robustness of our results, we consider two alternative loss frame specifications. In
the first alternative specification, we assume that a team’s reference point is given by the expected
number of points (instead of the most likely match outcome). Recall that winning a match yields
3 points, a tie 1 point, and losing 0 points. The expected number of points is thus calculated as
follows: expected number of points = prob(win)·3 +prob(tie)·1 + (1−prob(win)−prob(tie))·0.
We refer to being behind this reference point as being in the first alternative loss frame. As in our
main specification, we maintain the assumption that a team falls into a loss frame only after it
conceded at least one goal. While this alternative formulation of the expectation-based reference
point uses the betting odds not only in an ordinal but in a cardinal way, it has three undesirable
18It could be that favorites have more defensive starting lineups than underdogs and use offensive substitutions to adjust the lineup when they are in a loss frame. To check for this possibility, we calculate the sum of the strategic position values of the teams’ starting lineups (recall from Section 2 that we assigned different values to different positions). The sums are 29.2 and 29.0 for favorites and underdogs, respectively. Judged by this measure, the average starting lineups are very similar; if anything, favorites have a slightly more offensive lineup.
19
features. First, it typically yields an expected number of points that is different from the possible
match outcomes 0, 1, or 3 points, and it seems implausible that a team’s reference point is to get,
say, 1.7 points out of a match. Second, using the expected number of points as the reference point
typically implies that both teams are simultaneously in a loss frame if the state of the match is a
tie (other than 0:0) because in most matches both teams expect to get more than 1 point. Third,
even a clear underdog team is in a loss frame if the team is behind because the expected number of
points is always positive, i.e., the betting odds never imply that a team will lose with probability
1. For these reasons, we consider the most likely match outcome to be a more plausible reference
point in our context. Teams are on average in the first alternative loss frame in about 34 percent
of the time, which is more than twice as often as in our main specification (14 percent).
As a second alternative specification, we again consider the most likely match outcome to be
the reference point, but now assume that the favorite is in a loss frame right from the beginning
of the match and as long as the team is not ahead. We refer to being behind this reference point
as being in the second alternative loss frame. The only difference between our main loss frame
specification and this second modification is that the favourite is in a loss frame at 0:0 in the latter.
Consequently, teams are on average more often in the second alternative loss frame, in about 32
percent of the minutes.
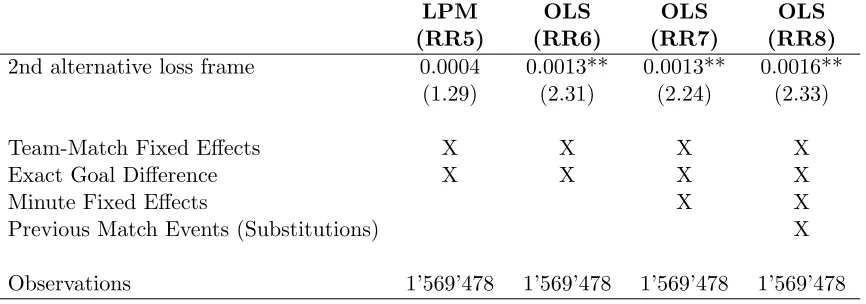
Tables III and IV show the regression results for the first and second alternative loss frame
specification, respectively. Apart from the respective specification of the loss frame, regressions
(R1) to (R8) and (RR1) to (RR8) exactly correspond to regressions (1) to (8) in Table II. The
coefficients and significance of the loss frame dummy variable in the regressions in Tables III and IV
show that our main results are generally robust to the above alternative specifications of the loss
frame. Only the coefficient of the second alternative loss frame is not even marginally significant
in the linear probability model (RR5) with offensive substitutions as dependent variable. Note,
however, that this reference-point specification has the undesirable feature that the favorite team is
in a loss frame right at the beginning of a match, while the nature of the game is such that it takes
more than 30 minutes on average until the favorite goes ahead (if at all). Player substitutions at
the beginning of a match are however extremely rare. Out of the more than 5 substitutions that
take place on average (see Table I), only 0.14 take place in the first half hour of a match.20
Table III: Expectations as Reference Points: First Alternative Lossframe
Panel A: Cards per Minute
LPM OLS OLS OLS
(R1) (R2) (R3) (R4)
1st alternative loss frame 0.0146*** 0.0148*** 0.0012* 0.0021***
(25.27) (25.24) (1.82) (2.91)
Team-Match Fixed Effects X X X X
Exact Goal Difference X X X X
Minute Fixed Effects X X
Previous Match Events (Cards) X
Observations 1’569’478 1’569’478 1’569’478 1’569’478
Panel B: Strategy Adjustment Measure per Minute
LPM OLS OLS OLS
(R5) (R6) (R7) (R8)
1st alternative loss frame 0.0073*** 0.0025*** 0.0015*** 0.0018***
(25.79) (5.44) (2.89) (2.85)
Team-Match Fixed Effects X X X X
Exact Goal Difference X X X X
Minute Fixed Effects X X
Previous Match Events (Substitutions) X
Observations 1’569’478 1’569’478 1’569’478 1’569’478
tstatistics in parentheses
*p <0.10, **p <0.05, ***p <0.01
4.4 Productivity Analysis
In our analyses we compared teams that are unexpectedly behind (i.e., teams that are in a loss
frame) to teams that are expectedly behind. Our implicit identification assumption was that any
behavioral change that we detect is driven by the fact of being behind expectations. Note, however,
that it could be that favorite teams behave differently than non-favorite teams when being behind
in score for reasons other than reference-dependence.21 However, by definition, a favorite team is
in Appendix C. The analysis reveals that the loss frame dummy remains significant in the large majority of the specifications in the separate leagues.
21
Table IV: Expectations as Reference Points: Second Alternative Lossframe
Panel A: Cards per Minute
LPM OLS OLS OLS
(RR1) (RR2) (RR3) (RR4)
2nd alternative loss frame 0.0022*** 0.0022*** 0.0035*** 0.0040***
(3.01) (3.03) (4.89) (4.98)
Team-Match Fixed Effects X X X X
Exact Goal Difference X X X X
Minute Fixed Effects X X
Previous Match Events (Cards) X
Observations 1’569’478 1’569’478 1’569’478 1’569’478
Panel B: Strategy Adjustment Measure per Minute
LPM OLS OLS OLS
(RR5) (RR6) (RR7) (RR8)
2nd alternative loss frame 0.0004 0.0013** 0.0013** 0.0016**
(1.29) (2.31) (2.24) (2.33)
Team-Match Fixed Effects X X X X
Exact Goal Difference X X X X
Minute Fixed Effects X X
Previous Match Events (Substitutions) X
Observations 1’569’478 1’569’478 1’569’478 1’569’478
tstatistics in parentheses
*p <0.10, **p <0.05, ***p <0.01
behind expectations if the team is behind in score. We thus cannot separately observe favorite
teams that are behind in score and favorite teams that are behind expectations.
This point is exemplified by thinking about the fictitious game “handicap-soccer,” in which the
favorite team starts the match with one goal behind.22 The favorite team is thus behind by one goal
initially but this is entirely expected. Randomly assigning favorite teams to either handicap-soccer
or regular soccer would enable us to observe favorite teams being behind expectations (in case a
goal is scored against the favorite team in regular soccer) and favorite teams not being behind
expectations (handicap-soccer), while both are behind by one goal. We would then be able to
22
unambiguously identify the effect of being behind expectations on the behavior of favorite teams.
With non-experimental field data it is however impossible to randomly assign expectations.
This limitation about our setting poses a potential concern about the interpretation of our
previous results. The reason is that it may be productive for favorite teams, as the relatively stronger
team, to play in a way that leads to more cards and to implement a more offensive strategy of play
when being behind in score, compared to non-favorite teams being behind in score. Fully rational,
non-reference-dependent reasons might thus drive the observed behavioral change of favorite teams
when they fall behind in score. In contrast, in the model of reference-dependent behavior that
we have in mind, being in a loss frame is psychologically different from not being in a loss frame.
Importantly, this different state of mind, such as being under pressure or frustrated, can manifest
itself in potentially not fully rational behaviors by players and coaches. To distinguish between
these alternative explanations, in the following we analyze if receiving more cards or implementing
a more offensive strategy while being behind expectations increases or decreases the likelihood of
changing the ultimate match outcome for the better.23
To determine if cards or offensive substitutions in the loss frame affect a team’s final match
outcome, we estimate the following two regression models.24
match outcomeit = c+cards per loss minuteit×γ1+cards per no loss minuteit×γ2+
+ Xit×γ3+αt+it
(5)
match outcomeit = c+of f. substitutions(in loss f rame)itטγ1
+ of f. substitutions(out of loss f rame)itטγ2+Xitטγ3+ ˜αt+ ˜it
(6)
where match outcomeit is the final match outcome for team t in match i. We use two different
measures for the final match outcome: first, a team’s final goal difference (i.e., −8,−7, . . . ,−1,0,
+1, . . . ,+7,+8) and, second, a team’s number of points (i.e., 0,1,3).
23
Notice that no such strategic reasons are present in the paper by Card and Dahl (2011) because they analyze behavioral reactions of supporters in the aftermath of matches.
24
We estimate two separate models because the exact minutes in which a team is in a loss frame can slightly differ for cards and substitutions. An example would be a loss frame changing goal in the second half of minutem. If the non-scoring team performs a substitution after the goal was scored but still in minutem, then the goal is counted for the goal difference in minutemin the substitution data set. If the non-scoring team does not receive a card in the time span between the goal and the end of minutem, then the goal is counted only for the goal difference in minute
In equation (5), cards per loss minuteit is the number of cards that teamtreceived throughout
match i while the team was in the loss frame, divided by the total number of minutes that the
team spent in the loss frame. Similarly, cards per no loss minute gives the number of cards that
the team received while the team was not in the loss frame, divided by the total number of minutes
that the team spent out of the loss frame. In equation (6), of f. substitutions(in loss f rame)it is
the number of offensive substitutions that the coach of team t implemented in match i while the
team was in the loss frame, and of f. substitutions(out of loss f rame) is the number of offensive
substitutions that the coach of the team implemented while it was not in the loss frame. In both
equations, Xit contains a set of control variables, such as a linear and a quadratic term for the
number of minutes spent in the loss frame (“Loss Frame Duration”), and in some specifications we
also include the implicit outcome probabilities; see Table V below. To estimate both equations,
we include match observations only from teams that were at some point of the match in the loss
frame.25 If the most likely outcome is a tie, it can happen that both teams in a match are in the
loss frame at some point. We thus adjust standard errors for clustering on the match level.
The upper panel of Table V displays the results for estimation equation (5). Regressions (P1) to
(P4) consistently show that cards in the loss frame are not productive as they significantly reduce
the final goal difference (goals scored minus goals conceded) and points for the team. Increasing
the number of cards per loss frame minute by one standard deviation (0.034) reduces the final goal
difference by 0.134 goals. Similarly, teams receive 0.135 points less from such an increase. Note
that we obtain this result while controlling for the time that the team spent in the loss frame.
Interestingly, we observe that cards can be productive if they are received out of the loss frame.
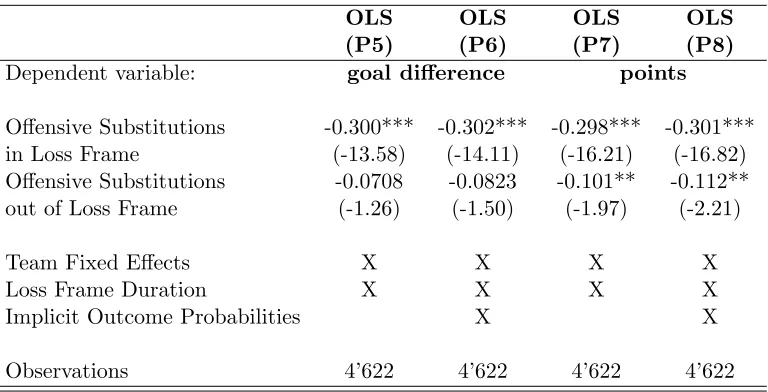
The lower panel of Table V displays the results for estimation equation (6). Regressions (P5)
to (P8) consistently show that offensive substitutions in a loss frame are not productive, as they
significantly reduce the final goal difference and points for a team. An additional offensive
sub-stitution in a loss frame reduces the final goal difference for a team by 0.30. The negative effect
on points is almost identical. In contrast, offensive substitutions out of the loss frame seem to be
largely inconsequential for the final match outcome measured by the final goal difference; for points,
however, these substitutions have a small negative effect, as shown in regressions (P7) and (P8).
25
Hence, the productivity analysis does not provide support for the view that the observed behavior
is an entirely rational response of favorite teams to falling behind. The results are however consistent
with a model of reference-dependent behavior, were falling behind expectations can lead to not
[image:25.612.116.500.437.633.2]entirely rational reactions.26
Table V: Productivity Analysis
Panel A: Are Cards Productive?
OLS OLS OLS OLS
(P1) (P2) (P3) (P4)
Dependent variable: goal difference points
Cards per Loss-Minute -3.933*** -3.154*** -3.995*** -3.356***
(-6.54) (-5.43) (-7.17) (-6.20)
Cards per No-Loss-Minute 1.030 2.481*** 1.934** 3.130***
(1.09) (2.70) (2.38) (3.93)
Team Fixed Effects X X X X
Loss Frame Duration X X X X
Implicit Outcome Probabilities X X
Observations 4’618 4’618 4’618 4’618
Panel B: Are Offensive Substitutions Productive?
OLS OLS OLS OLS
(P5) (P6) (P7) (P8)
Dependent variable: goal difference points
Offensive Substitutions -0.300*** -0.302*** -0.298*** -0.301***
in Loss Frame (-13.58) (-14.11) (-16.21) (-16.82)
Offensive Substitutions -0.0708 -0.0823 -0.101** -0.112**
out of Loss Frame (-1.26) (-1.50) (-1.97) (-2.21)
Team Fixed Effects X X X X
Loss Frame Duration X X X X
Implicit Outcome Probabilities X X
Observations 4’622 4’622 4’622 4’622
tstatistics in parentheses, *p <0.10, **p <0.05, ***p <0.01
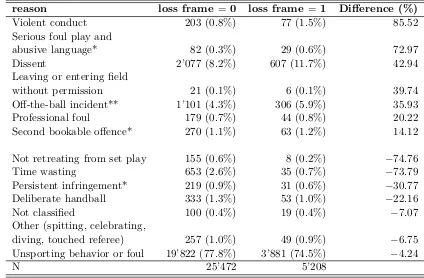
To further analyze the nature of the behavioral change of favorite teams in the loss frame, we
finally study the reasons for which the players are assigned cards.27 Table VI provides a summary
of the different categories and displays their relative share among cards in and out of the loss
frame. Reading from top to bottom, a clear pattern emerges: reasons that lend themselves to an
interpretation of players’ overreaction, aggressiveness, and sabotage account for much larger shares
[image:26.612.91.515.235.513.2]in the loss frame than out of the loss frame.
Table VI: Reasons for Card Assignments
reason loss frame = 0 loss frame = 1 Difference (%)
Violent conduct 203 (0.8%) 77 (1.5%) 85.52
Serious foul play and
abusive language* 82 (0.3%) 29 (0.6%) 72.97
Dissent 2’077 (8.2%) 607 (11.7%) 42.94
Leaving or entering field
without permission 21 (0.1%) 6 (0.1%) 39.74
Off-the-ball incident** 1’101 (4.3%) 306 (5.9%) 35.93
Professional foul 179 (0.7%) 44 (0.8%) 20.22
Second bookable offence* 270 (1.1%) 63 (1.2%) 14.12
Not retreating from set play 155 (0.6%) 8 (0.2%) −74.76
Time wasting 653 (2.6%) 35 (0.7%) −73.79
Persistent infringement* 219 (0.9%) 31 (0.6%) −30.77
Deliberate handball 333 (1.3%) 53 (1.0%) −22.16
Not classified 100 (0.4%) 19 (0.4%) −7.07
Other (spitting, celebrating,
diving, touched referee) 257 (1.0%) 49 (0.9%) −6.75
Unsporting behavior or foul 19’822 (77.8%) 3’881 (74.5%) −4.24
N 25’472 5’208
* PL only, ** BL only
As an example, take the card reason “violent conduct.” Such cards are assigned to players who
deliberately kick or hit an opponent player. While such cards are in general relatively rare, we find
that they are much more likely if the player’s team is in a loss frame. The effect is very large:
relative to the share of cards for violent conduct out of the loss frame, the share of such cards
increases by about 85 percent in the loss frame. Cards for “dissent” provide another example. Such
cards are usually assigned for players who complain about the referee’s decisions. The share of such
cards increases by 43 percent if a team is in a loss frame.
27
The increase of the relative share of reasons for cards like “violent conduct,” “serious foul play
and abusive language,” or “dissent” support the view that cards obtained in a loss frame do not
reflect fully rational, productive reactions of favorite teams to being in a loss frame. The reasons
for cards are however consistent with a model of reference-dependent behavior, were being behind
expectations means being in psychologically worse state of mind, such as feeling to be under pressure
or being frustrated.
4.5 Gain Frame
Many models of reference-dependent behavior assume loss aversion, i.e., they predict that gains
and losses are not coded symmetrically. The implications of this additional prediction are not
straightforward in our context. One reason is that the underlying behavior for card assignments
can be manifold. Cards may reflect a more risky or aggressive playing style, increased effort,
or sabotage of the opponent’s effort. While some of these behaviors may be more common for
unexpectedly losing teams, others may be more common for unexpectedly winning teams. The
consequence is that it is not clear that loss aversion would imply, e.g., that teams in a loss frame
will receive more cards than teams in a gain frame. Given the particular model that we have
in mind, it is perhaps more reasonable to expect (i) that the underlying behavior for cards that
players receive in the loss frame is different from the underlying behavior for cards that players
receive in the gain frame, and (ii) that behavioral changes in the loss frame are less productive than
behavioral changes in the gain frame.
In test these two predictions, we include an additional indicator variable denoting whether team
twas in again framein matchiin minutemin the specifications shown in Table II. Table VII shows
that the coefficients of the loss frame indicator remain highly significant in all specifications and
change in size only marginally. Moreover, we find that the coefficients of the gain frame indicator
are also highly significant in all specifications.
In regressions (1-GF) to (4-GF) with cards as dependent variable, all coefficients of the gain
frame indicator are positive and even larger in size than the respective loss frame coefficients, thus
providing further evidence for the existence of a reference point. Importantly, the productivity
analysis in Panel A of Table VIII, which mirrors the productivity analysis in Table V in the
and clearly not unproductive. Hence, the increase of cards in the gain frame could, potentially,
be fully driven by rational responses of non-favorite teams to being ahead of expectations. If this
interpretation was true, we should find that the reasons for (productive) cards that teams receive
in the gain frame differ from those for (unproductive) cards that teams receive in the loss frame.
Our results in Table IX support this prediction. Specifically, Table IX parallels Table VI and lists
the different card reasons and their percentage change in the gain frame and loss frame relative
to the baseline of being in a neutral state. On the one hand, we find that strategically reasonable
rule violations (when being ahead in score), such as “time wasting,” are substantially more often
observed in the gain frame. On the other hand, we find that reasons such as “violent conduct” or
“serious foul play” occur relatively less often in the gain frame (recall that they occurred relatively
more often in the loss frame). Hence, while our previous analyses are consistent with the idea that
being behind expectations puts teams, e.g., under pressure, no such negative psychological state of
mind appears to be present in the gain frame. In this sense, our findings are consistent with the
common property of models of reference-dependent behavior that losses and gains are not coded
symmetrically.
Regressions (5-GF) to (8-GF) analyze the coaches’ substitution decisions. We begin our
dis-cussion with regressions (6-GF) to (8-GF), with the strategy adjustment measure as dependent
variable. The regressions reveal that coaches implement substitutions that are significantly less
of-fensive in the gain frame relative to the baseline, controlling for the state of the match. Indeed, the
average value of the strategy adjustment measure of teams in the gain frame is−0.005 (compared
to about 0.01 in the loss frame). This shows that teams in the gain frame implement defensive
strategy adjustments, on average. Accordingly, we conduct a separate productivity analysis for the
defensive substitutions of teams in the gain frame. Panel B of Table VIII shows that such defensive
substitutions are productive. Hence, the analysis of the strategy adjustment measure in the gain
frame is again consistent with the prediction that losses and gains are not coded symmetrically.
Indeed, the data suggest that coaches act more risk averse when their teams are ahead of
expecta-tions (and that this is a productive strategy) but that they act more risk seeking when their teams
Table VII: Expectations as Reference Points: Main Loss Frame and Gain Frame
Panel A: Cards per Minute
LPM OLS OLS OLS
(1-GF) (2-GF) (3-GF) (4-GF)
gain frame 0.0096*** 0.0097*** 0.0030*** 0.0037***
(16.68) (16.67) (4.97) (5.73)
loss frame 0.0082*** 0.0082*** 0.0015*** 0.0022***
(14.24) (14.18) (2.59) (3.44)
Team-Match Fixed Effects X X X X
Exact Goal Difference X X X X
Minute Fixed Effects X X
Previous Match Events (Cards) X
Observations 1’569’478 1’569’478 1’569’478 1’569’478
Panel B: Strategy Adjustment Measure per Minute
LPM OLS OLS OLS
(5-GF) (6-GF) (7-GF) (8-GF)
gain frame 0.0024*** -0.0022*** -0.0029*** -0.0035***
(9.75) (-4.78) (-6.21) (-6.41)
loss frame 0.0048*** 0.0042*** 0.0035*** 0.0049***
(15.48) (8.86) (7.04) (7.94)
Team-Match Fixed Effects X X X X
Exact Goal Difference X X X X
Minute Fixed Effects X X
Previous Match Events (Substitutions) X
Observations 1’569’478 1’569’478 1’569’478 1’569’478
tstatistics in parentheses
Table VIII: Productivity Analysis: Gain Frame
Panel A: Are Cards Productive?
OLS OLS OLS OLS
(P1-GF) (P2-GF) (P3-GF) (P4-GF)
Dependent variable: goal difference points
Cards per Gain-Minute 0.355 0.631 0.540 0.769*
(0.87) (1.60) (1.22) (1.79)
Cards per No-Gain-Minute -7.633*** -6.984*** -7.508*** -6.971***
(-6.29) (-6.09) (-7.71) (-7.53)
Team Fixed Effects X X X X
Gain Frame Duration X X X X
Implicit Outcome Probabilities X X
Observations 4’597 4’597 4’597 4’597
Panel B: Are Offensive Substitutions Productive?
OLS OLS OLS OLS
(P5-GF) (P6-GF) (P7-GF) (P8-GF)
Dependent variable: goal difference points
Defensive Substitutions 0.269*** 0.260*** 0.310*** 0.303***
in Gain Frame (10.20) (10.20) (11.90) (11.96)
Defensive Substitutions -0.289*** -0.269*** -0.194*** -0.177***
out of Gain Frame (-4.80) (-4.71) (-3.71) (-3.53)
Team Fixed Effects X X X X
Gain Frame Duration X X X X
Implicit Outcome Probabilities X X
Observations 4’628 4’628 4’628 4’628
tstatistics in parentheses
Finally, to mirror the analysis in Table II, the dependent variable in regression (5-GF) is an
indicator that takes on value 1 if an offensive substitution was conducted in a given minute. The
regression reveals that offensive substitutions take place more often in the loss frame as well as
in the gain frame. Combined with our earlier findings, this suggests a generally higher propensity
to conduct substitutions compared to the baseline of being “at expectation.” A corresponding
regression with an indicator that takes on value 1 if a defensive substitution was conducted in a
given minute (not reported in the table) reveals that the coefficient of the gain frame dummy is
highly significant and amounts to 0.0040. The size of the coefficient is thus much larger than the
respective value in regression (5-GF), which is consistent with the finding that substitutions are on
[image:31.612.84.532.328.618.2]average defensive if a team is in the gain frame.
Table IX: Reasons for Card Assignments: Gain Frame vs. Loss Frame
reason neutral change (%) change (%)
(“at expectation”) if gain frame = 1 if loss frame = 1
Violent conduct 171 (0.9%) −34.1 71.5
Serious foul play and
abusive language* 69 (0.4%) −33.6 60.0
Dissent 1’637 (8.3%) −5.3 41.3
Leaving or entering field
without permission 14 (0.1%) 76.1 63.3
Off-the-ball incident** 804 (4.1%) 30.1 44.5
Professional foul 148 (0.8%) −26.2 13.3
Second bookable offence* 199 (1.0%) 25.7 20.6
Not retreating from set play 105 (0.5%) 67.7 −71.0
Time wasting 347 (1.8%) 210.6 −61.6
Persistent infringement* 171 (0.9%) −1.14 −30.9
Deliberate handball 260 (1.3%) −1.1 −22.4
Not classified 78 (0.4%) −0.7 −7.2
Other (spitting, celebrating,
diving, touched referee) 190 (1.0%) 24.2 −1.8
Unsporting behavior or foul 15’646 (78.9%) −6.0 −5.5
N 19’839 5’633 5’208
5
Conclusion
Understanding the determinants and behavioral effects of reference points is important for many
fields in economics, such as worker morale and effort choices (e.g., Bewley (1999)), consumer goods
pricing (e.g., Heidhues and K¨oszegi (2008)), or optimal contracting (e.g., Hart and Moore (2008),
Herweg et al. (2010)). Our paper provides evidence in support of models assuming that peoples’
behavior is reference-dependent and that reference points are shaped by expectations. The ability
to observe team-specific ex-ante expectations about the final match outcome and the availability
of objective, behavioral measures for professional, experienced soccer players and coaches who act
in their natural environment is what enabled us to draw this inference. Still, some caveats remain.
In particular, our data do not allow distinguishing favorite teams that are behind in score from
favorite teams that are behind expectations. This is a potential concern because favorite teams are,
by definition, the relatively stronger teams and might thus have rational reasons to play in a way
that leads to more cards (Result 1) and to implement a more offensive strategy of play (Result 2)
when being behind in score, compared to underdogs being behind in score. Our productivity
analysis, however, does not support the possibility that players and coaches act in a fully rational
way: receiving more cards or substituting in an offensive way while being in a loss frame impairs
the ultimate match outcome. Also our analysis of the reasons for card assignments, showing that
reasons such as “violent conduct” or “serious foul play” occur relatively more often in the loss frame,
supports the interpretation that peoples’ behavior is reference-dependent rather than fully rational.
Finally, we would like to point out that soccer players can react to being in a loss frame in multiple
ways, many of which are unobservable in our data. For example, there could be a positive interaction
effect between cards and running speed in the loss frame. We showed that cards received in a loss
frame are unproductive but the overall productivity effect could be positive once the interaction
effect between running speed and cards is integrated into the analysis. While such effects neither
seem obvious nor first order, they could matter, in principle, but we are unable to address them
here. The availability of more sophisticated performance measures of soccer players might render