http://wrap.warwick.ac.uk/
Original citation:Wason, James M. S., Jaki, Thomas and Stallard, Nigel. (2013) Planning multi-arm screening studies within the context of a drug development program. Statistics in Medicine, Volume 32 (Number 20). pp. 3424-3435. ISSN 0277-6715
Permanent WRAP url:
http://wrap.warwick.ac.uk/56048
Copyright and reuse:
The Warwick Research Archive Portal (WRAP) makes this work by researchers of the University of Warwick available open access under the following conditions. Copyright © and all moral rights to the version of the paper presented here belong to the individual author(s) and/or other copyright owners. To the extent reasonable and practicable the material made available in WRAP has been checked for eligibility before being made available.
Copies of full items can be used for personal research or study, educational, or not-for-profit purposes without prior permission or charge. Provided that the authors, title and full bibliographic details are credited, a hyperlink and/or URL is given for the original metadata page and the content is not changed in any way.
Publisher’s statement:
Article is published under the Wiley OnlineOpen scheme and information on reuse rights can be found on the Wiley website:
http://olabout.wiley.com/WileyCDA/Section/id-406241.html
A note on versions:
The version presented in WRAP is the published version or, version of record, and may be cited as it appears here.
Received 6 August 2012, Accepted 17 February 2013 Published online 26 March 2013 in Wiley Online Library
(wileyonlinelibrary.com) DOI: 10.1002/sim.5787
Planning multi-arm screening studies
within the context of a drug
development program
James M. S. Wason,
a*†Thomas Jaki
band Nigel Stallard
cScreening trials are small trials used to decide whether an intervention is sufficiently promising to warrant a large confirmatory trial. Previous literature examined the situation where treatments are tested sequentially until one is considered sufficiently promising to take forward to a confirmatory trial. An important considera-tion for sponsors of clinical trials is how screening trials should be planned to maximize the efficiency of the drug development process. It has been found previously that small screening trials are generally the most efficient. In this paper we consider the design of screening trials in which multiple new treatments are tested simultane-ously. We derive analytic formulae for the expected number of patients until a successful treatment is found, and propose methodology to search for the optimal number of treatments, and optimal sample size per treatment. We compare designs in which only the best treatment proceeds to a confirmatory trial and designs in which multiple treatments may proceed to a multi-arm confirmatory trial. We find that inclusion of a large number of treatments in the screening trial is optimal when only one treatment can proceed, and a smaller number of treatments is optimal when more than one can proceed. The designs we investigate are compared on a real-life set of screening designs. Copyright © 2013 John Wiley & Sons, Ltd.
Keywords: multi-arm multi-stage trials; optimal design; phase II trials; screening trials
1. Introduction
Bringing a drug to market is a long, expensive process [1] requiring multiple clinical trials of various sizes. Generally, clinical trials can be divided into ‘screening’ and ‘confirmatory’ studies. The purpose of screening trials is to gain information about a treatment, such as its side-effects or efficacy, and to decide whether further investigation is warranted. The purpose of a confirmatory trial is to prove to an independent observer that the treatment should be licensed. A question of interest is whether changing the way screening trials are conducted could improve the efficiency of the drug development process as a whole.
The problem of designing screening trials of a single new treatment to maximize the efficiency of a drug development program is discussed by Stallard [2]. The problem is considered from the view of a large funder of clinical trials, for whom many treatments are available for testing. Each treatment is tested in a screening trial and, if the screening trial is successful, a confirmatory trial. Treatments are tested sequentially until one succeeds at the confirmatory trial. When the efficiency of the overall drug development process is considered, it has been found that conducting small screening trials on a larger number of treatments is efficient [3–5].
In this article, we extend methods in Stallard [2] to investigate how screening trials that test multiple new treatments should be designed. Whitehead [3] recommends that if there are a limited number of patients and a number of treatments, allocating a small number of patients to a large number of treatments
aHub for Trials Methodology Research, MRC Biostatistics Unit, Cambridge, U.K.
bMedical and Pharmaceutical Statistics Research Unit, Department of Mathematics and Statistics, Lancaster University, Lancaster LA1 4YF, U.K.
cWarwick Medical School, University of Warwick, Coventry, U.K.
*Correspondence to: James M. S. Wason, MRC Biostatistics Unit, Institute of Public Health, Robinson Way, Cambridge CB2 0SR, U.K.
†E-mail: [email protected]
will generally increase the probability of finding a successful treatment. We investigate this idea further and explore optimal design of screening trials to minimize the expected number of patients recruited before a successful treatment is confirmed. In this article, we will also explore how multi-arm screening trials should be designed, including the important question of how many arms should be included in multi-arm screening trials, and multi-arm multi-stage (MAMS) confirmatory trials to maximize the efficiency of the drug development process as a whole.
MAMS trials are ones in which multiple experimental treatments are tested within the same trial with a common control group. Efficiency is gained from the shared control group as well as from interim analyses allowing early dropping of ineffective arms. There are several examples of real MAMS trials, including the Medical Research Council Systemic Therapy in Advancing or Metastatic Prostate cancer: Evaluation of Drug Efficacy trial (STAMPEDE) [6], which uses the methodology described in Royston
et al.[7], and the TelmisArtan and InsuLin Resistance in HIV (TAILoR) trial, using the methodology described in Magirret al.[8]. In addition, there is a large literature on adaptive trials that start with multi-ple treatments and select treatments to continue with at an interim analysis [9–15]. Unlike these designs, we consider separate trials for the selection stage and the confirmatory stage, with focus on designing the selection trial to optimize the drug development process as a whole.
We investigate two types of screening design for comparing multiple treatments: (1) thetop-treatment design, in which if the test statistic of the most successful treatment at the screening stage is above a threshold, then that treatment passes on to a confirmatory trial in which it is tested against a control treatment; and (2) theall-interesting-treatments design, in which all treatments with test statistics above a threshold go on to a multi-arm confirmatory trial. We consider the optimal design of the screening trial in terms of the number of treatments simultaneously tested, the sample size per treatment, and the test statistic threshold for which a confirmatory trial takes place. We also consider how the optimal screening design differs when the confirmatory trial is multi-stage (allowing early stopping for futility or efficacy). As discussed further in Section 2, the setup used in this article assumes that an inexhaustible num-ber of treatments is available, and that each treatment has an independent treatment effect. A single pharmaceutical company would rarely have several distinct treatments available for testing for the same indication. However, a publicly funded trial such as the STAMPEDE trial [6] may be in a position to compare distinct treatments from several companies. In addition, there are other scenarios where the setup used in this article is applicable. Firstly, the Cocaine Rapid Efficacy Screening Trial (CREST), described in Leidermanet al. [16] is a highly relevant example that we look at in Section 4. Secondly, the ‘treatments’ may represent different doses of the same treatment or different treatment combina-tions. In both cases, the number of treatments available for testing would be much higher than the number of distinct drugs. In the former case, the treatment effects would generally be correlated because of a dose–response relationship; however, in some cases a monotone dose–response relationship may be thought to be implausible, such as in the TAILoR trial (or in cases where higher doses may be less well tolerated no dose–response relationship may exist at all). In these cases, the assumption of independence of treatment effects may be realistic. In the latter case, there may be some correlation between treatment combinations containing the same treatment, but again an assumption of indepen-dent treatment effects would likely be realistic. An example where there are a large number of possible treatment combinations available for testing is in tuberculosis [17]. A fourth scenario where these assumptions may be realistic is in non-drug trials, where there may be virtually unlimited potential policy interventions awaiting testing. In all these scenarios, the results described in this article would be useful.
2. Methods
2.1. Multiple arm top-treatment design trials with single-stage confirmatory trials
We first consider screening designs where only the top performing treatment may proceed to a con-firmatory trial. The trial design is as follows: at the screening stage,K new treatments and a control treatment are each allocatedn1patients. The treatment response of thejth patient on theith treatment
(i D0for the control treatment) is denoted as Xij, and assumed to be distributed asNi; i2. Let
Zi D
Pn1 jD1Xij
.
n1Pn1jD1X0j
.
n1
q
2
i=n1C02=n1
, i D 1; : : : ; K denote test statistics comparing the active
treat-ments to the control treatment. If maxfZ1; : : : ; ZKg > c1, where c1 is a design parameter, then the
corresponding top performing treatment is tested against the control treatment in a confirmatory study.
The confirmatory trial is assumed to be fixed in size, and its design does not depend on the results of the screening trial. This setup is similar to the design of Thallet al.[10], with minor differences including a control group in the screening phase and a normally distributed endpoint instead of a binary endpoint.
Without loss of generality, the mean effect of the control treatment is set to 0, withi representing
the mean effect of theith active treatment. The vector of treatment effects.1; : : : ; K/is denoted.
The probability of a particular set ofK new treatments resulting in a successful confirmatory study is
P.success at phase IIIj/D
K
X
iD1
P.success at phase IIIj;treatment i recommended/
P.treatment i recommendedj/;
where ‘treatment i recommended’ means that treatment i passes the screening trial. The event
.treatmentirecommended/is equivalent to.Zi > c1andZj < Zi 8i ¤ j /. If all new treatments
have the same variance,2, then this is equivalent to XNi NX0> c1
r
2 n1 C
02 n1;
N
Xi>XNj 8i¤j
!
,
whereXNkisPnj1D1Xkj=n1.
Because each term depends onXNi, we can integrate the conditional probability of selecting treatment i givenXNiover the distribution ofXNiNi; 2=n1:
P.treatment i recommendedj/D
Z 1
1
ˆ
xc
1
0=pn1
Y
j¤i ˆ
x
j
pn1
fXN
i.x/dx;
wherec1Dc1
r
2 n1C
02
n1, andfXNi represents the pdf ofXNi
i.e. Ni; 2 n1
.
We assume that1; : : : ; Khave independent normal prior distributions, with meanm0and variance v02, so that the probability of recommending each treatment is identical. The expected probability of recommending treatmentican be shown (see supplementary material)‡to be
Z 1
1
ˆ
0 B @ xc
1
q
02=n1
1 C A 8 ˆ < ˆ : Y
j¤i ˆ
0 B
@q xm0
2=n
1Cv20
1 C A 9 > = > ; 1 q
v02C2=n
1
0 B
@q xm0
v02C2=n
1
1 C
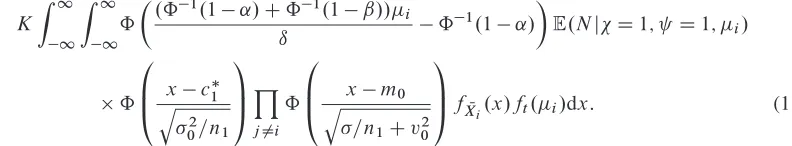
Adx: (1)
We define P1 as a binary random variable that takes value 1 if and only if a confirmatory trial is
conducted, andP2 as a binary random variable that takes value 1 if and only if a confirmatory trial is
conducted and is successful. The expected probability of conducting a confirmatory study,E.P.P1//,
is thenKtimes the quantity in Equation (1), which can be found quickly through numerical integration. Next, we derive the expected probability of a treatment proceeding to the confirmatory trial and subsequently being shown to be significantly more effective than the control (henceforth referred to as ‘phase III success’). This quantity uses the power function of the confirmatory study, which can be
written asˆ
.ˆ1.1˛/Cˆ1.1ˇ// i
ı ˆ
1
.1˛/
[2], whereıis the standardized clinically
relevant difference used for powering the confirmatory study,˛is the type-I error rate used, and1ˇis the power. This assumes confirmatory trials are powered independently of the results from the screening trial and so are always of fixed size. This is consistent with the definition of a clinically relevant difference, which should not depend on the previous results but be the treatment effect that would be desirable to detect.
The expected probability that treatmentipasses the screening trial and is successful at phase III is
Z 1 1 : : : Z 1 1 ˆ
.ˆ1.1˛/Cˆ1.1ˇ// i
ı ˆ
1
.1˛/
ˆ
0 B @ xc
q
02=n1
1 C AY
j¤i
ˆ pxj
2=n
1
!
fXNi.x/dxft.1/; : : : ; ft.K/d1; : : : ;dK: (2)
‡Supporting information may be found in the online version of this article.
As before, terms involving the0jsfori ¤j can be integrated out, giving the same normal pdf as before. Due to the extra term involvingi, further simplification is not possible. Equation (2) becomes
Z 1
1 Z 1
1
ˆ
.ˆ1.1˛/Cˆ1.1ˇ// i
ı ˆ
1
.1˛/
ˆ
0 B @ xc
1
q
02=n1
1 C AY
j¤i ˆ
0 B
@q xm0
2=n
1Cv02
1 C
AfXNi.x/ft.i/dxdi: (3)
For identical prior distributions, the expected probability of a set of K treatments leading to a successful phase III trial,E.P.P2//isKtimes the quantity in Equation (3).
Evaluating Equation (3) requires a two-dimensional numerical integration, for which we use the multivariate integration tools provided in the R2Cuba library [18] in R [19].
The expected number of patients recruited up to and including the first phase III success (expected sample size (ESS)), as used in Stallard [2], is given by .KC1/n1CE.P.P1//2n2
E.P.P2// , wheren2is the number
of patients recruited per arm in the confirmatory study.
For each value ofK, we search for the optimal (non-integer)n1 andc1 that minimizesESSthrough
use of a search technique such as the Nelder–Mead algorithm [20]. We then find the optimalc1values
when using the floor and ceiling integers of the optimaln1. The design that gives the lowestESSover all
investigated values ofK is chosen as the optimal screening design.
2.2. Multiple arm all-interesting-treatments trials with single-stage confirmatory trials
For the case in which all treatments that pass the threshold progress to the confirmatory trial, the trial design is as follows: at the screening stage,K new treatments and a control treatment are each allo-catedn1 patients. Test statistics comparing each new treatment to the control treatment,Z1; : : : ; ZK,
are calculated. Each treatment for which the test statistic is abovec1advances to a confirmatory study.
In the confirmatory study,n2 patients are assigned to each new treatment and the control treatment. A
new treatment is declared effective if the corresponding test statistic is abovec2. The values ofn2and c2 depend on the number of new treatments tested in the confirmatory trial. The value ofc2 is chosen
so that the family-wise error rate is controlled at ˛. The family-wise error rate is the probability of recommending any ineffective treatment and is a relevant quantity to control in multi-arm trials [21]. The value ofn2is chosen so that the power to detect superiority of a particular new treatment, when its
effect isıand the effects of all other new treatments are 0, is equal to1ˇ.
Given a specific treatment effect vector , the probability of a set of treatments not resulting in a phase II can be conditioned on the number of treatments that pass the screening trial:
P.failure at phase IIIj/DX
I2
fP.failure at phase IIIj;only treatments in set I pass phase II/
P.only treatments in set I pass phase IIj/g; (4)
whereI represents a subset of treatments 1; : : : ; K that pass the screening trial, andrepresents the set of all possible subsets of treatments. Note that because priors of all treatments are assumed to be identical, the probabilityP(only treatments in set I pass phase IIj) is identical for all sets I with the same size. Note also that there are jKIj sets with size jIj. After integrating over identical prior distributions for each treatment effect, Equation (4) becomes
K
X
iD0
Z 1 1 Z 1 1 8 < : Z 1 0 Z 0 1 f2 ´1 ´2 ; m
0c1x
m0c2y
; v
2
0Cn11 v02
v20 v20Cn21
!
d´2d´1
!i
ˆ
0 B @xCc
1m0
q
n1
1 Cv20
1 C A
Ki
f x; 0; n11f y; 0; n21dxdy
9 > > = > > ;
wheref2.´; ; †/is the pdf of a bivariate normal random variable with meanand covariance matrix †(see supplementary material). The inner integral can be efficiently evaluated using the method of Genz and Bretz [22]. For the outer integral, which is two-dimensional, we again use the R2Cuba library.
TheESSrecruited before a phase III success can be written as
ESSD
K
X
iD0
fP.success at phase IIIjitreatments pass phase II/SS.i /
CP.failure at phase IIIjitreatments pass phase II/.SS.i /CESS/g
P.i treatments pass phase II/: (6)
The sample size used when i treatments pass the screening trial, SS.i /, is equal to .K C1/n1
C.i C1/n2.i /, wheren2.i /is the number of patients recruited to each arm in a confirmatory study
includingi new treatments. From the previous text, the equation forESSis
ESSD
PK
iD0SS.i /P.itreatments pass phase II/
1PKiD0P.failure at phase IIIjitreatments pass phase III/P.itreatments pass phase II/
: (7)
2.3. Top-treatment screening designs with group-sequential confirmatory trials
By including interim analyses allowing stopping for both futility and efficacy in a confirmatory trial, the average number of patients recruited can be considerably reduced [23]. This is at the cost of a slightly increased sample size recruited if the trial does not stop early. Using a group-sequential confirmatory trial may also change the optimal design of the screening trial, as less effective treatments which proceeded to the confirmatory trial can be dropped early.
A group-sequential confirmatory trial changes the formulae used to find the expected sample size until phase III success. This is because the (expected) size of the confirmatory trial depends on the treat-ment effect and so is no longer independent of the results of the screening trial. We first consider a top-treatment design screening trial with the same notation as in Section 2.1 and a J-stage confirma-tory trial. Let be the random variable representing the treatment selected during the screening trial ( D 0represents no treatment is selected) and 2 f0; 1g be the outcome of the confirmatory trial (D1indicates success). Then theESSuntil a treatment is confirmed can be found by conditioning on possible values of. ; /and noting that sets of treatments tested in subsequent screening studies have independent treatment effects:
ESSD.n1.KC1/CE.NjD1; > 0//P.D1; > 0/
C.n1.KC1/CE.NjD0; > 0/CESS/P.D0; > 0/
C.n1.KC1/CESS/P. D0/; (8)
whereN is a random variable representing theSSused in the confirmatory trial. This leads to
ESSDn1.KC1/CE.NjD1; > 0/P.D1; > 0/CE.NjD0; > 0/P.D0; > 0/
1P.D0; > 0/P. D0/ :
(9) The probabilities in the denominator of (9) can be calculated in the same manner as previous sections. The second term in the numerator can be written (because the treatment effect distributions are identical)
Z 1
1
: : :
Z 1
1
KfE.NjD1; D1/gP. D1; D1/
K
Y
iD1
ft.i/di: (10)
The value ofE.NjD1; D1/is determined by the probability of the group sequential trial stopping for efficacy at each of theJanalyses at1. We denote these probabilities asp1.e/; : : : ; p
.e/
J . The value of
E.NjD1; D1/is then equal to
J
P
iD1
N.i / p
.e/ i
PJ lD1p.e/l
, whereN.i /is theSSof the group-sequential
design, were it is to stop at analysisi.
Through use of the same methods in Section 2.1, the number of integrations in Equation (10) can be reduced to give
K
Z 1
1 Z 1
1
ˆ
.ˆ1.1˛/Cˆ1.1ˇ// i
ı ˆ
1.1˛/
E.NjD1; D1; i/
ˆ
0 B @ xc
1
q
02=n1
1 C AY
j¤i ˆ
0 B
@qxm0
=n1Cv02
1 C
AfXNi.x/ft.i/dx: (11)
The third term in the numerator of Equation (9) can be calculated in a similar way. This leads to a computationally feasible method to calculate theESS.
2.4. Multi-arm multi-stage confirmatory trials
If one wishes to allow more than one new treatment to progress to a multi-stage confirmatory trial, as in the designs described in [7] and [8], then it is more difficult to find theESSuntil phase III success analytically. This is because each treatment in the confirmatory trial has a unique treatment effect, and so the number of integrations required to find the probability of success at phase III (and theESSof the phase III trial) cannot be reduced as before. Thus, any search technique, in which numerical integration is used, to find the optimalc1andn1is likely to be computationally infeasible.
Instead we use a simulation technique in which a large set of simulated datasets is generated and reused. In the supplementary material, we describe this procedure and apply it to the single-stage confir-matory trial to validate it, which gives the correct optimal design in comparison with the analytic search technique. The simulation method is used to estimate the probability of the phase III trial taking place; the probability of it being successful, conditional on taking place; and the expected sample size of the phase III trial, respectively when it fails and when it is successful.
To estimate the ESS for the given values of c1 and n1, one can estimate E.n2j D 1; > 0/,
P.D1; > 0/,E.n2jD0; > 0/,P.D0; > 0/, andP. D0/, and substitute the values into
Equation (9).
3. Results
3.1. Top-treatment screening trials with single-stage confirmatory trials
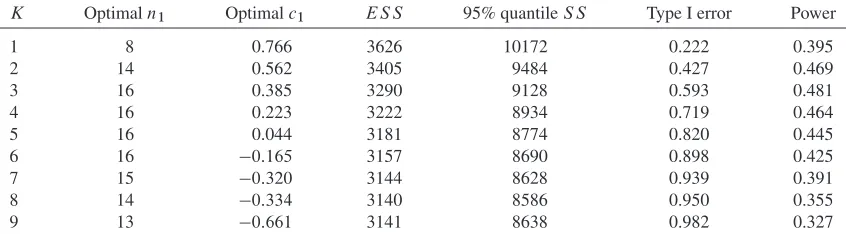
Firstly, we look at how theESSuntil phase III success varies asK, the number of new treatments simul-taneously tested in the screening stage, increases. Table I shows results when the prior mean,m0; is
equal to 0; the prior standard deviation,v0, is equal to 0.1;2 D02 D 1;ı D0:25;˛ D0:025; and 1ˇ D0:9. The optimal values forn1 andc1 for each value ofK are shown, together with theESS
and the implied family-wise error rate and power of the screening trial. In this context, the family-wise error rate is the probability of a confirmatory trial taking place when all screened treatments have mean treatment effect0. The power is the probability of a specific treatment progressing to a confirmatory trial when its mean treatment effect isıand all other new treatments have mean treatment effect 0.
The ESS is minimal at K D 9, with the optimal value of n1 D 22, and the optimal value of
c1 D 0:429. The latter result is surprising as one would be unlikely to put forward a treatment to a
confirmatory trial if it performed worse than the control treatment. In fact, forK D 9and n1 D 22,
one could usec1 D0with just a 0.1% increase inESS. Although theESSis an important quantity to
consider, having even an appreciable chance of requiring a huge number of patients is undesirable. Thus, we also examined the 95% quantile of theSSrequired until phase III success, shown in Table III. This quantity shows a similar pattern toESS, although is minimized atKD6instead ofKD9.
The optimal screening parameters correspond to a family-wise type-I error rate very close to 1 (i.e. if all treatments had the same mean effect as the control treatment, there would be a 0.965 probability of a confirmatory trial taking place). However, note that if all nine treatment effects are from aN.0; 0:1/
distribution, then it is very likely that at least one is better than control.
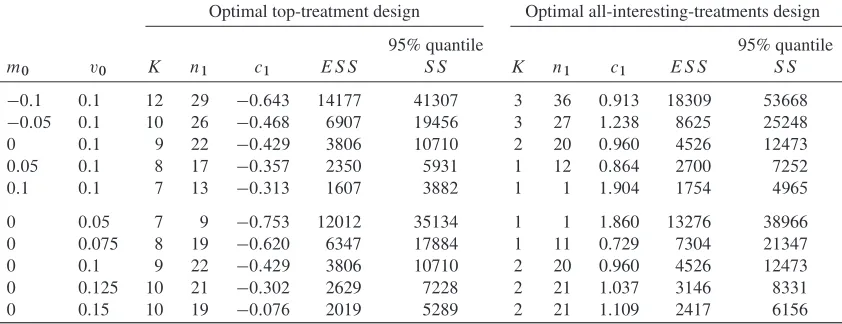
[image:7.594.107.503.105.178.2]We next examined the optimal screening parameters as the parameters of the prior distribution vary. Table II summarizes the optimal screening trial parameters for different prior treatment effect means,m0,
and prior treatment effect standard deviation,v0. Asm0increases, the optimal value ofKdecreases, and
the optimal value ofn1 also falls. This is because less precision is required to find a treatment that has
Table I. Optimal top-treatment design screening trial parameters, expected sample size (ESS), the 95% quantile of the sample size (SS) (from 5,000,000 simulation replicates), and operating characteristics asK varies form0 D 0, standard deviation v0 D 0:1, and clinically relevant difference for confirmatory trial
ıD0:25.
K Optimaln1 Optimalc1 ES S 95% quantileS S Type-I error rate Power
1 16 0.814 4599 12967 0.208 0.457
2 23 0.676 4236 11830 0.379 0.513
3 25 0.532 4057 11315 0.527 0.525
4 26 0.375 3952 10952 0.657 0.528
5 26 0.214 3886 10722 0.762 0.517
6 25 0.061 3845 10520 0.840 0.493
7 24 0:097 3821 10566 0.898 0.466
8 23 0:261 3809 10554 0.939 0.439
9 22 0:429 3806 10710 0.965 0.412
10 20 0:559 3809 10710 0.979 0.376
11 19 0:724 3817 10806 0.989 0.350
12 18 0:889 3829 10878 0.995 0.326
13 17 1:051 3844 10926 0.997 0.303
14 17 1:260 3892 11130 0.999 0.291
15 16 1:413 3911 11142 1.000 0.271
Table II. Optimal top-treatment and all-interesting-treatment designs asm0andv0vary (forıD0:25).
Optimal top-treatment design Optimal all-interesting-treatments design
95% quantile 95% quantile
m0 v0 K n1 c1 ES S S S K n1 c1 ES S S S
0:1 0:1 12 29 0:643 14177 41307 3 36 0:913 18309 53668
0:05 0:1 10 26 0:468 6907 19456 3 27 1:238 8625 25248
0 0:1 9 22 0:429 3806 10710 2 20 0:960 4526 12473
0:05 0:1 8 17 0:357 2350 5931 1 12 0:864 2700 7252
0:1 0:1 7 13 0:313 1607 3882 1 1 1:904 1754 4965
0 0:05 7 9 0:753 12012 35134 1 1 1.860 13276 38966
0 0.075 8 19 0:620 6347 17884 1 11 0.729 7304 21347
0 0.1 9 22 0:429 3806 10710 2 20 0.960 4526 12473
0 0.125 10 21 0:302 2629 7228 2 21 1.037 3146 8331
0 0.15 10 19 0:076 2019 5289 2 21 1.109 2417 6156
a good probability of passing a confirmatory trial as m0 increases. Also, as expected,ESSfalls as the
mean treatment effect increases.
As the prior standard deviation increases (withm0D0), the optimal values ofKandc1increase. For
small values ofv0, there is a lower chance of a treatment with a high treatment effect coming along in a
reasonable time, and so the whole procedure is likely to end with a treatment that has a low effect. That is, the phase III trials successes will often be false positives. For larger values ofv0, it is worth putting more
resources into the screening trial, as genuinely effective treatments may be found in a reasonable time.
3.2. All interesting treatments screening trials with single-stage multi-arm confirmatory studies
We next explore the optimal all-interesting-treatments designs (right-hand side of Table II). There are interesting differences between the optimal all-interesting-treatments design and the optimal top-treatment designs. The optimal K is always lower when multiple treatments can be taken forward. In addition, the optimal value ofc1is considerably higher than the previous. Both of these factors indicate
that fewer phase III trials will be carried out on average when an all-interesting-treatment screening design is used. However, when they are carried out, they have the potential to assess multiple treatments and hence be large.
A second important observation is thatESSis higher than for the top-treatment design for every set of prior parameters considered here. This is a surprising result, as one might think that allowing multiple treatments through to a phase III trial would be more flexible. However, these results indicate that the advantages of a greater chance of a particular phase III trial ending in success are outweighed by the largerSSrequired.
For some parameters, for example, when m0 D 0:1, the optimal screening design is to conduct a
screening trial with just one treatment and one patient allocated each to the control treatment and new treatment. The optimal value ofc1is fairly high (1.904). This would be an extremely unusual screening
trial to conduct, and increasing the value ofn1 to a more realistic level does not increase the expected
SSuntil phase III success by a great deal.
3.3. Top-treatment screening trials with group-sequential confirmatory trials
We used the methods shown in Section 2.3 to investigate the optimal screening designs for different values ofm0andv0when confirmatory trials are designed as two-stage trials by using triangular stopping
boundaries [24]. Triangular stopping boundaries are used, because they generally have good expected sample sizes for group-sequential [25] and MAMS trials [26].
Table III shows the expectedSSas different numbers of treatments are considered in the screening phase (form0 D0and v0 D 0:1). Comparing with Table III,ESSis consistently lower when
group-sequential confirmatory trials are used, as expected. The optimal value of n1 is also always lower,
indicating that it is optimal to gather less information on treatments in the screening stage. This seems reasonable as ineffective treatments can always be dropped early in the confirmatory trial. For a similar reason, the optimal value ofc1 is lower when group-sequential confirmatory trials are allowed. These
two factors indicate that the screening stage is less important–the first stage of the confirmatory trial serves as an additional screening step. The last difference is that the optimal value ofK is 8 instead of 9 so form0 D 0andv0 D 0:1using slightly fewer treatments is optimal, although the difference in
ESSbetweenKD8andKD9is very small. The 95% quantile of the sample size used is also shown, which, as in the single-stage confirmatory trial case, shows a similar pattern to theESS. The pattern of the 95% quantile is less clear in this case. This is likely because we used fewer simulation replicates to estimate the 95% quantile (compared with the single-stage case), as the group-sequential confirmatory trial increased the amount of computation required for each replicate.
Table II in the supplementary material shows the optimal screening designs asm0 varies and as v0
varies. A similar pattern is observed as above–the expectedSSis considerably lower with group sequen-tial confirmatory trials. Additionally, the optimal number of treatments, the optimal value ofn1, and the
optimal value ofc1are all generally lower.
3.4. All interesting treatments screening trials with multi-arm multi-stage confirmatory studies
[image:9.594.86.509.631.748.2]Next we looked at using the all-interesting-treatments screening design with one interim analysis (i.e. a MAMS confirmatory trial). Table II in the supplementary material shows the optimal screening trial designs asm0 andv0 vary. As for the top-treatment design, including an interim analysis in the
Table III. Optimal top-treatment screening trial parameters with two-stage confirmatory trials, expected sample size (ESS), the 95% quantile of the sample size (SS) (from 500,000 simulation replicates) and operating characteristics asKvaries form0D0, standard deviationv0D0:1, and completely randomized design for
confirmatory trialıD0:25.
K Optimaln1 Optimalc1 ES S 95% quantileS S Type I error Power
1 8 0.766 3626 10172 0.222 0.395
2 14 0.562 3405 9484 0.427 0.469
3 16 0.385 3290 9128 0.593 0.481
4 16 0.223 3222 8934 0.719 0.464
5 16 0.044 3181 8774 0.820 0.445
6 16 0:165 3157 8690 0.898 0.425
7 15 0:320 3144 8628 0.939 0.391
8 14 0:334 3140 8586 0.950 0.355
9 13 0:661 3141 8638 0.982 0.327
confirmatory trial considerably reducesESS. As before, it generally leads to the same or lower optimal number of treatments in the screening phase, and a lower value ofn1. Unlike the top-treatment design,
there is no consistent change inc1- sometimes it is increased, and sometimes decreased.
4. Case study
As an illustrating example, we consider CREST, an overview of which is given in Leidermanet al. [16]. CREST was a series of randomized controlled parallel group screening trials. Each trial compared one or more marketed medications to a placebo with the aim of reducing dependence on cocaine in addicts. A total of 19 experimental treatments were screened, although it is possible that with consideration of treatment combinations there would be many more regimens that could be screened. The aim was to recommend treatments to take forward for larger confirmatory trials, testing the same endpoints. Nine normally distributed endpoints were considered across all trials. A type-I error rate of 10% per end-point, not adjusted for multiple testing, was used, although no formal criteria are listed to determine if a treatment was successful enough to proceed to a larger trial.
We consider the sum of the nine outcomes as the endpoint of interest, which would be used to formally decide which treatments should be tested in confirmatory trials. Although this does not perfectly reflect what was done in reality, we feel it would reflect the spirit of the decision process used. For example, if several endpoints show moderately beneficial effects of an experimental treatment, that treatment would likely be more desirable to test further than a treatment for which a large positive effect had been observed on one endpoint and a large negative effect on another. If each endpoint has some relative importance attached to it, then a different composite endpoint that reflected this, such as a weighted average, could be used.
A series of articles in the same supplement as Leidermanet al. reported results of each trial. Included in each article are the means and standard deviations of each outcome for each treatment. We used these results to estimate the average mean treatment effect of an experimental treatment, m0, the standard
deviation of an individual patient’s treatment effect,, and the standard deviation of the treatment effects,
v0. We should note that the latter two quantities depend on the (unreported) correlation between
end-points. We assumed a correlation of 0.2 between each endpoint, which after standardizing to D1, gave values ofm0D 0:067andv0D0:165. As in previous sections, we assumed a confirmatory trial would
be powered for a 90% probability of detecting a standardized mean difference,ı, of 0.25 or more at a one-sided significance level of 0.025.
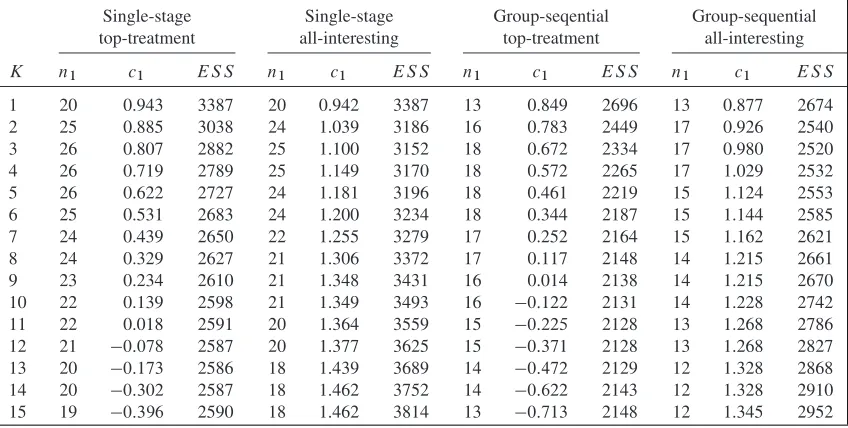
[image:10.594.85.509.536.750.2]We found optimal designs for all four classes of screening trial investigated as the number of experimental arms,K, varies. Table IV shows the parameters and expected sample sizes asKchanges.
Table IV. Optimal design parameters for the Cocaine Rapid Efficacy Screening Trial case-study with m0D 0:067,v0D0:165,ıD0:25.
Single-stage Single-stage Group-seqential Group-sequential top-treatment all-interesting top-treatment all-interesting
K n1 c1 ES S n1 c1 ES S n1 c1 ES S n1 c1 ES S
1 20 0.943 3387 20 0.942 3387 13 0.849 2696 13 0.877 2674
2 25 0.885 3038 24 1.039 3186 16 0.783 2449 17 0.926 2540
3 26 0.807 2882 25 1.100 3152 18 0.672 2334 17 0.980 2520
4 26 0.719 2789 25 1.149 3170 18 0.572 2265 17 1.029 2532
5 26 0.622 2727 24 1.181 3196 18 0.461 2219 15 1.124 2553
6 25 0.531 2683 24 1.200 3234 18 0.344 2187 15 1.144 2585
7 24 0.439 2650 22 1.255 3279 17 0.252 2164 15 1.162 2621
8 24 0.329 2627 21 1.306 3372 17 0.117 2148 14 1.215 2661
9 23 0.234 2610 21 1.348 3431 16 0.014 2138 14 1.215 2670
10 22 0.139 2598 21 1.349 3493 16 0:122 2131 14 1.228 2742 11 22 0.018 2591 20 1.364 3559 15 0:225 2128 13 1.268 2786
12 21 0:078 2587 20 1.377 3625 15 0:371 2128 13 1.268 2827
13 20 0:173 2586 18 1.439 3689 14 0:472 2129 12 1.328 2868
14 20 0:302 2587 18 1.462 3752 14 0:622 2143 12 1.328 2910
15 19 0:396 2590 18 1.462 3814 13 0:713 2148 12 1.345 2952
For the two top-treatment designs, the optimal number of experimental arms is high, equal to 13 and 11 for single-stage and two-stage confirmatory trials, respectively. The optimal number of arms for the all-interesting-treatments design is 3 in both cases. This broadly agrees with the result in the previ-ous section. In the actual CREST screening studies, a sample size of around 15 per arm was used. The number of experimental arms in each screening study varied between 1 and 4. This parameters are close to optimal if multiple experimental treatments are to be tested in the same confirmatory trial, but much smaller than optimal if just the top treatment goes ahead to a confirmatory trial.
We also investigated the treatment effect of the final recommended treatment for the four optimal screening designs in Table IV. In the case of a multi-arm confirmatory trial that recommends more than one treatment, we recorded the one with the higher final test statistic as the final recommended treatment. We simulated 100,000 replicates for each design. Interestingly, all four designs gave a very similar dis-tribution, with the median treatment effect of the confirmed treatment being around 0.2 in each case. The estimated probability of the final recommended treatment actually being worse than control ranges between 0.01 and 0.05. This is as compared with a per-study one-sided significance level of 0.025 used in the confirmatory study.
5. Discussion
In this article we have explored optimal design of multi-arm screening trials. A normally distributed end-point is assumed to allow analytic formulae to be derived. The methods could be extended to other types of endpoints for which normally distributed test statistics are available, such as binary and time-to-event. The problem can be formulated as a Bayesian decision–theoretic design with the aim to minimize the prior expected loss; the loss function in this case is taken to be the number of patients recruited before a treatment is found successful at the confirmatory trial. We investigated the top-treatment design, similar to that of Thallet al.[10], in which a maximum of one treatment may proceed to a confirmatory trial; the second is the all-interesting-treatments design, which allows multiple treatments to proceed to a con-firmatory trial. The top-treatment design is more efficient than the all-interesting-treatments design for all scenarios considered, with the optimal design generally including a large number of treatments with a relatively low number of patients per arm and a less strict test statistic threshold determining whether a confirmatory trial should be conducted. Interestingly for some designs the optimal critical value is negative, indicating that even if the best experimental treatment performs worse than the control treat-ment, it should still be tested in a confirmatory trial. This is clearly not ideal in real life, and shows that considerations other than efficiency should be taken into account in the design of screening trials.
In both classes of design, a control group is included in the screening stage. Theoretically it may be more efficient not to, but the procedure would then be prone to biases that are hard to quantify, such as patient drift. The patients included in the screening stage are also assumed not to be included in the con-firmatory trial (as opposed to a seamless phase II/III design). Despite a loss in efficiency, we consider separate screening and confirmatory trials here, as it is a more common approach. It also provides a chance to make changes to the confirmatory trial design and selection of treatment in response to new external information (for example, results from related trials being published). Because of the small number of patients in the screening trials examined here, the loss in efficiency is small.
In Stallard [2], minimizing the expected number of patients until a treatment is successful at a confirmatory trial is equivalent to maximizing the expected number of confirmed treatments found from a finite set of patients. When multiple treatments are tested simultaneously this equivalence is not true. Confirming more than one treatment might be desirable. For example, the different treatments may be more effective in different subgroups or have different side-effect profiles. In the supplemen-tary material, we investigate optimal screening designs when the optimality criterion is the expected number of confirmed treatments per recruited patient. By using that criterion, the optimal all-interesting-treatments design includes more all-interesting-treatments in the screening stage and is closer in efficiency to the top-treatment design. Many other metrics could be of interest, such as different quantiles of the sample size until confirmation trial success distribution, or the probability of a genuinely effective treatment being recommended. We chose to focus on the expected sample size until phase III success as it has a simple interpretation, is comparable between designs, and also reflects the amount of resources needed in the drug development process.
The top-treatment and all-interesting-treatment designs can be expressed as extreme cases of a more general screening design. An alternative, which would be an interesting area for research, would be to
include additional treatments in the confirmatory trial if the increase in predictive probability of con-firmatory trial success (given the screening data) compensates for the increase inSSrequired. In other words, one would predict theESSof the remaining process given the screening data for different numbers of treatments and choose the most efficient number of treatments to undergo a confirmatory trial.
A number of assumptions are made in this article, as discussed in the parallel-group setting [2]. One is that the treatment effects are identically distributed from a normal distribution. This assumption allows analytic formulae to be derived for the expected sample size. If one wanted to find optimal screening designs that allow for different prior distributions, then this could be accomplished using the simulation method. A second is that the same endpoint is used in both the screening and confirmatory trials, which is often not true but was for the CREST trial [16]. In the case of different endpoints, the treatment effect on the phase II endpoint would be correlated with the treatment effect on the phase III endpoint. Exploring how optimal screening designs differ when the endpoints used in screening and confirmatory is the subject of future research.
Acknowledgements
This work was funded by the UK Medical Research Council (grant numbers G0800860 and MR/J004979/1). This report is independent research arising in part from Dr. Jaki’s Career Development Fellowship (NIHR-CDF-2010-03-32) supported by the National Institute for Health Research. The views expressed in this publication are those of the authors and not necessarily those of the National Health Service, and the National Institute for Health Research or the Department of Health. We thank the two anonymous reviewers for their helpful comments that improved the article.
References
1. DiMasi J, Hansen R, Grabowski H. The price of innovation: new estimates of drug development costs.Journal of Health Economics2003;22:151–185.
2. Stallard N. Optimal sample sizes for phase II clinical trials and pilot studies.Statistics in Medicine2012;31:1031–1042. 3. Whitehead J. Designing phase II studies in the context of a program of clinical research.Biometrics1985;41:373–383. 4. Whitehead J. Sample sizes for phase II and phase III clinical trials: an integrated approach.Statistics in Medicine1986;
5:459–464.
5. Julious S. Sample size of 12 per group rule of thumb for a pilot study.Pharmaceutical Statistics2005;4:287–291. 6. Sydes MR, Parmar MKB, James ND, Clarke NW, Dearnaley DP, Mason MD, Morgan RC, Sanders K, Royston P. Issues
in applying multi-arm multi-stage methodology to a clinical trial in prostate cancer: the MRC STAMPEDE trial.Trials 2009;10. DOI: 10.1186/1745-6215-10-39.
7. Royston P, Parmar M, Qian W. Novel designs for multi-arm clinical trials with survival outcomes with an application in ovarian cancer.Statistics in Medicine2003;22:2239–2256. DOI: 10.1002/sim.1430.
8. Magirr D, Jaki T, Whitehead J. A generalized Dunnett test for multiarm-multistage clinical studies with treatment selection.Biometrika2012;99:494–501. DOI: 10.1093/biomet/ass002.
9. Thall P, Simon R, Ellenberg S. Two-stage selection and testing designs for comparative clinical trials.Biometrika1988; 75:303–310.
10. Thall P, Simon R, Ellenberg S. A two-stage design for choosing among several experimental treatments and a control in clinical trials.Biometrics1989;45:537–547.
11. Posch M, Konig F, Branson M, Brannath W, Dunger-Baldauf C, Bauer P. Testing and estimation in flexible group sequential designs with adaptive treatment selection.Statistics in Medicine2005;24:3697–3714. DOI: 10.1002/sim.2389. 12. Friede T, Stallard N. A comparison of methods for adaptive treatment selection.Biometrical Journal2008;50:767–781.
DOI: 10.1002/bimj.200710453.
13. Stallard N, Friede T. A group-sequential design for clinical trials with treatment selection.Statistics in Medicine2008; 27:6209–6227. DOI: 10.1002/sim.3436.
14. Bretz F, Konig F, Brannath W, Glimm E, Posch M. Adaptive designs for confirmatory clinical trials.Statistics in Medicine 2009;28:1181–1217. DOI: 10.1002/sim.3538.
15. Wassmer G. On sample size determination in multi-armed confirmatory adaptive designs.Journal of Biopharmaceutical Statistics2011;21:802–817. DOI: 10.1080/10543406.2011.551336.
16. Leiderman DB, Shoptaw S, Montgomery A, Bloch DA, Elkashef A, LoCastro J, Vocci F. Cocaine rapid efficacy screening trial (CREST): a paradigm for the controlled evaluation of candidate medications for cocaine dependence.Addiction2005; 100(Suppl 1):1–11.
17. Phillips PP, Gillespie SH, Boeree M, Heinrich N, Aarnoutse R, McHugh T, Pletschette M, Lienhardt C, Hafner R, Mgone C, Zumla A, Nunn AJ, Hoelscher M. Innovative trials designs are practical solutions for improving the treatment of tuberculosis.Journal of Infecticious Diseases2012;205(Suppl 2):250–257.
18. Hahn T, Bouvier A, Kiêu K. R2cuba: multidimensional numerical integration, 2010. URL http://CRAN.R-project.org/ package=R2Cuba, R package version 1.0-6 [Accessed on August 3 2012].
19. R Development Core Team.R: A Language and Environment for Statistical Computing. R Foundation for Statistical Computing: Vienna, Austria, 2011. URL http://www.R-project.org, ISBN 3-900051-07-0 [Accessed on August 3 2012].
20. Nelder J, Mead R. A simplex method for function minimization.The Computer Journal1965;7:308–313.
21. Wason J, Magirr D, Law M, Jaki T. Some recommendations for multi-arm multi-stage trials.Accepted by Statistical Methods in Medical Research2013. DOI: 10.1177/0962280212465498.
22. Genz A, Bretz F. Methods for the computation of multivariate t-probabilities.Journal of Computational and Graphical Statistics2002;11:950–971.
23. Jennison C, Turnbull B.Group Sequential Methods with Applications to Clinical Trials. Chapman and Hall: Boca Raton, FL, 2000.
24. Whitehead J, Stratton I. Group sequential clinical trials with triangular continuation regions.Biometrics1983;39:227–236. 25. Wason J, Mander A, Thompson S. Optimal multi-stage designs for randomised clinical trials with continuous outcomes.
Statistics in Medicine2012;31:301–312. DOI: 10.1002/sim.4421.
26. Wason J, Jaki T. Optimal design of multi-arm multi-stage trials.Statistics in Medicine2012;31:4269–4279.