Munich Personal RePEc Archive
Older entrepreneurs-by-necessity using
fuzzy set methods: differences between
developed and developing countries
Molina, Jose Alberto and Ortega, Raquel and Velilla, Jorge
University of Zaragoza, BIFI, IZA, University of Zaragoza,
University of Zaragoza
20 February 2017
Online at
https://mpra.ub.uni-muenchen.de/76982/
Older entrepreneurs-by-necessity using fuzzy set methods:
differences between developed and developing countries
*José Alberto Molina
University of Zaragoza (Spain), BIFI (Spain) and IZA (Germany)
Raquel Ortega
University of Zaragoza (Spain)
Jorge Velilla
University of Zaragoza (Spain)
Abstract
In this paper, we empirically analyze the individual characteristics that drive older workers to become entrepreneurs, more by necessity than desire, providing evidence of the differences between developed and developing countries. While OLS models do not provide any meaningful conclusions, Qualitative Comparative Analysis and fuzzy set logic, at the country level, using GEM 2014 Global Individual micro-data, show the importance of the various combinations of high and/or low values of skills, opportunities, entrepreneurial perceptions, peer effects, and satisfaction with life and income. This indicates how entrepreneurship may be a potential source of income for older workers, in a range of contexts. Further, we find that all the possible combinations of higher values of the latter features are necessity conditions.
Keywords: Entrepreneurship, Older individuals, Fuzzy Set Qualitative Comparative Analysis, GEM data.
*
This paper was partially written while Raquel Ortega was Visiting Scholar at the Carroll School of Management of Boston College (US), to which she would like to express her thanks for the hospitality and facilities provided. We are grateful to comments from Alicia Coduras. This paper has benefited from funding from the “Cátedra Emprender” (Universidad de Zaragoza-Fundación Emprender en Aragón).
1. Introduction
Entrepreneurship is an activity that is traditionally associated with economic growth
and development, and public policies and institutions have consequently devoted efforts
to promote such activity (Minniti, 2008; Shane, 2009). Furthermore, the recent
economic crisis has increased the role of entrepreneurship as a driver of development
and economic recovery. It is well stablished in the literature that institutions and the
environment play a major role in determining entrepreneurship (i.e., the institutional
theory, North, 1990). However, entrepreneurship by necessity has not been found to
benefit from the actions of institutions (Fuentelsaz et al., 2015). In this context,
individual attributes may play an important role in determining what forces workers to
become entrepreneurs by necessity.1 For instance, although some authors have found
that entrepreneurship is generally associated with younger individuals (Schott and
Bagger, 2004; Kelley, 2009; Wennekers et al., 2010), third-age entrepreneurship cannot
be considered as a marginal activity (Kautonen, 2008; Kautonen et al., 2011).2 Further,
Kautonen (2008) reveals that the entrepreneurial activity of the elder population is an
under-researched area and needs to be studied more deeply. Thus, the present paper
bridges this gap, addressing the question of what are the individual characteristics that
determine entrepreneurial behavior, by necessity, of older individuals, providing
empirical evidence for both developed and developing countries.
We use the Global Entrepreneurship Monitor (GEM) 2014 Global Individual
database, “the world’s foremost study of entrepreneurship”
(http://www.gemconsortium.org), and GEM experts provide to the scientific community
high quality data and reports in order to analyze, promote, and understand global
entrepreneurial activity (see Singer, Amoros and Moska, 2015, for a recent report on
GEM analyses). Regarding the methodology, because classical quantitative regression
analyses may offer a limited range of results, and causal effects cannot be derived from
them, we develop a fuzzy set Qualitative Comparative Analysis (fsQCA). FsQCA is a
qualitative technique designed to find causal relationships, which offers a different
1
Several concepts of entrepreneurship have appeared in the literature, but - especially in the last decade - a classification from the perspective of different motivations for becoming an entrepreneur has generated much interest. This classification is consolidated in the work of Reynolds et al. (2003), who distinguish between opportunity-driven and necessity-driven entrepreneurs (that is, between those who take advantage of a business opportunity, and those who have no other alternative for work).
2
perspective from regression analyses (Woodside, Ko and Huan, 2012; Ragin and Stand,
2014). These techniques complement classical analyses and help to find different results
that, otherwise, could not be captured. From the point of view of inference and
economic policy, fsQCA represents a major advantage, since it allows us to analyze
causality, which cannot be determined using cross-sectional quantitative models. Fuzzy
set logic is an underused tool in economic and business issues, although it has recently
gained in importance (see Roig-Tierno, Kun-Huang and Ribeiro-Soriano, 2016). In spite
of that, few analyses have used this technique to study entrepreneurship (e.g., Beynon,
Jones and Pickernell, 2016; and Kuckertz, Berger and Mpeqa, 2016). To the best of the
authors’ knowledge, only Coduras et al. (2015) and Velilla and Ortega (2017) have
applied this to GEM data, and none have studied necessity entrepreneurship.
We analyze the differences between developed and developing countries, in terms
of entrepreneurial behavior by necessity of third-age workers, using the following
variables of the GEM data: skills to be an entrepreneur, opportunities to become an
entrepreneur, peer effects, entrepreneurial perception, income satisfaction, and life
satisfaction, all aggregated at the country level. We find that, while regression analyses
do not yield significant results, fsQCA offers a range of causal determinants of high
levels of entrepreneurship by necessity among older individuals, for both developed and
developing countries. In particular, the developed countries are characterized by the role
of high levels of skill, fewer opportunities, and different combinations of high and low
satisfaction. On the other hand, in the developing countries, more complex patterns
emerge, indicating the importance and complexity of entrepreneurship due to necessity.
Furthermore, we find that, in both developed and developing countries, high levels of
all the possible combinations of the selected features are necessarily derived from high
levels of entrepreneurship by necessity.
Thus, our contribution is threefold. First, we analyze entrepreneurship by necessity
among the third-age population, using qualitative techniques that are underused in the
literature. Second, our results contribute by identifying certain aspects of the
entrepreneurial behavior of older workers that may have gone unnoticed in classical
cross-sectional models. This is important because it facilitates an understanding of the
complex phenomenon that is entrepreneurship (Coduras et al, 2015). Finally, fsQCA
results deal with causal relationships, which is especially important in developing
The rest of the paper is organized as follows: Section 2 describes the data and the
fuzzy set transformation, Section 3 sets out our empirical strategy and results, and
Section 4 contains our main conclusions.
2. Data and variables
2.1. Data
We use the GEM Global Individual data for the year 2014 to analyze the
relationship between entrepreneurship by necessity among older individuals, and a
series of individual attributes related to individual entrepreneurial behavior. The
database is produced annually by GEM and contains information on nine groups of
variables of national, socio-economic characteristics related to the encouragement of
entrepreneurship. This data is based on surveys filled out by respondents from a range
of countries, using stylized questions. (More information can be found in
http://gemconsortium.org/wiki.) The advantage of using this source is that GEM is the
leading global entity analyzing entrepreneurship, and the data is elaborated and
processed by experts in the field. Further, GEM’s definition of entrepreneurs, and
entrepreneurs by necessity, avoids sample selection.
We transform the variables into dummies, and maintain the mean value of each, by
country. That way, for each country, we define the mean value of the corresponding
variables. We sample individuals over age 55, living in the following 28 developed
countries: United States, Russia, Greece, the Netherlands, Belgium, France, Spain,
Hungary, Switzerland, Sweden, Norway, Poland, Germany, Mexico, Chile, Japan,
Korea, China, Canada, Portugal, Luxembourg, Ireland, Finland, Estonia, Slovenia, the
Czech Republic, Slovakia, and Israel; ad in the following 28 developing countries:
South Africa, Romania, Peru, Argentina, Brazil, Colombia, Malaysia, Indonesia, the
Philippines, Singapore, Thailand, Vietnam, India, Iran, Lithuania, Latvia, Croatia,
Bosnia and Herzegovina, Macedonia, Guatemala, Panama, Ecuador, Surinam, Uruguay,
Puerto Rico, Trinidad and Tobago, Jamaica, and Taiwan.
The variable of interest is the fact of being an entrepreneur by necessity or, in our
country-level aggregated context, the probability of being an entrepreneur by necessity,
conditioned on being over age 55. It is important to note that the GEM data directly
variable “tea09nec”, labeled as being “involved in necessity early-stage entrepreneurial
activity”). For instance, the fsQCA methodology requires a selection of a relatively
small number of features, due to the exponentially-increasing computational costs
(given n features, fsQCA analyzes all the 2 combinations). The independent variables
selected for the analysis are the following, all representing individual-level attributes: 1)
“Skills”, measuring the self-evaluation of individuals regarding their own
entrepreneurial skills (Kotsova, 1997; Minniti, 2009; Levie and Autio, 2013; Brixiova et
al., 2015; Kyrö, 2015). 2) “Opport”, measuring whether individuals consider that there
are opportunities for them to start a business in the short terms. These variable aims to
capture the combination of both necessity and opportunity motivations to begin an
entrepreneurial activity (Reynolds et al., 2013). 3) “Peer”, measuring peer effects, i.e.,
whether knowing other entrepreneurs may determine the entrepreneurial behavior of
workers (Holcomb et al., 2009; Gimenez-Nadal et al., 2016; Okumura and Usui, 2016).
In the same line, the ‘learning by seeing’ has been found to determine the
entrepreneurial behavior of individuals (Blumberg and Pfann, 2015; Viinikainen et al.,
2016). 4) “Perception”, measuring individuals’ perceptions of the social valuation of
entrepreneurship (Minniti, 2005; Terjesen and Szerb, 2008; Roskruge et al., 2016). 5)
“Satinc”, and 6) “Satlife”, measuring individuals’ satisfaction with their income and
their life, respectively. These two features are important in order to model
entrepreneurial activity, since such activity can depend on the financial and,
consequently, psychological status of individuals (Sobel, 2008; Dawson et al., 2015;
Molina et al., 2016).
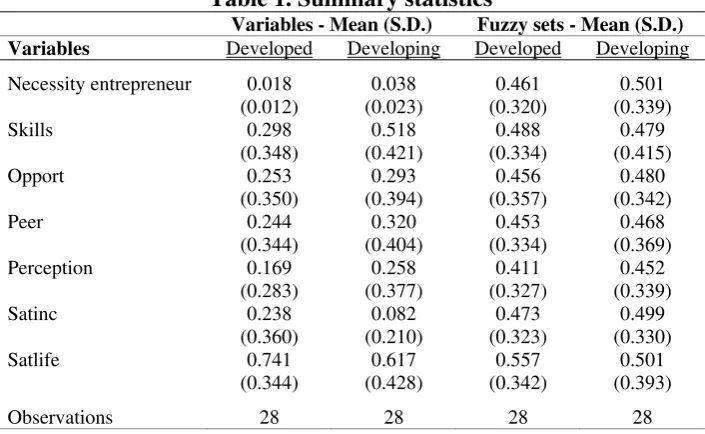
Table 1 shows summary statistics of the variables, for both developed and
developing countries. We find that, on average, only 1.8% of the older individuals in the
sample are necessity entrepreneurs, in the developed countries, vs. 3.8% in the
developing countries. Further, 29.8% (51.8%) of individuals in the developed
(developing) countries consider themselves to have the required skills to be
entrepreneurs, and 25.3% (29.3%) think that there will be opportunities to start a
business in the short term, and 24.4% of individuals in the developed countries have
contact with entrepreneurs, vs. 32.2% in the developing countries. These data show
how, in the developing countries, there is greater confidence about entrepreneurship, in
line with the higher levels of entrepreneurship. Further, there is also a higher social
high social perception of entrepreneurs) than in the developed countries (16.9%). On the
other hand, regarding the satisfaction features, Table 1 shows how individuals in the
developing countries are more satisfied with their income (23.8%, vs 8.2% in the
developing countries), and with their lives (74.1% vs. 61.7%, respectively).
2.2. Fuzzy sets
A fuzzy set is a type of variable that measures, in the range (0, 1), the degree of
belonging to a group, or the fulfilment of a characteristic. The difference from a
categorical variable is that a fuzzy set constitutes a continuum of scores, and is not
restricted to a fixed number of categories. Because of that generalization, some authors
have used fuzzy sets rather than classical variables, due to their greater degree of
precision as a modelling tool (Velilla and Ortega, 2017). It is important to define the
middle point, 0.5, as the inflexion point in the fulfilment/belonging process, because
this value constitutes the point at which an observation is neutral for the corresponding
characteristic.
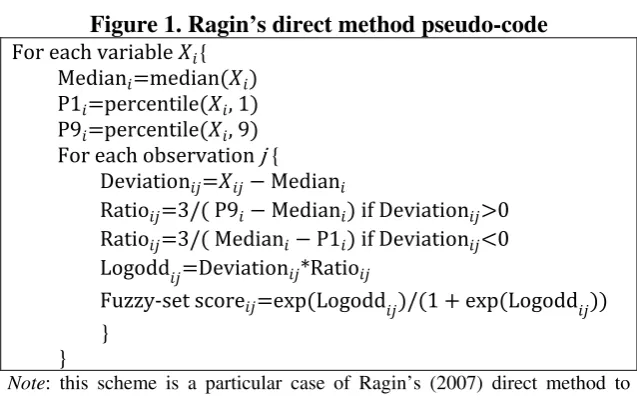
Fuzzy sets are defined from the aggregated variables following Ragin’s (2007)
direct method (Coduras, Clemente and Ruiz, 2015; Velilla and Ortega, 2017). This
methodology is based on three key measures for each variable: the inflexion point (the
median value of the original variable, corresponding to the score 0.5 of the fuzzy set),
and the upper and lower bounds of belonging, which are defined as the first and ninth
deciles of the original variable. Deviations to the medians are calculated, and also a
ratio, defined as a quotient, dependent on medians and percentiles and depending on
which values are greater or lower than the median. The product of the latter ratios and
the deviations from the median are defined as the log-odd ratios, which are then
transformed into the fuzzy set scores by an exponential transformation. A schedule of
this process is shown in Figure 1. Table 1 shows summary statistics of the fuzzy sets,
for both developed and developing countries. It is observed that the mean values are
3. Empirical analysis
We now analyze, using econometric and statistical models, the entrepreneurial
behavior of individuals motivated by necessity, providing evidence of the differences
between developed and developing countries. Following Coduras, Clemente and Ruiz
(2015) and Velilla and Ortega (2017), we first propose a classical quantitative
regression analysis and, then, compare results with a fuzzy set Qualitative Comparative
Analysis. We propose the following model:
Necessity entrep.= f(skills, opport, peer, perception, satinc, satlife). (1)
3.1. Regression analysis
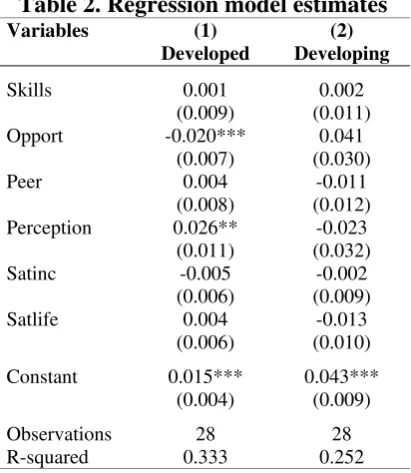
We first estimate a linear OLS model of (1), i.e., a model of the probability of being
an entrepreneur by necessity, as a function of the selected variables, differentiating
between developing and developed countries. Columns 1 and 2 in Table 2 show
estimates of the model for the developed and developing countries, respectively. It is
observed that, for the developed countries, only opportunities and perception are related
to necessity entrepreneurship, and opportunities are negatively related. This may be
caused by the fact of analyzing entrepreneurship by necessity, indicating that those who
are entrepreneurs because they consider that there are opportunities to start a new
business do not belong to the group of necessity entrepreneurs. That is to say,
opportunity and necessity may be disjointed motivations to become an entrepreneur. On
the other hand, perception is found to be positively related to necessity
entrepreneurship, indicating that, in countries where social consideration of
entrepreneurship is higher, older individuals who cannot find an employer find
entrepreneurship to be an alternative source of income.
In the case of the developing countries, any feature is found to be significantly
associated with entrepreneurship due to necessity. This may indicate that, in these
countries, older individuals that need income may become entrepreneurs ‘no matter
what’, in line with the conclusions of Velilla and Ortega (2017) regarding macro-level
3.2. Fuzzy set Qualitative Comparative Analysis
OLS models are characterised by certain restrictions, and can model only linear
relationships, and it may be that different approaches would lead to different results.
Using the fuzzy sets defined in the previous section, we propose an fsQCA model for
developing and developed countries, to analyze the differences among both groups3 .
FsQCA is a qualitative technique that, using fuzzy set scores, aims to determine causal
relationships between an outcome variable and the possible combinations of a series of
features (Ragin and Stand, 2014). This kind of methodology is not better, nor worse
than the classical quantitative approaches, but it does provide a different perspective
that complements classical analyses and helps to find different results that, otherwise,
could not be captured (Woodside, Ko and Huan 2012). In any case, from the point of
view of inference and economic policy, fsQCA represents a major advantage since it
allows us to analyze causality, which cannot be analyzed using cross-sectional
quantitative models.
A complete description of fsQCA can be read in Ragin (2008). The sufficient
conditions analysis is based on the identification of the causal relationships between the
outcome variable and all the combinations of features, and the construction of a ‘Truth
Table’ (Quine-McCluskey procedure). Then, each relationship is evaluated by its
consistency, defined as follows:
consistency ⇒ ∑ min ,∑ , 2
where represents the membership scores in a combination of features, and the
membership scores of the outcome variable (see Kosko and Isaka, 1993; Ragin, 2006;
Smithson and Verkuilen, 2006). On the other hand, the sufficient condition analysis is
also based on the identification of consistencies, now defined as:
consistency ⇒ ∑ min ,∑ , 3
with and as above. For both types of analysis, the cutoff consistency value that
determines the causal relevant relationships is fixed at 0.75, with this value being
dependent on the degree of stringency of solutions (generally between 0.7 and 0.8;
Ragin, 2008).
3
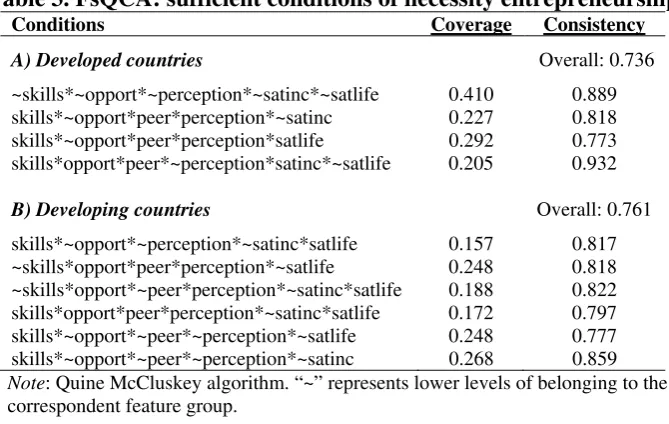
Table 3 shows the different results of the sufficient conditions analysis, using the
Quine McCluskey algorithm, for the developed and developing countries. It must be
noted that the sign “~” indicates “low levels of the fuzzy set”. We find that, for the
developed countries, four sufficient conditions emerge:
1) Low levels of skill, no opportunities, low perception, and low life- and
income-satisfaction. That means that individuals with low levels of wellbeing may be
entrepreneurs even when they do not exhibit entrepreneurial behavior.
2) Lower valuation of skills, high perception of entrepreneurship, high presence of peer
effects, and low incomes.
3) Analogous to 2), but with a higher valuation of life. 2) and 3) indicate that, in
countries where older individuals have a low evaluation of their incomes, or highly
value their life, entrepreneurship by necessity is derived. This is clear, since individuals
with low incomes may establish a business in order to improve their income. On the
other hand, individuals with a higher life-satisfaction may be entrepreneurs by
necessity, but can also be motivated by their good conditions of life, since
entrepreneurship is a risk activity.
4) High valuation of skills and opportunity, peer effects, and high income satisfaction,
and low entrepreneurial perception and life satisfaction. This pattern may indicate that
skills and opportunity are not completely disjointed options, in contrast with the
deductions made from the regression analysis estimates: under certain circumstances
(the influence of peer effects, and comfortable incomes, but an uncomfortable life),
individuals may be entrepreneurs by necessity only if they consider they have the
opportunity to do so.
For the case of the developing countries, six sufficient conditions for high-necessity
entrepreneurial levels among the elderly are found:
1) High levels of skills and life satisfaction, low levels of opportunities, perception, and
income satisfaction. This is a clear result of how older individuals turn to
entrepreneurship to get income, if they consider to have the skills, and their life is
sufficiently satisfied to tolerate the risk entailed.
2) Low level of skills and life satisfaction, and high levels of opportunities, perception,
and peer effects. This condition shows how the four latter features may counteract the
3) Low levels of skill, peer effects, and income satisfaction, and high levels of
opportunities, perception, and life satisfaction. This shows again the role of well-being,
which, when combined with perception and opportunities, leads individuals with low
income to find in entrepreneurship a way to increase their wealth, even with low skills,
in line with 2).
4) High levels of all features, except for low income-satisfaction. This result gives
empirical support to the condition in which all the features imply what is theoretically
assumed.
5) High levels of skill, low levels of opportunities, perception, and life satisfaction, and
no peer effects.
6) Analogous to 5), but switching life-satisfaction for income- satisfaction. These two
latter results highlight again that skills are a powerful determinant of entrepreneurship.
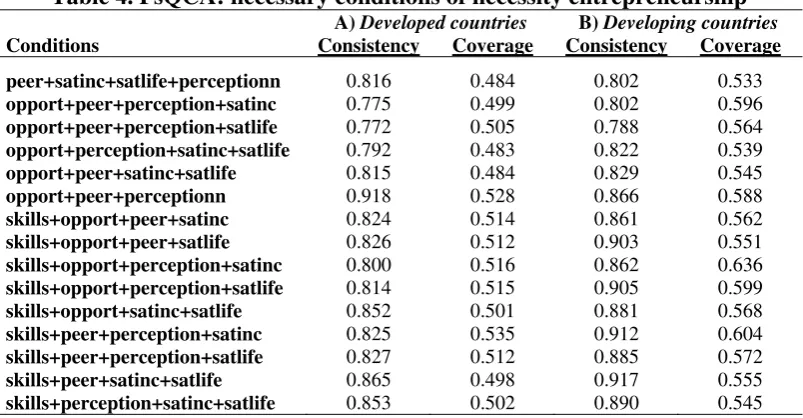
Table 4 shows the results of the necessary conditions analysis, using all possible
combinations of the features, by groups of 4.4
It is observed that all 15 possible
combinations are necessary conditions, for both the developed and the developing
countries. That is to say, being a country that belongs to the group of countries with
high levels of entrepreneurship by necessity in the third age, implies that at least four of
the six features considered are also at high levels.
4. Conclusions
While entrepreneurship is a complex (though heavily analyzed) phenomenon,
generally associated with youth, older workers also constitute a meaningful segment of
the entrepreneur community. Further, the behavior of older entrepreneurs has been
barely analyzed in comparison with the latter. Prior evidence shows that third- and
prime-age workers may see entrepreneurship from different perspectives, leading to
different mechanisms behind their respective entrepreneurial behaviors (Kautonen,
2008; Kautonen et al., 2011).
Under these circumstances, in this paper we empirically analyze, using the GEM
2014 Global Individual database aggregated at country level, the entrepreneurial
4
behavior by necessity of third-age workers, showing empirical differences between the
developed and developing countries. Using both OLS quantitative models, and fuzzy set
Qualitative Comparative Analysis, we find that, while the former do not show any
meaningful results, several entrepreneurial patterns emerged from the latter. High
valuation of skills and low perception of opportunities, combined with high and low
entrepreneurial perceptions and income- and life-satisfaction, determine the level of
entrepreneurship by necessity in the developed countries. This may help to identify
those third-age workers who are more prone to start a business, with the subsequent
consequences at the institutional level. However, patterns in the developing countries
are more complex, indicating that entrepreneurship among the third-age workers may be
a more common choice for those who cannot find an employer.
One limitation of the analysis may emerge from the fact that fsQCA is
computationally and conceptually limited to small groups of independent variables.
Thus, unobserved heterogeneity may play an important role, with any un-considered
variables significantly determining the necessity-entrepreneurial behavior of older
References
Beynon, M.J., Jones, P. and D. Pickernell (2016). “Country-Based Comparison Analysis Using fsQCA Investigating Entrepreneurial Attitudes and Activity”.
Journal of Business Research, 69, 1271–1276.
Block, J. and P. Koellinger (2009). “I can’t get no satisfaction – Necessity entrepreneurship and procedural utility”. Kyklos 62(2), 191-209.
Blumberg, B. and G. Pfann (2015). “Roads leading to self-employment: comparing
transgenerational entrepreneurs and self-made starts-ups”. IZA DP 9155.
Brixiova, Z., Ncube, M. and Z. Bicaba. (2015). “Skills and youth entrepreneurship in Africa: Analysis with evidence from Swaziland”. World Development, 67, 11-26.
Coduras, A., Clemente, J. A. and Ruiz, J. (2015) "A Novel Application of Fuzzy-Set
Qualitative Comparative Analysis to GEM Data", Journal of Business Research,
69(4), pp. 1265–1270.
Dawson, C., de Meza, D., Henley, A. and G.R. Arabsheibani (2015). "The power of (non) positive thinking: self- employed pessimists earn more than optimists". IZA Discussion Paper 9242.
Fuentelsaz, L., González, C., Maícas, J.P. and J. Montero (2015). “How different formal institutions affect opportunity and necessity entrepreneurship”. Business Research Quarterly, 18(4), 246-258.
Giménez-Nadal, J. I., Lafuente, M., Molina, J.A. and J. Velilla. (2016). “Resampling and Bootstrap to Assess the Relevance of Variables: A New Algorithmic Approach with Applications to Entrepreneurship Data.” IZA Discussion Paper 9938.
Holcomb, T.R., Ireland, R.D., Holmes, R.M. and M.A. Hitt (2009). “Architecture of
entrepreneurial learning: exploring the link among heuristics, knowledge, and
action". Entrepreneurship Theory and Practice, 33, 167-192.
Kautonen, T. (2008). “Understanding the older entrepreneur: Comparing third age and
prime age entrepreneurs in Finalnd”. International Journal of Business Science and
Applied Management, 3(3), 3-13.
Kautonen, T., Tornikoski, E. T. and E. Kibler (2011). “Entrepreneurial intentions in the
third age: the impact of perceived age norms”. Small business economics, 37(2),
219-234.
perceptions,” Babson Faculty Research Working Papers no. 49.
Kosko, B. and Isaka, S. (1993) "Fuzzy-Logic", Scientific American, pp. 76–81.
Available at: http://sipi.usc.edu/~kosko/Scientific American.pdf.
Kotsova, T. (1997). "Country institutional profiles concept and measurement". Academy of Management Proceedings, 97, 180-184.
Kuckertz, A., Berger, E. S., and A. Mpeqa (2016). “The More the Merrier? Economic Freedom and Entrepreneurial Activity”. Journal of Business Research, 69, 1288– 1293.
Kyrö, P. (2015). "The conceptual contribution of education to research on entrepreneurship education". Entrepreneurship and Regional Development, 27, 599-618.
Levie, J. and E. Autio (2013). "Growth and growth intentions: A meta-analysis of existing evidence". Enterprise Research Centre, ERC White Papers No. 1.
Minniti, M. (2005). “Entrepreneurship and network externalities”. Journal of Economic
Behaviour & Organization, 57, 1-27.
Minniti, M. (2008). “The role of government policy on entrepreneurial activity:
productive, unproductive, or destructive?” Entrepreneurship Theory and Practice,
32(5), 779-790.
Minniti, M. (2009). "Gender issues in entrepreneurship". Foundations and Trends in Entrepreneurship, 5, 497-621.
Molina, J.A., Velilla, J. and R. Ortega (2016). "The decision to become an entrepreneur
in Spain: the role of household finances". International Journal of
Entrepreneurship,20(1), pp. 57-73.
Naudé, W. (2016). “Is European Entrepreneurship in Crisis?” IZA DP 9817.
North, D.C. (1986). “The new institutional economics”. Journal of Institutional and
Theoretical Economics, 142(1), 230-237.
Okumura, T., and E. Usui (2016). “Intergenerational Transmission of Skills and
Differences in Labor Market Outcomes for Blacks and Whites”. IZA DP 9662.
Ragin, C. C. (2006) "Set relations in social research: Evaluating their consistency and
coverage", Political Analysis, 14(3), pp. 291–310. doi: 10.1093/pan/mpj019.
of Political Science, 2.
Ragin, C. C. (2008) "Qualitative Comparative Analysis Using Fuzzy Sets (fsQCA)",
Configurational Comparative Analysis, pp. 87–121. doi:
http://dx.doi.org/10.4135/9781452226569.n5 Print.
Ragin, C. C. and Stand, D. (2014) "fs/QCA [Computer Software] Version 2.5", p.
Irvine, CA: University of California.
Reynolds, P., Bygrave, W.D., Autio, E., Cox, L.W. and M. Hay (2003). Global Entrepreneurship Monitor 2002 exclusive report. Wellesley, MA: Babson College.
Roig-Tierno, N., Kun-Huang, H, and D. Ribeiro-Soriano (2016). “Qualitative Comparative Analysis: Crisp and Fuzzy Sets in Business and Management”.
Journal of Business Research, 69, 1261–1264.
Roskruge, M.J., Poot, J., and L. King (2016). “Social capital, entrepreneurship and
living standards: differences between immigrants and the native born”. IZA DP
9874.
Schott, T. and T. Bager (2004). “Growth expectations by entrepreneurs in nascent firms,
baby business and mature firms,” in T. Bager and M. Hancock (eds.), The growth of
Danish firms (Part 2 of the Global Entrepreneurship Monitor). Copenhagen, DK:
Borsens Forlag, pp. 219-230.
Shane, S. (2009). “Why encouraging more people to become entrepreneurs is bad public
policy”. Small Business Economics, 33, 141-149.
Singer, S., Amoros, J.E. and D. Moska (2015). GEM 2014 Global Report.
Smithson, M. and Verkuilen, J. (2006) Fuzzy set theory: Applications in the social
sciences. (No. 147). Sage.
Sobel, R.S. (2008). "Testing Baumol: Institutional quality and the productivity of entrepreneurship", Journal of Business Venturing, 23, pp. 641-655.
Terjesen, S. and L. Szerb (2008). “Dice thrown from the beginning? An empirical
investigation of firm level growth expectations”. Estudios de Economía, 35,
157-178.
Velilla, J. and Ortega, R. (2017) "Determinants of entrepreneurship using fuzzy set
methods: Europe vs. non-Europe", Applied Economics Letters. doi:
Wennekers, S., Van Stel, A., Carree, M. and R. Thurik (2010). The Relationship
between Entrepreneurship and Economic Development: is it U-shaped?. Now
Publishers Inc.
Viinikainen, J., Heineck, G., Bockerman, P., Hintsanen, M. and O. Raitakar (2016).
“Born entrepreneur? Adolescents' personality characteristics and self-employment
in adulthood”. IZA DP 9805.
Woodside, A. G., Ko, E. and Huan., T. C. (2012) "The New Logic in Building
Isomorphic Theory of Management Decision Realities", Management Decision,
Figure 1. Ragin’s direct method pseudo-code
For each variable { Median median P1 percentile , 1 P9 percentile , 9 For each observation j{
Deviation Median
Ratio 3/ P9 Median if Deviation 0
Ratio 3/ Median P1 if Deviation 0
Logodd Deviation *Ratio
Fuzzy‐set score exp Logodd / 1 exp Logodd }
}
Note: this scheme is a particular case of Ragin’s (2007) direct method to
Table 1. Summary statistics
Variables - Mean (S.D.) Fuzzy sets - Mean (S.D.) Variables Developed Developing Developed Developing
Necessity entrepreneur 0.018
(0.012) 0.038 (0.023) 0.461 (0.320) 0.501 (0.339) Skills 0.298 (0.348) 0.518 (0.421) 0.488 (0.334) 0.479 (0.415) Opport 0.253 (0.350) 0.293 (0.394) 0.456 (0.357) 0.480 (0.342) Peer 0.244 (0.344) 0.320 (0.404) 0.453 (0.334) 0.468 (0.369) Perception 0.169 (0.283) 0.258 (0.377) 0.411 (0.327) 0.452 (0.339) Satinc 0.238 (0.360) 0.082 (0.210) 0.473 (0.323) 0.499 (0.330) Satlife 0.741 (0.344) 0.617 (0.428) 0.557 (0.342) 0.501 (0.393)
Observations 28 28 28 28
Table 2. Regression model estimates
Variables (1) Developed
(2) Developing
Skills 0.001 0.002
(0.009) (0.011)
Opport -0.020*** 0.041
(0.007) (0.030)
Peer 0.004 -0.011
(0.008) (0.012)
Perception 0.026** -0.023
(0.011) (0.032)
Satinc -0.005 -0.002
(0.006) (0.009)
Satlife 0.004 -0.013
(0.006) (0.010)
Constant 0.015*** 0.043***
(0.004) (0.009)
Observations 28 28
R-squared 0.333 0.252
Note: Robust standard errors in parentheses.
Table 3. FsQCA: sufficient conditions of necessity entrepreneurship
Conditions Coverage Consistency
A) Developed countries Overall: 0.736
~skills*~opport*~perception*~satinc*~satlife 0.410 0.889
skills*~opport*peer*perception*~satinc 0.227 0.818
skills*~opport*peer*perception*satlife 0.292 0.773
skills*opport*peer*~perception*satinc*~satlife 0.205 0.932
B) Developing countries Overall: 0.761
skills*~opport*~perception*~satinc*satlife 0.157 0.817
~skills*opport*peer*perception*~satlife 0.248 0.818
~skills*opport*~peer*perception*~satinc*satlife 0.188 0.822
skills*opport*peer*perception*~satinc*satlife 0.172 0.797
skills*~opport*~peer*~perception*~satlife 0.248 0.777
skills*~opport*~peer*~perception*~satinc 0.268 0.859
Note: Quine McCluskey algorithm. “~” represents lower levels of belonging to the
Table 4. FsQCA: necessary conditions of necessity entrepreneurship
A) Developed countries B) Developing countries
Conditions Consistency Coverage Consistency Coverage
peer+satinc+satlife+perceptionn 0.816 0.484 0.802 0.533
opport+peer+perception+satinc 0.775 0.499 0.802 0.596
opport+peer+perception+satlife 0.772 0.505 0.788 0.564
opport+perception+satinc+satlife 0.792 0.483 0.822 0.539
opport+peer+satinc+satlife 0.815 0.484 0.829 0.545
opport+peer+perceptionn 0.918 0.528 0.866 0.588
skills+opport+peer+satinc 0.824 0.514 0.861 0.562
skills+opport+peer+satlife 0.826 0.512 0.903 0.551
skills+opport+perception+satinc 0.800 0.516 0.862 0.636
skills+opport+perception+satlife 0.814 0.515 0.905 0.599
skills+opport+satinc+satlife 0.852 0.501 0.881 0.568
skills+peer+perception+satinc 0.825 0.535 0.912 0.604
skills+peer+perception+satlife 0.827 0.512 0.885 0.572
skills+peer+satinc+satlife 0.865 0.498 0.917 0.555