Regulation of hepatic mitochondrial oxidation
by glucose-alanine cycling during starvation in
humans
Kitt Falk Petersen, … , Gary W. Cline, Gerald I. Shulman
J Clin Invest.
2019;
129(11)
:4671-4675.
https://doi.org/10.1172/JCI129913
.
In order to determine whether the glucose-alanine cycle regulates rates of hepatic
mitochondrial oxidation in humans, we applied positional isotopomer NMR tracer analysis
(PINTA) to assess rates of hepatic mitochondrial oxidation and pyruvate carboxylase flux in
healthy volunteers following both an overnight (12 hours) and a 60-hour fast. Following the
60-hour fast, rates of endogenous glucose production and mitochondrial oxidation
decreased, whereas rates of hepatic pyruvate carboxylase flux remained unchanged. These
reductions were associated with reduced rates of alanine turnover, assessed by
[3-
13C]alanine, in a subgroup of participants under similar fasting conditions. In order to
determine whether this reduction in alanine turnover was responsible for the reduced rates
of hepatic mitochondrial oxidation, we infused unlabeled alanine into another subgroup of
60-hour fasted subjects to increase rates of alanine turnover, similar to what was measured
after a 12-hour fast, and found that this perturbation increased rates of hepatic mitochondrial
oxidation. Taken together, these studies demonstrate that 60 hours of starvation induce
marked reductions in rates of hepatic mitochondrial oxidation, which in turn can be
attributed to reduced rates of glucose-alanine cycling, and reveal a heretofore undescribed
role for glucose-alanine in the regulation of hepatic mitochondrial oxidation in humans.
Concise Communication
Endocrinology
Metabolism
Find the latest version:
Introduction
The glucose-alanine cycle represents a critical link between car-bohydrate and amino acid metabolism and comprises a series of reactions in which pyruvate, derived mostly from intramyocellular glycolysis, is transaminated with ammonia, derived from muscle protein catabolism, to form l-alanine (1, 2). Alanine is subsequent-ly transported to the liver, where the amino group is transferred to α-ketoglutarate by alanine transaminase to form glutamate and pyruvate. The amino group, which was transferred from alanine to glutamate, is subsequently converted to urea, and the newly generated pyruvate is converted to glucose. Besides transferring potentially toxic ammonia, derived from muscle protein catabo-lism, to the liver for conversion to urea, this cycle also transfers energy from the liver to the muscle by the generation of 2 moles of ATP for every mole of glucose that is glycolyzed and recycles 3-carbon units back to the liver for conversion to glucose. How-ever, it is unknown whether the glucose-alanine cycle participates in other critical functions of hepatic metabolism during prolonged (60 hours) starvation.
We have recently demonstrated a critical role for decreased glu-cose-alanine cycling, due to hepatic glycogen depletion, in promot-ing marked reductions in rates of hepatic mitochondrial oxidative metabolism in awake rats during prolonged (48 hours) starvation (3).
Furthermore, we found that reduced rates of hepatic mitochondrial oxidation during prolonged starvation could be attributed to a 40% reduction in rates of glucose-alanine cycling. However, whether alter-ations in the rates of glucose-alanine cycles have similar effects in the regulation of hepatic mitochondrial oxidation in humans during star-vation is not known.
In order to determine whether starvation promotes reduced rates of hepatic mitochondrial oxidation (rate of citrate synthase flux [VCS]) in humans, we applied positional isotopomer NMR tracer analysis (PINTA) to assess rates of hepatic VCS and pyruvate carboxylase flux (VPC) as well as the hepatic mitochondrial redox state by measuring the ratio of plasma concentrations of β -hy-droxybutyrate to acetoacetate ([β-OHB]/[AcAc]) (4–7) in healthy volunteers following a 12-hour overnight fast and again following a 60-hour fast (8). In order to determine whether alanine turnover is reduced during starvation, we assessed rates of [3-13C]alanine
turn-over in another subgroup of individuals under the same 12-hour and 60-hour fasted conditions. Finally, in order to determine whether decreased rates of alanine turnover during starvation play a causal role in promoting decreased rates of hepatic mitochondrial oxidation, we infused alanine in a subgroup of 60-hour fasted sub-jects to approximately match rates of alanine turnover in 12-hour fasted subjects and reassessed rates of hepatic VPC and VCS flux by PINTA under these conditions.
Results and Discussion
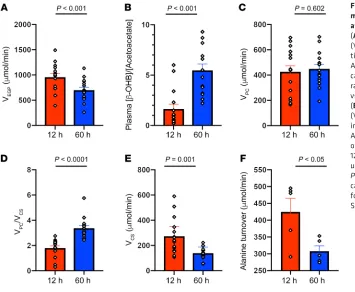
Sixty hours of starvation promoted an approximately 25% reduction in plasma glucose and insulin concentrations, compared with the overnight (12 hours) fast (Table 1), which could be attributed to sim-ilar reductions in the rates of endogenous glucose production (Fig-ure 1A). As expected, these changes were associated with marked
In order to determine whether the glucose-alanine cycle regulates rates of hepatic mitochondrial oxidation in humans, we applied positional isotopomer NMR tracer analysis (PINTA) to assess rates of hepatic mitochondrial oxidation and pyruvate carboxylase flux in healthy volunteers following both an overnight (12 hours) and a 60-hour fast. Following the 60-hour fast, rates of endogenous glucose production and mitochondrial oxidation decreased, whereas rates of hepatic pyruvate carboxylase flux remained unchanged. These reductions were associated with reduced rates of alanine turnover, assessed by [3-13C]alanine, in a subgroup of participants under similar fasting conditions. In order to determine whether this reduction in
alanine turnover was responsible for the reduced rates of hepatic mitochondrial oxidation, we infused unlabeled alanine into another subgroup of 60-hour fasted subjects to increase rates of alanine turnover, similar to what was measured after a 12-hour fast, and found that this perturbation increased rates of hepatic mitochondrial oxidation. Taken together, these studies demonstrate that 60 hours of starvation induce marked reductions in rates of hepatic mitochondrial oxidation, which in turn can be attributed to reduced rates of glucose-alanine cycling, and reveal a heretofore undescribed role for glucose-alanine in the regulation of hepatic mitochondrial oxidation in humans.
Regulation of hepatic mitochondrial oxidation by
glucose-alanine cycling during starvation in humans
Kitt Falk Petersen,1,2 Sylvie Dufour,1,2 Gary W. Cline,1,2 and Gerald I. Shulman1,2,3
1Department of Medicine, 2Yale Diabetes Research Center, and 3Department of Cellular & Molecular Physiology, Yale School of Medicine, New Haven, Connecticut, USA.
Related Commentary: p. 4563
Conflict of interest: The authors have declared that no conflict of interest exists. Copyright: © 2019, American Society for Clinical Investigation.
Submitted: May 14, 2019; Accepted: July 18, 2019; Published: September 23, 2019. Reference information: J Clin Invest. 2019;129(11):4671–4675.
ma leptin and thyroid-stimulating hormone (TSH) concentrations, but were independent of changes in plasma T3 concentrations or changes in whole body energy expenditure (Table 1).
In order to determine whether 60 hours of starvation altered rates of glucose-alanine cycling, we next measured endogenous rates of alanine turnover in a similar group of young, lean individ-uals following 12 hours and 60 hours of fasting assessed by [3-13C]
alanine turnover. Rates of alanine turnover in plasma following a 12-hour fast were approximately 425 μmol/min (Figure 1F), which is in good agreement with rates of alanine turnover previously measured in overnight-fasted humans using similar methodolo-gy (10). Following 60 hours of fasting, rates of alanine turnover decreased by approximately 30% (Figure 1F) despite no signifi-cant alterations in plasma alanine concentrations (Table 1). This starvation-induced reduction in rates of whole body alanine turn-over is consistent with the observed 75% reduction in net alanine release across the forearm that occurs in humans during prolonged starvation (1). Previous studies in awake rats found that reduced rates of glucose-alanine cycling following 48 hours of starvation were associated with reduced rates of net hepatic glycogenolysis, resulting in decreased rates of hepatic glucose production and reductions of plasma glucose concentrations from approximately 6 mM to approximately 5 mM. The major role of hepatic glycog-enolysis and concomitant reductions in plasma glucose concen-trations in regulating glucose-alanine cycling during starvation was then demonstrated by using a glycogen phosphorylase inhibi-tor, which inhibited net hepatic glycogenolysis in glycogen-replete 8-hour fasted rats and decreased rates of glucose-alanine cycling to rates observed in hepatic glycogen–depleted 48-hour fasted rats despite unchanged rates in hepatic VPC (3). Consistent with these rodent studies, we found that 60 hours of fasting resulted in marked reductions in rates of glucose-alanine cycling in humans independently of any changes in hepatic VPC flux, suggesting that these reductions in glucose-alanine cycling reflect reductions in hepatic glycogen content and corresponding reductions in rates of net hepatic glycogenolysis, as previously observed (9).
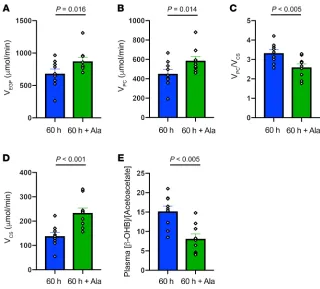
In order to determine whether this 30% reduction in alanine turnover might be playing a causal role in promoting the marked reduction in rates of hepatic mitochondrial oxidation observed following a 60-hour fast, we infused l-alanine in a subgroup of 60-hour fasted individuals to increase rates of alanine turnover to approximately match rates observed in 12-hour fasted subjects and then repeated the PINTA measurements of hepatic pyruvate carboxylase flux, hepatic VPC/VCS, and rates of hepatic mitochon-drial oxidation. The l-alanine infusion promoted an approximate-ly 30% increase in rates of endogenous glucose production (VEGP) (Figure 2A), which could be attributed to an approximately 30% increase in rates of hepatic pyruvate carboxylase flux (VPC) (Figure 2B). These results demonstrate that hepatic pyruvate carboxylase flux is substrate limited after 60 hours of starvation, despite being activated by increased hepatic acetyl-CoA content, which would be predicted by the 12-fold increase in rates of β-OHB turnover (11) and increased plasma glucagon concentrations (Table 1) (12). This increase in hepatic VPC flux was associated with an approxi-mately 20% reduction in the VPC/VCS ratio (Figure 2C) and could entirely be attributed to an approximately 70% increase in rates of hepatic mitochondrial oxidation (VCS) (Figure 2D).
increases in plasma glucagon and nonesterified fatty acid (NEFA) concentrations, which resulted in an increase in rates of β-OHB production, leading to increased plasma ketone (β-OHB and AcAc) concentrations (Table 1) and an approximately 3-fold increase in the hepatic mitochondrial redox state, as reflected by an increase in the plasma [β-OHB]/[AcAc] ratio (Figure 1B). This reduction in rates of endogenous glucose production could entirely be attribut-ed to rattribut-eductions in rates of net hepatic glycogenolysis, since rates of hepatic pyruvate carboxylase flux (VPC) remained relatively unchanged during this 12-hour to 60-hour fasted transition (Figure 1C). These findings are consistent with direct measurements of net hepatic glycogenolysis in humans, by 13C magnetic resonance
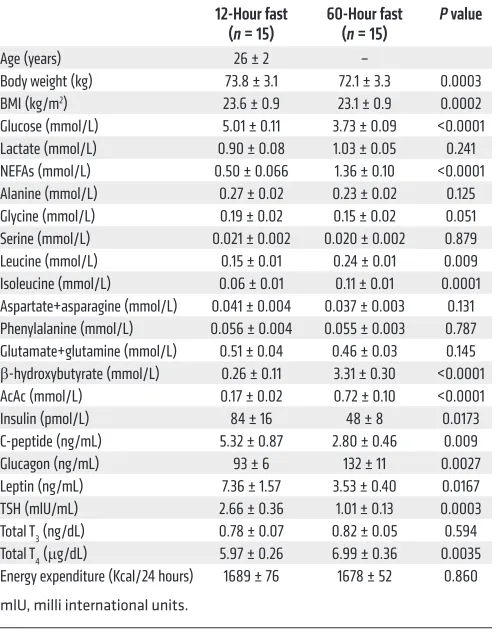
spec-troscopy (MRS), under similar fasting conditions, demonstrating that rates of hepatic gluconeogenesis remain relatively constant during this period of starvation and that reductions in rates of net hepatic glycogenolysis can account for virtually all of the reduction in rates of endogenous glucose production during this fasting inter-val (9). Using PINTA, we also found that 60 hours of fasting promot-ed an approximately 90% increase in the VPC/VCS ratio (Figure 1D), which could entirely be attributed to an approximately 50% reduc-tion in rates of hepatic mitochondrial oxidareduc-tion (VCS) compared with the 12-hour overnight fasting conditions (Figure 1E). This starva-tion-induced reduction in rates of hepatic mitochondrial oxidation (VCS) was associated with an approximately 50% reduction in plas-Table 1. Anthropometric data, plasma metabolite, and hormone concentrations in healthy volunteers after 12-hour and 60-hour fasts
12-Hour fast
(n = 15) 60-Hour fast(n = 15) P value
Age (years) 26 ± 2 –
Body weight (kg) 73.8 ± 3.1 72.1 ± 3.3 0.0003
BMI (kg/m2) 23.6 ± 0.9 23.1 ± 0.9 0.0002
Glucose (mmol/L) 5.01 ± 0.11 3.73 ± 0.09 <0.0001
Lactate (mmol/L) 0.90 ± 0.08 1.03 ± 0.05 0.241
NEFAs (mmol/L) 0.50 ± 0.066 1.36 ± 0.10 <0.0001
Alanine (mmol/L) 0.27 ± 0.02 0.23 ± 0.02 0.125
Glycine (mmol/L) 0.19 ± 0.02 0.15 ± 0.02 0.051
Serine (mmol/L) 0.021 ± 0.002 0.020 ± 0.002 0.879
Leucine (mmol/L) 0.15 ± 0.01 0.24 ± 0.01 0.009
Isoleucine (mmol/L) 0.06 ± 0.01 0.11 ± 0.01 0.0001
Aspartate+asparagine (mmol/L) 0.041 ± 0.004 0.037 ± 0.003 0.131 Phenylalanine (mmol/L) 0.056 ± 0.004 0.055 ± 0.003 0.787 Glutamate+glutamine (mmol/L) 0.51 ± 0.04 0.46 ± 0.03 0.145 β-hydroxybutyrate (mmol/L) 0.26 ± 0.11 3.31 ± 0.30 <0.0001
AcAc (mmol/L) 0.17 ± 0.02 0.72 ± 0.10 <0.0001
Insulin (pmol/L) 84 ± 16 48 ± 8 0.0173
C-peptide (ng/mL) 5.32 ± 0.87 2.80 ± 0.46 0.009
Glucagon (ng/mL) 93 ± 6 132 ± 11 0.0027
Leptin (ng/mL) 7.36 ± 1.57 3.53 ± 0.40 0.0167
TSH (mlU/mL) 2.66 ± 0.36 1.01 ± 0.13 0.0003
Total T3 (ng/dL) 0.78 ± 0.07 0.82 ± 0.05 0.594
Total T4 (μg/dL) 5.97 ± 0.26 6.99 ± 0.36 0.0035
Energy expenditure (Kcal/24 hours) 1689 ± 76 1678 ± 52 0.860
[image:3.585.36.284.111.428.2]Taken together, these studies demonstrate that decreased glu-cose-alanine cycling is rate controlling in the regulation of hepat-ic pyruvate carboxylase flux after 60 hours of fasting in humans. Furthermore, they demonstrate that reductions in glucose-alanine cycling during starvation promote reduced rates of hepatic mito-chondrial oxidation and reveal a heretofore undescribed role for the glucose-alanine cycle in the regulation of hepatic mitochondrial oxidation in humans. Future studies will be necessary to determine whether alterations in the hepatic mitochondrial redox state and/or other factors are responsible for mediating this skeletal muscle-liver crosstalk. In addition, given recent studies demonstrating a critical threshold for hypoleptinemia to stimulate the hypothalamic-pitu-itary-adrenocortical axis in both rodents (3) and humans during more prolonged (10 days) starvation (14), which has been shown to modu-late white adipocyte lipolysis, hepatic gluconeogenesis (3), and hunger (15) in rodents, it will be of interest to determine the impact of hypolep-tinemia and hypercortisolemia on these same parameters in humans.
Methods
Subjects and study procedures. Twenty healthy, lean, nonsmoking men
without history of liver disease, with normal liver function tests, and con-suming no more than one alcoholic drink per day were recruited and stud-ied after prescreening with an oral glucose tolerance test (OGTT) to ensure normal glucose tolerance. The PINTA studies were performed in 15 sub-jects after 12-hour and 60-hour fasts and in 9 of these subsub-jects, who repeat-ed the 60-hour fast with alanine supplementation, as describrepeat-ed below.
During the 60-hour fasting period, subjects were instructed to drink plenty of regular water and were contacted daily to ensure com-pliance, well-being, and to address any issues. Compliance was ver-ified by the fasting blood glucose and ketone concentrations upon admission. All subjects enrolled completed the studies.
[image:4.585.43.398.56.348.2]We next wanted to understand the potential mechanism by which alterations in glucose-alanine cycling might regulate hepatic mitochondrial oxidation in humans during 60 hours of starvation. Alterations in plasma T3, T4, and glucagon concentrations could potentially increase rates of hepatic mitochondrial oxidation, but the increase in hepatic VCS with alanine infusion occurred independently of any changes in these hormones (Table 2). It is also possible that ala-nine-induced increases in hepatic VPC flux could have, at least in part, contributed to the observed increase in rates of hepatic mitochondri-al oxidation (VCS) during the alanine infusion, by promoting hepatic mitochondrial anaplerosis. However, this does not appear to be a major contributing factor to this process, given that hepatic VPC did not decrease substantially during the 60-hour fast, despite marked reductions in rates of hepatic mitochondrial oxidation. This finding is in contrast to our study in rodents (3), in which 48-hour starvation led to marked reductions in both hepatic VPC flux and glucose-ala-nine cycling. These species differences can most likely be attributed to the much higher rates of metabolism in rats, in which 48 hours of fasting leads to virtually total depletion of whole-body fat stores, severe hypoleptinemia (<1 ng/mL), and hypercorticosteronemia in contrast to the still relatively ample fat stores in 60-hour fasted lean humans. We also assessed hepatic redox potential, as reflected by the ratio of the plasma concentrations of β-OHB to AcAc, and found that the hepatic redox index increased approximately 3.4-fold during 60 hours of starvation and decreased significantly during the alanine infusion (Figure 2E). Increased hepatic redox states have been shown to decrease rates of hepatic mitochondrial oxidation in vitro (4, 5, 13), and it is possible that an increase in the hepatic redox potential during 60 hours of starvation contributed to the reduced rates of hepatic mitochondrial oxidation and that the alanine infusion promoted an increase in rates of hepatic VCS by reducing the hepatic redox state.
Figure 1. Hepatic glucose and mitochondrial metabolism in healthy, young lean subjects after 12 hours and 60 hours of starvation.
(A) Rates of endogenous glucose production
(VEGP) (n = 15). (B) Ratio of plasma
concentra-tions of β-OHB to plasma concentrations of AcAc (n = 15). (C) Rates of hepatic pyruvate
carboxylase flux (VPC) (n = 15). (D) Relative
rates of hepatic pyruvate carboxylase flux vs. citrate synthase flux (VPC/VCS) (n = 15). (E) Rates of hepatic mitochondrial oxidation
(VCS) (n = 15). (F) Rates of alanine turnover
in a subgroup of healthy volunteers (n = 5). All rates are shown at 12 hours and 60 hours of starvation. Comparisons between the 12-hour and 60-hour fast were performed using a paired, 2-tailed Student’s t test, and
P < 0.05 was considered statistically
signifi-cant. The corresponding plasma enrichments
Plasma glucose and lactate concentrations were measured using a Yellow Springs STAT 2700 Analyzer (Yellow Springs Instruments).
Plas-ma β-OHB concentrations were measured by COBAS (Roche
tics). Plasma NEFA was measured using a Wako reagent (Wako Diagnos-tics). Plasma alanine concentrations were measured by GC-MS: samples
were spiked with a 2H-alanine internal standard and prepared for GC-MS
using the protocols described above, with the ratio of labeled to unla-beled substrate compared with a standard curve to measure absolute concentrations. Plasma amino acid concentrations (glycine, alanine, ser-ine, leucser-ine, isoleucser-ine, aspartate+asparagser-ine, phenylalanser-ine, and
glu-tamate+glutamine) and β-OHB enrichments were measured by GC-MS
after spiking with 2H or 13C internal standards and derivatization using
the protocol described for alanine and as previously described for β-OHB
(11). Plasma immunoreactive insulin, C-peptide, glucagon, leptin, TSH,
T3, and T4 concentrations were measured with double-antibody
radio-immunoassay techniques using commercially available kits (Linco). After admission at 7:30 am to the Yale Hospital Research Unit (HRU),
one intravenous line was inserted into an antecubital vein for infusions and another was inserted retrogradely into a hand vein for blood collec-tions. The hand was warmed in a “hot-box” to “arterialize” the blood, baseline blood samples were collected, and a 3-hour triple-tracer PINTA
infusion was started. This consisted of [2H
7]-d-glucose (d7-glucose, 134
mmol/L), given as a 5-minute prime of 1.1 mmol/m2 followed by a
con-stant rate of 11.2 μmol/(m2-min), [3-13C]-Na-l-lactate (900 mmol/L),
and 13C
4-Na-β-OHB (13C4-β-OHB, 15.4 mmol/L), given at constant rates
of 4.3 μmol/(kg-min) and 3.2 μmol/(m2-min), respectively.
In the 60-hour fast–alanine supplementation PINTA studies, an infusion of unlabeled l-alanine (alanine) was added to the
triple-trac-er infusion at a constant rate of 5 μmol/(kg-min) to increase rates of
alanine turnover so that they were similar to what was observed after a 12-hour fast.
In order to determine the amount of l-alanine required for
sup-plementation during the 60-hour fast, rates of [3-13C]-Na-l-alanine
turnover were measured in a separate group (n = 5) of subjects after a
12-hour and a 60-hour fast with a 3-hour infusion of [3-13
C]-Na-l-ala-nine ([3-13C]-alanine) at a constant rate of 0.29 μmol/(kg-min).
In all studies, arterialized blood samples were collected every 10 minutes during the last 40 minutes for gas chromatography mass spectrometry (GC-MS) and hormone and metabolite analyses. In the PINTA studies, a 30 mL sample was collected at 180 minutes for
13C MRS analyses of positional glucose enrichments using 13C MRS
[image:5.585.37.357.54.343.2](Bruker Avance III HD, 500 UltraShield NMR Spectrometer, Top-Spin 3.2, Bruker) in combination with GC-MS and liquid chromatog-raphy–tandem mass spectrometry (LC-MS/MS) analyses as previ-ously described (8). Energy expenditure was measured using indirect calorimetry during the final 30 minutes of each study (Deltratrack Metabolic Monitor, Sensormedics).
Figure 2. Hepatic glucose and mitochondrial metabolism in healthy, young lean subjects after 60 hours of starvation and 60 hours of starvation plus alanine supplementation. (A) Rates of endogenous
glucose production (VEGP) (n = 9). (B) Rates of hepatic
pyruvate carboxylase flux (VPC) (n = 9). (C) Relative
rates of hepatic pyruvate and citrate synthase flux (VPC/VCS) (n = 9). (D) Rates of hepatic mitochondrial
oxidation (VCS) (n = 9). (E) Relative plasma
concentra-tions of β-OHB and plasma AcAc (n = 9). Comparisons between the 60-hour fast and 60-hour fast plus alanine supplementation were performed using a paired, 2-tailed Student’s t test, and P < 0.05 was considered statistically significant. The correspond-ing plasma enrichments for glucose, lactate, and B-OHB are shown in Supplemental Figures 1, 2, and 3.
Table 2. Plasma metabolite and hormone concentrations in a subgroup of healthy 60-hour fasted subjects before and after a 3-hour alanine infusion
60-Hour fast
(n = 9) 60-Hour fast+alanine(n = 9) P value
Alanine (mmol/L) 0.23 ± 0.04 0.60 ± 0.03 <0.0001
β-hydroxybutyrate (mmol/L) 3.1 ± 0.3 2.0 ± 0.4 0.0009
AcAc (mmol/L) 0.20 ± 0.03 0.27 ± 0.04 0.182
TSH (mlU/mL) 0.70 ± 0.12 0.77 ± 0.18 0.592
Total T3 (ng/mL) 0.80 ± 0.04 0.83 ± 0.07 0.051
[image:5.585.297.543.640.737.2]eral points: (a) 13CO
2 will label C4 of OAA to give [4-13C]OAA; (b) [4-13C]
OAA randomizes to [1-13C]OAA and [4-13C]OAA; enrichment in each
posi-tion is ½ of the original [13CO
2] enrichment; (c) [1-13C]OAA → [1-13C]PEP:
label of [4-13C]OAA is lost in OAA → PEP; (d) [1-13C]PEP → [3-13C]glucose
and [4-13C]glucose; (e) 13C of [4-13C]OAA and [1-13C]OAA is lost as 13CO 2
with VCS flux to 13C-citrate and first turn of the TCA cycle; (f) therefore, the
correction for [13CO
2] is 2 × [4-13C]glucose – (13CO2 × 1/2)/(2 × CF), where
[13CO
2] is the liver 13C-bicarbonate enrichment, and CF = (VPC + VCS)/VPC;
and (g) VPC/VCS corrected for [13CO
2] was determined iteratively.
Statistics. Statistical analyses were performed with StatPlus
soft-ware. Statistical comparisons between parameters measured during the 12-hour and 60-hour fast and between the 60-hour fast and 60-hour fast plus alanine supplementation were performed using a paired 2-tailed Student’s t test, and a P value of less than 0.05 was considered statistically significant. Percentage changes are calculated from the mean values of the groups. All data are expressed as mean ± SEM.
Study approval. The Yale Institutional Review Board (Yale
Uni-versity Human Investigation Committee) approved all protocols, and written, informed consent was obtained from each participant after explanation of the purpose, nature, and potential complications of the study. The study was registered at ClinicalTrials.gov (NCT02193295).
Author contributions
KFP and GIS designed the experiments and wrote the manuscript with assistance from SD and GWC. KFP, SD, and GWC performed the studies. KFP, SD, GWC, and GIS obtained and interpreted data.
Acknowledgments
The authors would like to thank Anne Impellizeri, Irina Smolgov-sky, Mikhail SmolgovSmolgov-sky, Gina Solomon, Xian-Man Zhang, Gina Butrico, Catherine Parmelee, and the Yale HRU for technical assis-tance and Douglas Rothman for helpful discussions. This work was supported by grants from the NIH (R01 DK113984, R01 NS087568, P30 DK45735, and UL1 RR024139), Gilead Sciences, and the Novo Nordisk Foundation Center for Basic Metabolic Research.
Address correspondence to: Gerald I. Shulman, Yale School of Medi-cine, TAC S-269, P.O. Box 208020, New Haven, Connecticut 06520-8020, USA. Phone: 203.785.5447; Email: gerald.shulman@yale.edu. Calculations. Rates of D7-glucose, [13C
4]β-OHB, and [3-13C]alanine
turnover were calculated during isotopic steady state as the tracer
infusion rate × [(infusate enrichment/plasma enrichment) – 1]. VPC/
VEGP and VPC/VCS were calculated from the 13C glucose enrichments m
+ 1, m + 2, and [4-13C]glucose, [5-13C]glucose, as previously derived (8).
The following equations were used: VPC/VCS = ([5-13C]glucose/(2
× [4-13C]glucose)) – 1 and V
PC/VEGP = G2/XFE2, where XFE, the
frac-tional triose enrichment, in terms of the ratio of the enrichments of
doubly labeled 13C-glucose G2 and singly labeled 13C-glucose G1 was
calculated as XFE = 1/((1 + (1/(2 × G2/G1))).
The key assumptions of mass isotopomer distribution analysis (MIDA) are as follows: (a) a binomial probability analysis describes the
distribution of 13C-glucose isotopomers resulting from the synthesis of
2 13C-labeled trioses; (b) there is one gluconeogenic precursor pool
enrichment (if not, VPC/VEGP is underestimated); (c) triose phosphates
are equilibrated (if not, VPC/VEGP is overestimated).
In addition to these assumptions, the MIDA calculation assumes that
G2 (i.e., any glucose enriched with 2-13C atoms) is due to the
condensa-tion of 2 trioses, each labeled with a single 13C-atom. However, the use
of 13C-lactate as the tracer and its subsequent passage through the
tricar-boxylic acid (TCA) cycle (with entry through PC and pyruvate
dehydro-genase [PDH]) will lead to trioses with 2-13C atoms. We corrected for any
G2 glucose synthesized from 13C
2-trioses by analysis of the enrichment
in the glucose C4-C5-C6 fragment. In addition to determining the total m + 1 and m + 2 enrichment in glucose (GC-MS: CI of glucose
pentaace-tate, m/z 331→338), enrichment in the glucose C4-C5-C6 fragment was
determined by GC-MS analysis in the EI mode of the glucose aldonitrile
pentapropionate derivative by monitoring m/z 259→265 (16).
The following equations were also used: VPC = VPC/VEGP × VEGP and VCS = VCS/VPC × VPC. The VPC/VCS ratio was corrected for potential 13CO
2
label-ing as described below. The fractional enrichment of glucose from 13CO
2
can be increased from PC synthesis of [4-13C]oxaloacetate ([4-13C]OAA)
from 13CO
2 and pyruvate. The labeling of glucose from 13C-bicarbonate is
dependent upon the relative flux of pyruvate to OAA with equilibration with fumarate and formation of phosphoenolpyruvate (PEP) versus flux
of pyruvate to OAA to citrate (i.e., VPC/VCS). Only [1-13C]OAA (from the
equilibration of [4-13C]OAA with fumarate) converted directly to PEP will
label glucose (C3 and C4), since all 13CO
2 of [4-13C]OAA is lost with flux
through the TCA cycle. Hence, the correction of 13CO
2 follows from
1. Felig P, Pozefsky T, Marliss E, Cahill GF Jr. Alanine: key role in gluconeogenesis. Science. 1970;167(3920):1003–1004.
2. Felig P. The glucose-alanine cycle. Metabolism. 1973;22(2):179–207.
3. Perry RJ, et al. Leptin mediates a glucose-fatty acid cycle to maintain glucose homeostasis in starvation. Cell. 2018;172(1-2):234–248.e17. 4. Krebs HA, Gascoyne T. The redox state of the
nicotinamide-adenine dinucleotides in rat liver homogenates. Biochem J. 1968;108(4):513–520. 5. Williamson DH, Lund P, Krebs HA. The redox
state of free nicotinamide-adenine dinucleotide in the cytoplasm and mitochondria of rat liver.
Biochem J. 1967;103(2):514–527.
6. Madiraju AK, et al. Metformin suppresses gluconeogenesis by inhibiting mitochondrial glycerophosphate dehydrogenase. Nature. 2014;510(7506):542–546.
7. Madiraju AK, et al. Metformin inhibits glucone-ogenesis via a redox-dependent mechanism in vivo. Nat Med. 2018;24(9):1384–1394. 8. Perry RJ, et al. Non-invasive assessment of
hepatic mitochondrial metabolism by positional isotopomer NMR tracer analysis (PINTA). Nat
Commun. 2017;8(1):798.
9. Rothman DL, Magnusson I, Katz LD, Shulman RG, Shulman GI. Quantitation of hepatic glycog-enolysis and gluconeogenesis in fasting humans with 13C NMR. Science. 1991;254(5031):573–576. 10. Perriello G, et al. Estimation of glucose-
alanine-lactate-glutamine cycles in postabsorptive humans: role of skeletal muscle. Am J Physiol. 1995;269(3 Pt 1):E443–E450.
11. Perry RJ, Peng L, Cline GW, Petersen KF, Shulman GI. A non-invasive method to assess hepatic ace-tyl-CoA in vivo. Cell Metab. 2017;25(3):749–756. 12. Agius L, Alberti KG. Regulation of flux through
pyruvate dehydrogenase and pyruvate carboxy-lase in rat hepatocytes. Effects of fatty acids and glucagon. Eur J Biochem. 1985;152(3):699–707. 13. Aldakkak M, Stowe DF, Chen Q, Lesnefsky EJ,
Camara AK. Inhibited mitochondrial respiration by amobarbital during cardiac ischaemia improves redox state and reduces matrix Ca2+ overload and ROS release. Cardiovasc Res. 2008;77(2):406–415. 14. Steinhauser ML, et al. The circulating
metab-olome of human starvation. JCI Insight. 2018;3(16):121434.
15. Perry RJ, et al. Leptin’s hunger-suppressing effects are mediated by the hypothalamic-pitu-itary-adrenocortical axis in rodents. Proc Natl
Acad Sci USA. 2019;116(27):13670–13679.