1
Bottleneck-Oriented Order Release with Shifting Bottlenecks:
An Assessment by Simulation
Matthias Thürer and Mark Stevenson (corresponding author)
Name: Prof. Matthias Thürer Institution: Jinan University
Address: Institute of Physical Internet
School of Electrical and Information Engineering Jinan University (Zhuhai Campus)
519070, Zhuhai, PR China
E-mail: [email protected]
Name: Prof. Mark Stevenson Institution: Lancaster University
Address: Department of Management Science Lancaster University Management School Lancaster University
LA1 4YX - U.K.
E-mail: [email protected]
2
Bottleneck-Oriented Order Release with Shifting Bottlenecks:
An Assessment by Simulation
Abstract
Bottleneck shiftiness is an important managerial problem that has received significant research attention. The extant literature has shown, for example, that protective capacity reduces the likelihood of the bottleneck shifting. Yet the actual performance impact of a bottleneck shift has been widely neglected. We posit that there are at least two interrelated effects that may impact shop performance: (i) the direct effect of the change in bottleneck position; and, (ii) the indirect effect of the order release method incorrectly identifying the bottleneck (i.e. assuming the bottleneck is Station X when it is actually Station Y). The latter is particularly acute in the context of bottleneck-oriented order release methods such as Drum-Buffer-Rope (DBR) as these release methods use feedback from the (assumed) bottleneck to control release. Using controlled simulation experiments we demonstrate that a bottleneck shift to a station upstream of the assumed bottleneck has a negligible effect on DBR performance while a downstream shift is detrimental to performance. Meanwhile, the distance, i.e. the number of stations between the actual and assumed bottleneck, has a negligible performance impact. These results have important managerial and research implications for DBR and other release methods.
3 1. Introduction
The phenomenon of shifting bottlenecks bedevils managers (Lawrence & Buss, 1994) and negatively affects shop floor manageability (Craighead et al., 2001). It is consequently an important problem in practice (Stevenson et al., 2011) that has received significant research attention (e.g. Lawrence & Buss, 1994; Craighead, 2001; Patterson et al., 2002; Fredendall et al., 2010; Fernandes et al., 2014). The extant literature however has mainly focused on how to avoid bottleneck shiftiness; for example, research has demonstrated that an increase in protective capacity (i.e. capacity at non-bottleneck stations) reduces (but does not eradicate) the likelihood of the bottleneck shifting from one station to another. This research focus has been motivated by the implicit assumption that bottleneck shiftiness is directly detrimental to performance. But this assumption has rarely been questioned; and the actual performance impact of bottleneck shiftiness has rarely been evaluated. In this study, we assess the impact of bottleneck shiftiness on order release performance in a make-to-order flow shop with high variability in terms of the occurrence of demand and processing times. This is a common shop type, such as for companies that focus on producing prototypes and making small runs, e.g. of 1 to 4 units, sometimes referred to as “one offs”.
We suggest that there are at least two interrelated effects that may impact shop performance when the bottleneck shifts: (i) the direct effect of the change in bottleneck position; and, (ii) the indirect effect of the order release method incorrectly identifying the bottleneck (i.e. assuming the bottleneck is Station X when it is actually Station Y). The latter is particularly acute in the context of bottleneck-oriented order release methods since they use feedback from the bottleneck to control release.
4
methods subordinate the release of jobs to the output of the bottleneck. The best-known bottleneck-oriented release method is arguably Drum-Buffer-Rope (DBR) – a descriptor of the way in which order release is realized (Simons & Simpson, 1997). Meanwhile, bottleneck-oriented release methods have also been presented in the context of Workload Control (e.g. Glassey & Resende, 1988; Enns & Prongue-Costa, 2002). A unifying element of these different bottleneck-oriented release methods is that they use a measure of the workload at the bottleneck to regulate the input of work. Using the principles of input/output control (e.g. Plossl & Wight, 1971), these release methods seek to stabilize the workload at the bottleneck by releasing work in accordance with the output rate.
5
The remainder of this paper is organized as follows. In Section 2, we review the literature on bottleneck shiftiness and on bottleneck-oriented order release control to identify the release methods to be considered in our study. Our research problem and research question are then outlined in Section 3. The simulation model used to evaluate performance is then described in Section 4 before the results are presented, discussed, and analyzed in Section 5. Finally, conclusions are drawn in Section 6, where limitations and future research directions are also outlined.
2. Literature Review
We first give a short overview of the literature on shifting bottlenecks in Section 2.1. Section 2.2 then discusses the literature related to bottleneck-oriented release methods considered in our study.
2.1 Shifting Bottlenecks
In general, there are three main streams of literature on shifting bottlenecks: shifting bottleneck detection, shifting bottleneck avoidance, and assessments of the performance impact of shifting bottlenecks.
6
(AGVs). Finally, Roser et al. (2014) presented a simple, practical method for visualizing bottleneck shiftiness – the so-called bottleneck walk.
Research on avoiding bottleneck shiftiness has demonstrated that an increase in protective capacity (i.e. capacity at non-bottleneck stations) reduces bottleneck shiftiness and that a higher level of protective capacity leads to shorter flow times (e.g. Lawrence & Buss, 1994; Craighead et al., 2001). Craighead et al. (2001) further argued that the flow time is not impacted by the position of protective capacity.
Finally, Fry et al. (1987) found that a bottleneck should be positioned at the first, gateway station and that shifting the bottleneck away from this gateway station may actually lead to performance deterioration. Kadipasaoglu et al. (2000) further clarified that if the bottleneck is the first station then there is no upstream station whose variability may starve it; if the bottleneck is moved downstream, then the probability of the bottleneck starving increases due the cumulative effect of upstream variability. This finding – that a bottleneck at the gateway station leads to the best performance – has recently been confirmed by Thürer et al. (2017a) in the context of an order release controlled flow shop. Meanwhile, Thürer et al. (2017b) highlighted that in high-variety flow and job shops with a bottleneck, workload balancing is less important and bottleneck-oriented release methods have the potential to outperform methods that control the workload at each station. However, this assumes that the bottleneck-oriented release method accurately identifies the bottleneck. This assumption is questioned in our study. The bottleneck-oriented release methods to be considered in our study will be discussed next.
2.2 Bottleneck-Oriented Order Release Methods
7
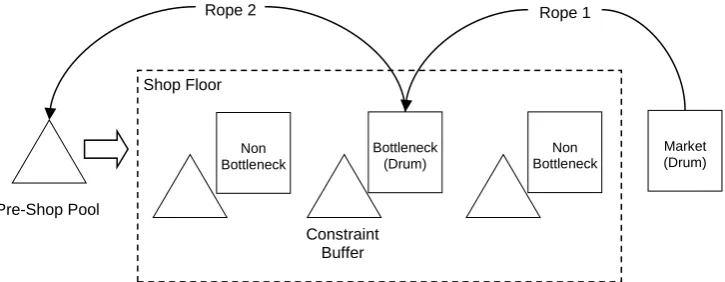
Constraints, with 80% of companies reporting improvements in lead time and due date performance. The Theory of Constraints was originally conceived in the 1970s by Eliyahu M. Goldratt as a scheduling algorithm and later developed into a broader production planning and control concept (Simons & Simpson, 1997; Mabin & Balderstone, 2003). One of its main elements is Optimized Production Technology (OPT), a scheduling (or release) mechanism that controls (or subordinates) the release of jobs to the system in accordance with the bottleneck (or constraint). This OPT release mechanism is now more commonly known as Drum-Buffer-Rope (DBR) – a descriptor for the way in which order release is realized (Simons & Simpson, 1997). A DBR system is depicted in Figure 1 for a single bottleneck station. Its essential parts can be described as follows:
Drum: This is the constraint (e.g. the bottleneck station, the market) and its schedule.
Buffer: This is both the constraint buffer (i.e. the buffer before the bottleneck) and the shipping buffer (i.e. the finished goods inventory; see e.g. Watson et al., 2007). Buffers are time (e.g. Radovilsky, 1998; Rahman, 1998; Schragenheim & Ronen, 1990; Simon & Simpson, 1997; Chakravorty & Atwater, 2005; Golmohammadi, 2015) or a time-equivalent amount of work-in-process. Since, in our study, jobs are considered to be delivered immediately after they are completed, the shipping buffer does not exist.
8
according to the organization’s goal (Schragenheim & Ronen, 1990); Rope 2 then subordinates the system to the constraint (the bottleneck station).
[Take in Figure 1]
Another production planning and control approach that has shown promise in shops with bottlenecks is Workload Control (WLC). WLC is a production planning and control concept that has been developed over more than 30 years (Thürer et al., 2011). It has been shown to significantly improve the performance of high-variety shops both through simulation (e.g. Glassey & Resende, 1988; Land & Gaalman, 1998; Thürer et al., 2012, 2014) and, on occasions, in practice (e.g. Wiendahl, 1992; Bechte 1994; Hendry et al., 2013; Silva et al., 2015). Although Workload Control has been largely developed in the context of balanced shops, there is some evidence of its potential to improve performance in shops with bottlenecks (e.g. Glassey & Resende, 1988; Lingayat et al., 1995; Enns & Prongue-Costa, 2002; Fernandes et al., 2014; Thürer et al., 2017b). For example, Glassey & Resende (1988) proposed a Starvation Avoidance (SA) methodology. SA releases work whenever the workload of jobs released to the bottleneck but not yet completed falls below a certain predetermined workload limit. This is similar to DBR but controls the workload in time rather than in terms of the number of jobs. Both SA and DBR will be considered in our study. Other WLC release methods that aim to balance the workload across resources are not considered since workload balancing is less important in bottleneck shops (Thürer et al., 2017b).
3. Problem Definition
9
layout); and, (ii) a shift in the position of the bottleneck station in the routing of orders. The first aspect, i.e. a shift in the actual physical position of the bottleneck, was considered in Lawrence & Buss (1994). For example, one time Station C is the bottleneck and the next time Station E is the bottleneck. The second aspect, i.e. a shift in the position of the bottleneck station in the routing of orders, was considered in Hopp & Spearman (2001; e.g. p. 459). For example, one time Station C is the bottleneck and the first station in the routing of orders and the next time Station C continues to be the bottleneck but has moved to being second in the routing sequence. So, while the physical bottleneck station remains the same, its position in the routing of orders changes. One of these aspects often implies the other; however, we make this distinction since the focus of our study – where the order release method is based on an incorrect assumption about the position of the bottleneck – is only relevant in the context of the former aspect. Both SA and DBR control a measure of workload at the bottleneck that requires information to be provided via a feedback loop between the order release point and the bottleneck. When the bottleneck shifts, at best there is a time lag before the feedback loop follows and, at worst, the feedback loop does not shift at all. As a consequence, the order release method makes an incorrect assumption about the position of the bottleneck and takes decisions based on information from a non-bottleneck resource.
10
Direction, i.e. whether the actual bottleneck is upstream or downstream of the assumed bottleneck, and;
Distance, i.e. the number of stations between the actual and assumed bottleneck.
4. Simulation Model
A stylized standard model will be used to avoid interactions that may interfere with our understanding of the experimental factors. While any individual shop in practice will differ in many aspects from our stylized environment, the model used in this study captures the job and shop characteristics of high variety make-to-order flow shops. In other words: shops with high processing time variability and high arrival time variability. The shop and job characteristics modeled in the simulations are first summarized in Section 3.1. How we model the order release methods considered in this study is then outlined in Section 3.2. The priority dispatching rule applied for controlling the progress of orders on the shop floor is described in Section 3.3. Finally, the experimental design is outlined and the measures used to evaluate performance are presented in Section 3.4.
4.1 Overview of Modeled Shop and Job Characteristics
11
severity, the less random shifting will occur. An equal adjustment was applied to all non-bottlenecks since the position of protective capacity, i.e. the extra capacity at non-bottleneck resources, is argued to have no effect on flow times (see Craighead et al., 2001). Operation processing times – before adjustment – follow a truncated 2-Erlang distribution with a mean of 1 time unit after truncation and a maximum of 4 time units. The inter-arrival time of jobs follows an exponential distribution with a mean of 1.111 time units, which deliberately results in a utilization level of 90% at the bottleneck. The average utilization level at non-bottlenecks depends on the degree of bottleneck severity in a given experiment.
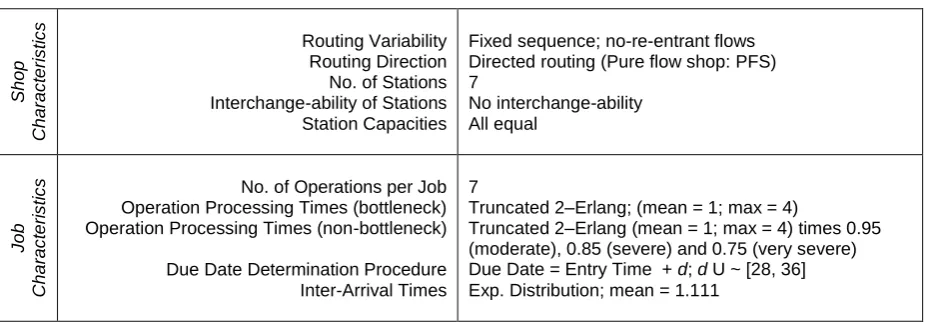
Due dates are set exogenously by adding a random allowance factor, uniformly distributed between 28 and 36 time units, to the job entry time. The minimum value will be sufficient to cover a minimum shop floor throughput time corresponding to the maximum processing time (3.8 time units for non-bottleneck operations and 4 time units for the bottleneck operation, which totals 26.8 time units across the seven stations) plus an allowance for the waiting or queuing times. The simulated shop and job characteristics are summarized in Table 1.
[Take in Table 1]
4.2 Order Release
12
DBR controls the number of jobs released but not yet completed at the (assumed) bottleneck. Whenever a new job arrives at the shop or an operation is completed at the bottleneck, jobs are released until a pre-established buffer limit is reached.
Starvation Avoidance (SA) controls the workload released but not yet completed at the (assumed) bottleneck.
The station that is assumed to be the bottleneck by the order release method is Station 4, which is the center station, i.e. in the middle of the flow shop. The actual bottleneck is varied from Station 1 to Station 7. Ten buffer limits are applied from 11 to 20 jobs for DBR and from 11 to 20 time units for SA. As a baseline measure, experiments where jobs are released immediately upon arrival at the shop are also included. Finally, jobs are considered for release according to their due date.
4.3 Shop Floor Dispatching
13
mechanism incorporated in DBR (see, e.g. Chakravorty & Atwater, 2005). The allowance for the operation throughput time is based on preliminary simulation experiments.
4.4 Experimental Design and Performance Measures
The experimental factors are: (i) the seven different positions of the actual bottleneck; (ii) the three different levels of bottleneck severity (moderate, severe and very severe); (iii) the two different release methods (DBR and SA); and (iv) the ten different buffer limit levels for our release methods (from 11 to 20 jobs or time units). A full factorial design was used with 420 cells (7*3*2*10), where each cell was replicated 100 times. Results were collected over 10,000 time units following a warm-up period of 3,000 time units. These parameters allowed us to obtain stable results while keeping the simulation run time to a reasonable level.
The principal performance measures considered in this study are as follows: the lead time
– the mean of the completion date minus the pool entry date across jobs; the percentage tardy
– the percentage of jobs completed after the due date; and, the mean tardiness
, with being the lateness of job j (i.e. the actual delivery date minus the due date of job j). In addition to these three main performance measures, we also measure the
shop floor throughput time as an instrumental performance variable. While the lead time includes the time that an order waits before release, the shop floor throughput time only measures the time after release to the shop floor.
5. Results
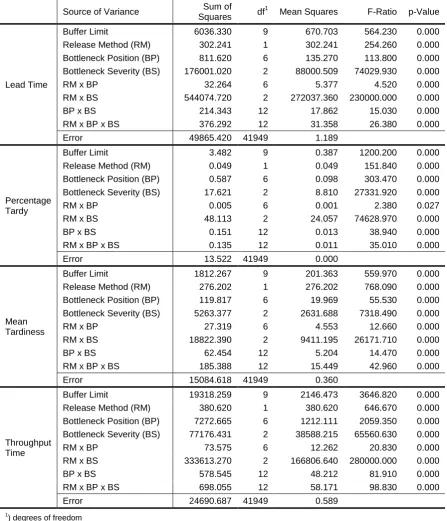
Statistical analysis has been conducted by applying ANOVA. ANOVA is here based on a block design with the buffer limit level as the blocking factor, i.e. the different levels of the DBR and SA limits (from 11 to 20) are treated as different systems. A block design allowed the main effect of the buffer limit and both the main and interaction effects of the release method, bottleneck position, and bottleneck severity to be captured. As can be observed from
) , 0 max( j
j L
14
Table 2, all main effects, two-way interactions, and three-way interactions were shown to be statistically significant at α=0.05.
[Take in Table 2]
The Scheffé multiple-comparison procedure was used to further prove the significance of the differences between the outcomes of our two release methods. Test results, as given in Table 3, suggest that SA outperforms DBR in terms of percentage tardy but that SA is outperformed by DBR in terms of all other performance measures considered in this study. Detailed performance results are presented next in Section 5.1 before a discussion of results is given in Section 5.2.
[Take in Table 3]
5.1. Performance Assessment
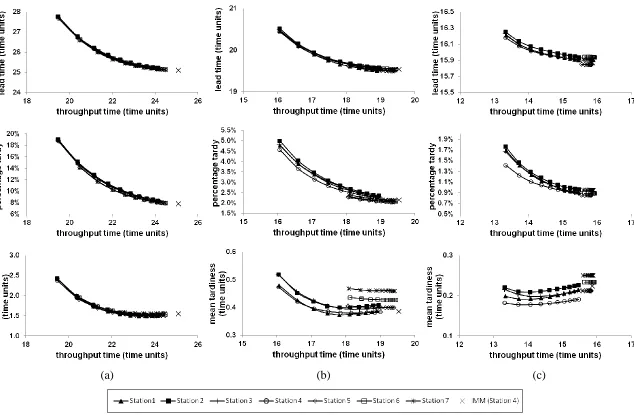
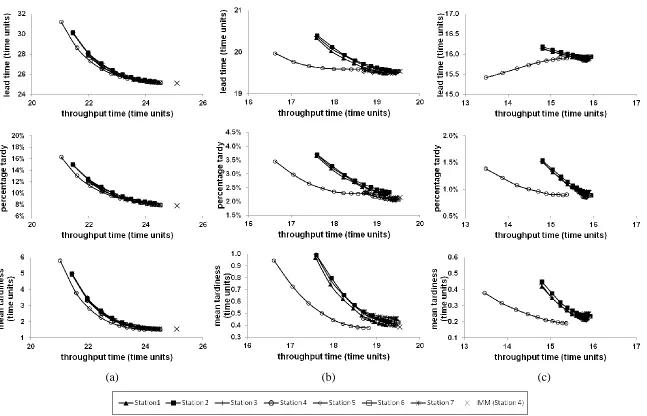
In this study, we use operating characteristic curves (Olhager & Persson, 2008) to assess the impact of the bottleneck position. Rather than comparing one specific parameter setting, parameters are varied and the results presented in the form of performance curves. The relative positioning of the different curves (where each curve represents one position of the bottleneck assumed by the order release method) then allows the performance impact to be assessed. In our study, the main parameter determining release method performance is the buffer limit. This parameter is therefore used to create our performance curves. One performance curve for each assumed bottleneck position (from Station 1 to 7) is created and presented in Figure 2 and Figure 3 for DBR and SA, respectively.
15
The left-hand starting point of the curves represents the lowest buffer limit. The limit level increases step-wise by moving from left to right, with each data point representing one limit level. Increasing the limit increases the level of work-in-process and, as a result, increases the shop floor throughput time. The results for IMMediate release (IMM), where jobs are released immediately to the shop floor upon arrival and no order release control is applied, are located on the right–hand side since this leads to the highest level of work-in-process on the shop floor.
As somewhat expected, a more severe bottleneck leads to better performance since the total amount of work that has to be processed on the shop floor decreases. Meanwhile, a more severe bottleneck also results in a more pronounced effect when the order release method incorrectly assumes the bottleneck since the effect of random shifting diminishes. This can be observed by moving from Figure 2a to Figure 2c and from Figure 3a to Figure 3c. In terms of direction (i.e. whether the actual bottleneck is upstream or downstream of the assumed bottleneck) and distance (i.e. the number of stations between the actual and the assumed bottleneck) the following can be observed from the results in Figure 2 and Figure 3:
16
outperforms all other scenarios. This is because, in contrast to DBR (which controls jobs), SA controls the workload in hours at the station that is identified as the bottleneck.
Distance: If we only compare the performance curves for stations upstream of the actual bottleneck (Station 4) then the distance between the assumed and actual bottleneck has no clear impact. Performance is however marginally better when distance is at its largest, i.e. when the bottleneck is Station 1. At first, this may appear counter-intuitive, but this is likely to be because Station 1 is the gateway station in our pure flow shop (see also the results in Fry et al., 1987). Meanwhile, if we compare the performance curves for stations downstream of the actual bottleneck then we observe that the further downstream the assumed bottleneck is compared to the actual bottleneck, the worse the mean tardiness performance. This means that here distance does appear to have some impact on performance.
5.2 Discussion of Results – The Performance Impact of Bottleneck Shiftiness
17
itself has no or minimal impact. This partially questions the importance of shifting bottlenecks. While it appears to be implicitly assumed in the literature that bottleneck shiftiness has a negative effect on performance, our results argue that the impact on a DBR system is in fact negligible if the shift is to a station upstream of the controlled station; only if the shift is to a station downstream of the controlled station, then bottleneck shiftiness has a direct detrimental impact on performance.
18
Roser et al. (2014) presented a method for visualizing bottleneck shiftiness – the so-called bottleneck walk.
6. Conclusions
Bottleneck shiftiness is an important managerial problem that has received significant research attention. The focus of the extant literature has however mostly been on assessing the impact of protective capacity on bottleneck shiftiness rather than on the actual performance impact of bottleneck shiftiness. We argue that there are at least two interrelated effects that may impact shop performance: (i) the direct effect of the change in bottleneck position; and, (ii) the indirect effect of the order release method incorrectly identifying the bottleneck. The latter effect is particularly acute in the context of bottleneck-oriented release methods. These methods control the input of work to the system based on feedback provided from the assumed bottleneck station. In this study, we therefore asked: What is the performance impact on bottleneck-oriented release methods of making an incorrect assumption about the identity of the bottleneck resource?
19 6.1 Managerial Implications
The performance outcomes obtained under DBR are hardly affected by a shift in the bottleneck to an upstream station (as seen from the controlled stations). Our results also show that DBR outperforms SA (except in terms of percentage tardy). It is therefore the release method recommended for flow shop environments with shifting bottlenecks in practice. Another important managerial implication that emerges from our results is that management should not ‘over-react’ to shifts in the bottleneck. If the bottleneck shifts to an upstream station then shifting the feedback loop of the control system may not be necessary. It may even be advisable to orientate control around a station that is downstream of the typical bottleneck rather than around the bottleneck itself. This reduces the risk of a bottleneck shifting ‘out of control’. But similar to ConWIP systems, this needs to be carefully considered so as not to incorporate too many stations within the control loop. The more stations that are contained in the control loop, the less control can be exercised. So a trade-off has to be made between the risk of losing control of the bottleneck and the negative performance impact of having too many stations in the control loop. The risk of losing control of the bottleneck can be minimized via the appropriate use of protective capacity; in other words, management can seek to ensure that stations downstream of the controlled station (i.e. assumed bottleneck) have enough protective capacity.
6.2 Limitations and Future Research
20
performance. Including an extensive set of environmental factors may also shed more light on the relationship between ConWIP and DBR. While previous research has argued that DBR is a better choice than ConWIP, in certain contexts the performance differences between ConWIP and DBR are likely to be negligible. Identifying these contexts and the contingency factors upon which the application of ConWIP vs. DBR is dependent is a major future research direction that emerges from the results of our study.
References
Ashcroft, S.H., 1989, Applying the principles of optimized production technology in a small
manufacturing company, Engineering Costs and Production Economics, 17, 79-88.
Baker, K.R., and Kanet, J.J., 1983, Job shop scheduling with modified operation due-dates, Journal of
Operations Management, 4, 1, 11-22.
Bechte, W., 1994, Load-oriented manufacturing control just-in-time production for job shops,
Production Planning & Control, 5, 3, 292 – 307.
Betterton, C.E., and Silver, S.J., 2012, Detecting bottlenecks in serial production lines – a focus on
interdeparture time variance, International Journal of Production Research, 50, 15, 4158-4174.
Chakravorty, S.S., and Atwater, J.B., 1996, A comparative study of line design approaches for serial
production systems, International Journal of Operations & Production Management, 16, 6, 91-108.
Chakravorty, S.S., 2001, An evaluation of the DBR control mechanism in a job shop environment,
OMEGA, 29, 335–342
Chakravorty, S.S., and Atwater, J.B., 2005, The impact of free goods on the performance of
drum-buffer-rope scheduling systems, International Journal of Production Economics, 95, 347-357.
Craighead, C.W., Patterson, J.W., and Fredendall, LD., 2001, Protective capacity positioning: impact
on manufacturing cell performance, European Journal of Operational Research, 134, 425-438.
Duclos, L.K., and Spencer, M.S., 1995, The impact of a constraint buffer in a flow shop, International
21
Enns, S.T., and Prongue Costa, M., 2002, The effectiveness of input control based on aggregate
versus bottleneck workloads, Production Planning & Control, 13, 7, 614 - 624.
Fernandes, N.O., Land, M.J., and Carmo-Silva, S., 2014, Workload control in unbalanced job shops,
International Journal of Production Research, 52, 3, 679-690.
Fredendall, L.D., Ojha, D., and Patterson, J.W., 2010, Concerning the theory of workload control,
European Journal of Operational Research, 201, 1, 99 – 111.
Fry, T.D., Philipoom, P.R., Leong, G.K., and Smith, A.E., 1987, An Investigation of Bottleneck
Position in a Multi-Stage Job Shop, International Journal of Operations & Production
Management, 7, 6, 55–63.
Gilland, W.G., 2002, A simulation study comparing performance of CONWIP and bottleneck-based
release rules, Production Planning & Control, 13, 2, 211 – 219.
Glassey, C.R., and Resende, M.G., 1988, Closed-loop job release control for VLSI circuit
manufacturing, IEEE Transactions on Semiconductor Manufacturing, 1, 36 – 46.
Goldratt, E.M. and Cox, J., 1984, The Goal: Excellence in Manufacturing, North River Press: New
York.
Golmohammadi, D., 2015, A study of scheduling under the theory of constraints, International
Journal of Production Economics, 165, 38-50.
Hendry, L.C., Huang, Y., and Stevenson, M., 2013, Workload control: Successful implementation
taking a contingency-based view of production planning & control, International Journal of
Operations & Production Management, 33, 1, 69-103.
Hopp, W.J. and Spearman M.L., Factory Physics: Foundations of Manufacturing Management,
Irwin/McGraw-Hill, 2001.
Kadipasaoglu, S.N., Xiang, W., Hurley, S.F., and Khumawala, B.M., 2000, A study on the effect of
the extent and location of protective capacity in flow systems, International Journal of Production
Economics, 63, 217-228.
Lambrecht, M.R., and Segaert, A., 1990, Buffer stock allocation in serial and assembly type of
22
Land, M.J., and Gaalman, G.J.C., 1998, The performance of workload control concepts in job shops:
Improving the release method, International Journal of Production Economics, 56-57, 347-364.
Land, M.J., Stevenson, M., Thürer, M., and Gaalman, G.J.C., 2015; Job Shop Control: In Search of
the Key to Delivery Improvements, International Journal of Production Economics, 168, 257-266.
Lawrence, S.R. and Buss, A.H., 1994, Shifting production bottlenecks: causes, cures, and
conundrums, Production & Operations Management, 3, 21 – 37.
Lingayat, S., Mittenthal, J., and O’Keefe, R., 1995, An order release mechanism for a flexible flow
system, International Journal of Production Research, 33, 5, 1241–1256.
Mabin, V.J. and Balderstone, S.J., 2003, The performance of the theory of constraints methodology:
analysis and discussion of successful TOC applications, International Journal of Operations &
Production Management, 23, 568-595.
Olhager J., and Persson F., 2008, Using Simulation-Generated Operating Characteristics Curves for
Manufacturing Improvement, In: Koch T. (eds) Lean Business Systems and Beyond. IFIP – The
International Federation for Information Processing, 257, Springer, Boston, MA
Patterson, J.W., Fredendall, L.D., and Craighead, C.W., 2002, The impact of non-bottleneck variation
in a manufacturing cell, Production Planning & Control, 13, 1, 76 – 85.
Plossl, G.W., and Wight, O.W., 1971, Capacity planning and control, Working paper presented at the
APICS International Conference in St.Louis, Missouri.
Radovilsky, Z.D., 1998, A quantitative approach to estimate the size of the time buffer in the theory
of constraints, International Journal Production Economics, 55, 113-119.
Rahman, S., 1998, Theory of constraints: a review of the philosophy and its applications,
International Journal of Operations & Production Management, 18, 336-355.
Roser, C., Nakano, M., and Tanaka, M., 2002, Shifting bottleneck detection, Proceedings of the 2002
Winter Simulation Conference, 1079-1086.
Roser, C., Nakano, M., and Tanaka, M., 2003, Comparison of bottleneck detection methods for AGV
systems, Proceedings of the 2003 Winter Simulation Conference, 1192-1198.
Roser, C., Lorentzen, K., and Deuse, J., 2014, Reliable Shop Floor Bottleneck Detection for Flow
23
Schragenheim, E. and Ronen, B., 1990, Drum-buffer-rope shop floor control, Production & Inventory
Management Journal, 31, 18-22.
Silva, C., Stevenson, M., and Thürer, M., 2015, A Case Study of the Successful Implementation of
Workload Control: A Practitioner-led Approach, Journal of Manufacturing Technology
Management, 26, 2, 280-296.
Simons, J.V. and Simpson, III, W.P., 1997, An exposition of multiple constraint scheduling as
implemented in the goal system (formerly disaster), Production & Operations Management, 6,
3-22.
Spearman, M.L., Woodruff, D.L., and Hopp, W.J., 1990, CONWIP: a pull alternative to kanban,
International Journal of Production Research, 28, 5, 879-894.
Stevenson, M., Huang, Y., Hendry L.C., and Soepenberg, E., 2011, The theory & practice of
workload control: A research agenda & implementation strategy, International Journal of
Production Economics, 131, 2, 689 – 700.
Thürer, M., Stevenson, M., and Silva, C., 2011, Three Decades of Workload Control Research: A
Systematic Review of the Literature, International Journal of Production Research, 49, 23,
6905-6935.
Thürer, M., Stevenson, M., Silva, C., Land, M.J., and Fredendall, L.D., 2012, Workload control
(WLC) and order release: A lean solution for make-to-order companies, Production & Operations
Management, 21, 5, 939-953.
Thürer, M., Stevenson, M., Silva, C., Land, M.J., Fredendall, L.D., and Melnyk, S.A., 2014, Lean
control for make-to-order companies: Integrating customer enquiry management and order
release, Production & Operations Management, 23, 3, 463-476.
Thürer, M., Stevenson, M., and Protzman, C.W., 2016, Card-based Control Systems for a Lean Work
Design: The Fundamentals of Kanban, ConWIP, POLCA and COBACABANA, Productivity Press,
ISBN-13: 9781498746946
Thürer, M., Qu, T., Stevenson, M., Li, C.D., and Huang, G.Q., 2017a, Deconstructing Bottleneck
Shiftiness: The Impact of the Bottleneck Position in an Order Release controlled Pure Flow Shop,
24
Thürer, M., Stevenson, M., Silva, C., and Qu, T.; 2017b; Drum-Buffer-Rope and Workload Control in
High Variety Flow and Job Shops with Bottlenecks: An Assessment by Simulation; International
Journal of Production Economics; 188, 116-127
Watson, K.J., and Patti, A, 2008, A comparison of JIT and TOC buffering philosophies on system
performance with unplanned machine downtime, International Journal of Production Research, 46,
7, 1869-1885.
Watson, K.J., Blackstone, J.H., and Gardiner, S.C., 2007, The evolution of a management philosophy:
The theory of constraints, Journal of Operations Management, 25, 387-402.
Wiendahl, H.P., Gläßner, J., and Petermann, D., 1992, Application of load-oriented manufacturing
control in industry, Production Planning & Control, 3, 2, 118 – 129.
Yu, C., and Matta, A., 2016, A statistical framework of data-driven bottleneck identification in
25
Table 1: Summary of Simulated Shop and Job Characteristics
Sh o p Cha ra c te ri s ti c s Routing Variability Routing Direction No. of Stations Interchange-ability of Stations Station Capacities
Fixed sequence; no-re-entrant flows Directed routing (Pure flow shop: PFS) 7 No interchange-ability All equal J o b Cha ra c te ri s ti c
s No. of Operations per Job
Operation Processing Times (bottleneck) Operation Processing Times (non-bottleneck)
Due Date Determination Procedure Inter-Arrival Times
7
Truncated 2–Erlang; (mean = 1; max = 4)
Truncated 2–Erlang (mean = 1; max = 4) times 0.95 (moderate), 0.85 (severe) and 0.75 (very severe)
Due Date = Entry Time + d; d U ~ [28, 36]
26
Table 2: ANOVA Results
Source of Variance Sum of
Squares df
1
Mean Squares F-Ratio p-Value
Lead Time
Buffer Limit 6036.330 9 670.703 564.230 0.000
Release Method (RM) 302.241 1 302.241 254.260 0.000
Bottleneck Position (BP) 811.620 6 135.270 113.800 0.000
Bottleneck Severity (BS) 176001.020 2 88000.509 74029.930 0.000
RM x BP 32.264 6 5.377 4.520 0.000
RM x BS 544074.720 2 272037.360 230000.000 0.000
BP x BS 214.343 12 17.862 15.030 0.000
RM x BP x BS 376.292 12 31.358 26.380 0.000
Error 49865.420 41949 1.189
Percentage Tardy
Buffer Limit 3.482 9 0.387 1200.200 0.000
Release Method (RM) 0.049 1 0.049 151.840 0.000
Bottleneck Position (BP) 0.587 6 0.098 303.470 0.000
Bottleneck Severity (BS) 17.621 2 8.810 27331.920 0.000
RM x BP 0.005 6 0.001 2.380 0.027
RM x BS 48.113 2 24.057 74628.970 0.000
BP x BS 0.151 12 0.013 38.940 0.000
RM x BP x BS 0.135 12 0.011 35.010 0.000
Error 13.522 41949 0.000
Mean Tardiness
Buffer Limit 1812.267 9 201.363 559.970 0.000
Release Method (RM) 276.202 1 276.202 768.090 0.000
Bottleneck Position (BP) 119.817 6 19.969 55.530 0.000
Bottleneck Severity (BS) 5263.377 2 2631.688 7318.490 0.000
RM x BP 27.319 6 4.553 12.660 0.000
RM x BS 18822.390 2 9411.195 26171.710 0.000
BP x BS 62.454 12 5.204 14.470 0.000
RM x BP x BS 185.388 12 15.449 42.960 0.000
Error 15084.618 41949 0.360
Throughput Time
Buffer Limit 19318.259 9 2146.473 3646.820 0.000
Release Method (RM) 380.620 1 380.620 646.670 0.000
Bottleneck Position (BP) 7272.665 6 1212.111 2059.350 0.000
Bottleneck Severity (BS) 77176.431 2 38588.215 65560.630 0.000
RM x BP 73.575 6 12.262 20.830 0.000
RM x BS 333613.270 2 166806.640 280000.000 0.000
BP x BS 578.545 12 48.212 81.910 0.000
RM x BP x BS 698.055 12 58.171 98.830 0.000
Error 24690.687 41949 0.589
1) degrees of freedom
Table 3: Results for Scheffé Multiple Comparison Procedure: Release Methods
Rule (x) Rule (y) Lead Time Percentage Tardy Mean Tardiness Throughput Time
lower1) upper lower upper lower upper lower upper
[image:26.595.118.482.678.735.2]27
Figure 1: Drum-Buffer-Rope Non
Bottleneck
Bottleneck (Drum)
Non Bottleneck
Market (Drum) Shop Floor
Pre-Shop Pool
Constraint Buffer
28
[image:28.842.107.741.70.485.2](a) (b) (c)
29
[image:29.842.102.749.68.484.2](a) (b) (c)