A Human-Perceived Softness Measure of Virtual 3D Objects
MANFRED LAU,
Lancaster University, City University of Hong KongKAPIL DEV,
Lancaster University [image:1.612.105.510.199.299.2]JULIE DORSEY,
Yale UniversityHOLLY RUSHMEIER,
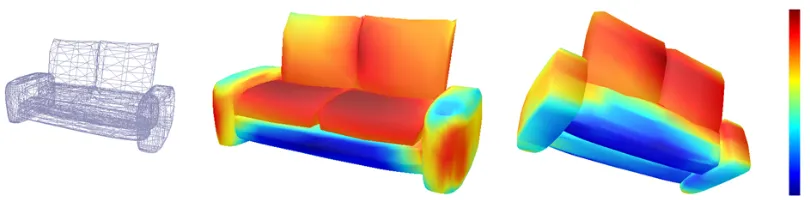
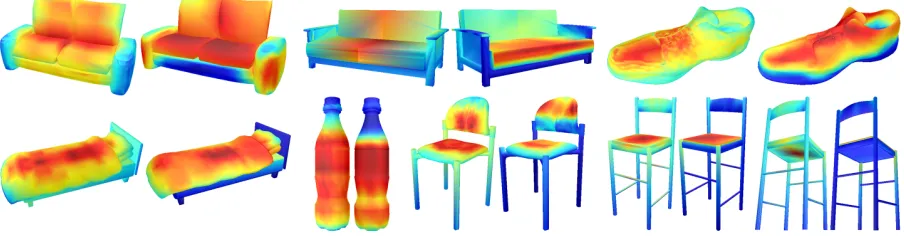
Yale UniversityFig. 1. An input 3D object and softness map computed by our approach (front and back views). The jet colormap corresponds to relative softness values (blue is least soft and red is most soft).
We introduce the problem of computing a human-perceived softness measure for virtual 3D objects. As the virtual objects do not exist in the real world, we do not directly consider their physical properties but instead compute the human-perceived softness of the geometric shapes. In an initial experiment, we find that humans are highly consistent in their responses when given a pair of vertices on a 3D model and asked to select the vertex that they perceive to be more soft. This motivates us to take a crowdsourcing and machine learning framework. We collect crowdsourced data for such pairs of vertices. We then combine a learning-to-rank approach and a multi-layer neural network to learn a non-linear softness measure mapping any vertex to a softness value. For a new 3D shape, we can use the learned measure to compute the relative softness of every vertex on its surface. We demonstrate the robustness of our framework with a variety of 3D shapes and compare our non-linear learning approach with a linear method from previous work. Finally, we demonstrate the accuracy of our learned measure with user studies comparing our measure with the human-perceived softness of both virtual and real objects, and we show the usefulness of our measure with some applications.
CCS Concepts: •Computing methodologies→Perception;Shape analysis;
Additional Key Words and Phrases: 3D modeling, fabrication, crowdsourcing, learning
ACM Reference Format:
Manfred Lau, Kapil Dev, Julie Dorsey, and Holly Rushmeier. 2018. A Human-Perceived Softness Measure of Virtual 3D Objects. ACM Transactions on Applied Perception0, 0, Article 0 (March 2018), 19 pages.
https://doi.org/0000001.0000001
Permission to make digital or hard copies of all or part of this work for personal or classroom use is granted without fee provided that copies are not made or distributed for profit or commercial advantage and that copies bear this notice and the full citation on the first page. Copyrights for components of this work owned by others than ACM must be honored. Abstracting with credit is permitted. To copy otherwise, or republish, to post on servers or to redistribute to lists, requires prior specific permission and/or a fee. Request permissions from [email protected].
© 2018 Association for Computing Machinery. XXXX-XXXX/2018/3-ART0 $15.00
1 INTRODUCTION
There are many physical properties of real-world objects that are identifiable by humans. Softness or compliance [51] is one such property. Objects in our daily lives frequently have parts with varying softness. For example, a couch, bed, or shoe has varying softness that humans may identify just by observing it. In this paper, we consider thesoftness of virtual 3D shapesas opposed to physical objects. Our definition of softness of virtual 3D shapes is as follows: a human thinks of the softness of a virtual object given only its geometric shape, and imagines the virtual shape as a real-world object and pressing into points on its outer surface towards the direction of the surface normal; if he/she can imagine pressing into the virtual shape, then the more easily the virtual point can be “pressed”, the more soft it is. Note that this “perceived softness” may not be the same as the actual softness of a physical object (as there is no physical object). Also, this “perceived softness” comes from a human just visually observing the shape. Computing the spatially varying perceived softness of an object can be useful for both rendering and fabrication. For the appearance of rendered objects in virtual environments, we can use this property to convey a sense of softness of objects in a scene. For fabrication, we can use this to manufacture virtual shapes into real objects that are consistent with user expectations.
The perception of softness when an object is touched depends on physical properties such as stiffness and Young’s modulus [51]. However, humans can make judgements on softness without touch, but just by looking at objects. We are inspired byThurstone’s law of comparative judgment, as we studyhow humans perceive objects
rather than performing any measurements of physical objects. We also use the concept ofpairwise comparison
when asking users to compare between pairs of points on a shape. While the softness of a real object may be physically measured, the softness of virtual objects is difficult to measure and hence we rely on human perception. Our approach is to collect crowdsourced data of human perception which will gather the crowd’s consensus to compute softness. We expect humans to recognize the object or parts of it unconsciously as a real object even though the only information provided is a 3D virtual shape (or images of it). This perceived context and recognition of objects will be included in the collected data itself, and be incorporated into our softness measure as it is learned from the collected data.
In an initial experiment, we study the human perception of softness of virtual 3D shapes. We find that humans make consistent choices when given pairs of vertices on a virtual 3D shape and asked to select the one that they perceive to be more soft. This motivates our framework of gathering data on the human perception of softness and learning from the data to compute a softness measure for virtual 3D objects. We solve the problem of taking as input a 3D shape and computing as output the softness of every vertex on the shape. This is a challenging computational problem, as the virtual model may not necessarily give any information about the physical aspects of the shape. On the other hand, we hypothesize that humans have great intuition at recognizing such softness information for many virtual geometric shapes and can often associate some form of perceived softness to them even with no color or texture. However, while a human finds it difficult to assign an absolute softness value to a single shape vertex, he/she can typically rank whether one point on a shape is softer than another. Hence we do not, for example, solve our problem with a regression approach. The user-labeled pairwise data leads us to a ranking-based approach. Our approach is inspired by recent methods for learning perceptual measures for 2D clip art [15], font selection [36], product design [2], and 3D models [29, 32, 33]. We apply the concept of learning from crowdsourced data for the problem of computing perceptual softness of virtual 3D models.
softness information computed by our approach.
This paper is a comprehensive version of our earlier work [28]. Our contributions are:
• We introduce the problem of computing a human-perceivedsoftness measure for virtual 3D shapes.
• We show that given even a virtual 3D shape, humans can perceive softness properties of the shape as if it were a real object, and this perceived softness is consistent across different shapes and people.
• The perceived softness is a perceptual property that can be learned. We show that with just a virtual 3D shape, we can predict its perceived softness. We “close-the-loop” by showing that the computed perceived softness matches with human perception.
• We demonstrate the effectiveness of the non-linear softness function in this paper by comparing it with the linear function from our previous work.
• We analyze the learned softness measure with user studies and show its potential applications.
2 RELATED WORK
Our method generates crowdsourced relative softness maps for virtual 3D models. We discuss previous work in several related areas: human perception, haptic devices and interfaces, crowdsourcing and learning, geometry modeling, physics-based deformations of 3D shapes, and computational fabrication.
2.1 Human Perception
Human perception is a large research area and we describe related work in the context of the perception of properties of virtual objects including 2D images, textures, and 3D shapes. Users can perceive textures [31] on the desktop by modifying the cursor’s motion on the screen. Studies have shown that macroscopic textures such as bumps and holes can be identified by users this way. Dominjon et al. [12] explores the perception of the mass of virtual objects. Users identify the heavier of two virtual balls with a haptic interface and with visual information from a display. Garcia et al. [16] studies the perception of deformations in 3D shapes. They present a new method which adds local deformations to modal analysis simulations in order to improve the realism of the overall deformations. Sanz et al. [43] allows users to perceive local elasticity in images. When a user interacts with an image with a mouse, their system gives visual feedback and generates deformation effects to induce the perception of stiffness in the image. Punpongsanon et al. [42] manipulates the softness perception of an object by virtually projecting deformation and appearance effects on the object. While a lot of perception related research relies on stimulating human perception for conveying information, we investigate the expectation of the user (softness in our case) instead of providing a pre-defined feedback to be perceived by the user.
2.2 Haptic Devices and Interfaces
them physically with fingers and hands [40]. Various types of stimuli [13] were used by participants to judge the softness of real rubber objects with deformable surfaces. These include haptic-only, vision-only, and visual-haptic stimuli, where visual stimuli refers to watching another participant touch an object with his/her fingers. Stiffness identification user experiments with a force-feedback device [10] have measured the number of stiffness or force-magnitude levels that can be reliably identified. Stiffness discrimination [19] has been explored with a haptic device capable of measuring and displaying force. Experiments with visual, proprioceptive motion, and a combination of these feedback were performed to analyze how humans perceive stiffness. While the above previous work all involve some kind of physical contact, our softness measure is not based on any physical contact as a human only observes virtual shapes and perceives softness from them.
2.3 Crowdsourcing + Learning
Our overall framework uses a combination of crowdsourcing and learning, and there exists previous work in applying these techniques to solve problems related to 2D art, images, and 3D shapes. Our algorithm is inspired by previous crowdsourcing approaches for learning perceptual measures of 2D clip art [15], fonts [36], and 3D shapes [29, 32, 33]. We use the overall concept of computing features of 3D shapes and a ranking-based learning method in our previous work [28] and thelinearmethod in this paper. Thenon-linearmethod combines the ranking-based learning and a multi-layer neural network [28]. Crowdsourcing has been applied to solve vision problems such as extracting depth layers and image normals from a photo [17], and to convert low-quality inputs of drawings into high-quality outputs [18]. For 3D shape analysis, “Schelling points” [8] on surfaces of 3D meshes can be found by first having humans select them in a coordination game and then learning them for new meshes. In our work, we take a crowdsourcing and learning approach for a different problem of computing softness information for a virtual 3D shape.
2.4 Geometry Modeling
There exists work in analyzing thevirtual properties of 3D shapesfor various purposes. Some of these relates to our work as a general understanding of shapes can help to identify softness information. For example, there are many methods for segmenting 3D models [7]. Segmenting into parts may provide some information as an individual part may be made of similar material and have similar softness. If one can simultaneously segment and label parts in 3D models [26], it may be possible to gather some information about softness from the labels. However, humans may still have to specify such information between labels and softness beforehand. Our work computes the softness of each vertex in one step, which may help to avoid potential errors introduced in an intermediate labeling or segmentation step.
Learning the material parameters including color, specularity, gloss, and transparency of 3D meshes has been performed from the geometric shape of objects [24]. Although we predict the softness of a shape based on its geometry, we do not directly infer its material properties.
2.5 Physics-based Deformations of 3D Shapes
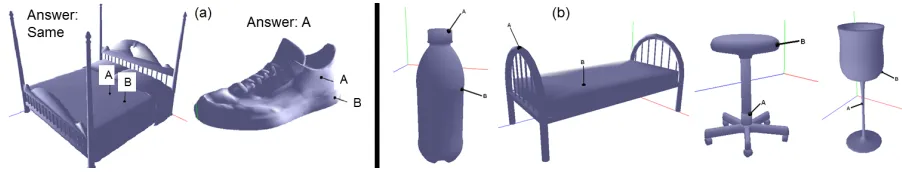
Fig. 2. (a) Two examples of images with answers chosen by us given as part of the instructions for Amazon Mechanical Turk HITs. Text instructions were given to users: “Imagine the object as a real-world object and physically pressing into it at points A and B with your finger, in the direction of the small line and towards the object. Choose whether point A or B is softer, or that they have the same softness. Please choose what you believe to be the best answer in each case.” (b) Four examples of HIT images we used.
2.6 Computational Fabrication
There has been previous work on fabricating objects to resemble virtual shapes. Bickel et al. [3] fabricate real-world objects with desired softness or deformable properties. Lau et al. [30] build real-world furniture by generating parts and connectors that can be fabricated from an input 3D model. Bacher et al. [1] fabricate articulated characters from skinned meshes. Hildebrand et al. [20] decompose a 3D shape into parts that are fabricated in an optimal direction. Schwartzburg et al. [45] and Cignoni et al. [11] generate interlocking planar pieces that can be laser cut and slotted together to resemble the original 3D shape. Piovarči et al. [41] construct a perceptual model of compliance to create corresponding real-world objects. In our work, we compute softness information on the surface of a 3D shape from its geometry alone. We focus on studying how humans perceive virtual 3D models. This can also allow for the fabrication of virtual models with softness consistent with user expectations.
3 INITIAL USER EXPERIMENT: CONSISTENCY OF HUMAN LABELS
We perform an initial user experiment to try to answer this question: how consistent is the human labeling of softness on virtual 3D shapes? We wish to find if we can trust humans to identify softness properties of virtual 3D shapes. In particular, we ask humans to observe two labeled points on a virtual 3D shape shown on an image and decide which point is softer. This experiment is intended to help us to further motivate our overall solution for computing a human-perceived softness measure.
3.1 Task and Procedure
The key task for the participants is to choose between two points on a 3D model shown in an image. We prepare the images beforehand for humans to label. We collected eight 3D models (chair, couch, bottle, shoe, bed, stool, table, and wineglass) from Trimble 3D Warehouse.
It is difficult for humans to provide absolute softness values (for example, to provide a real-number value to a single surface point). The idea is then to ask humans to compare the softness between pairs of points which is much easier, similar to [15] where humans can compare relative styles of 2D clip art more easily. Hence we ask humans to compare between pairs of points on a 3D model and decide which one is softer (or that they have the same softness).
[image:5.612.77.528.103.189.2]responses chosen by us (Figure 2a). Each HIT (Human Intelligence Tasks or a set of tests on Amazon Mechanical Turk) then consists of 50 images (see Figure 2b for some examples). For each image, the human selects either “A” or “B” if one of the labeled points is softer, or “same” if he/she thinks that both points have the same softness. We prepared two HITs with between 10 and 20 images for each 3D model, and we requested twenty participants for each HIT. The crowdsourced data may be unreliable. Before a user can work on the HITs, he/she needs to pass a “qualification” test by correctly answering at least four of five images. In addition, for each HIT, we have five control images and if the user incorrectly answers more than two of them, we reject the data for that HIT. While there are advantages and disadvantages to these qualification test and control images, we chose to include them, as they can provide a filter to avoid users from giving random responses just to get paid on Mechanical Turk.
3.2 Apparatus and Participants
Once the images were prepared, we place them on Amazon Mechanical Turk as described above. There were 23 different participants as some did not do both HITs. We paid $0.20 for each HIT. We expect a user to take about a few seconds for each image. The mean time between accepting and submitting each HIT for all users was 6.4 minutes (Std=3.1).
3.3 Initial User Experiment: Results
We had 2 HITs, 50 images per HIT (with between 10 and 20 images for each model type), and 20 responses for each image. Thus the total number of responses is 2 x 50 x 20. We rejected 5 out of the 40 total sets of HIT responses based on the control images. To analyze the results, we take the responses (A, B, or same) for each image and take the frequency (as a percentage) of the most common response. We compute the mean of all such percentages for each type of model (Table 1). The percentages are consistently high across the model types.
Model Type Mean (%) Std (%)
Bed 90.29 12.55
Bottle 92.78 6.44
Couch 81.67 13.37
Chair 86.39 12.02
Shoe 98.33 3.75
Stool 99.41 1.86
Table 84.12 11.78
Wineglass 76.47 9.61
Overall 88.61 12.13
Table 1. Results of the initial user experiment showing the consistency of human labels.
3.4 Initial User Experiment: Discussion
The results show that users are consistent among each other in this simple task of labeling softness, and there is consistency across a variety of 3D shapes. The wineglass model is intended to be a solid wineglass and the responses were intended to be “same” regardless of the points on the shape. However, some users decided otherwise and chose a response according to their perception, and thus the wineglass has the lowest but still reasonable percentage. The overall percentage is consistent with the literature that reports similar results of user consistency for identifying style of 3D shapes [33].
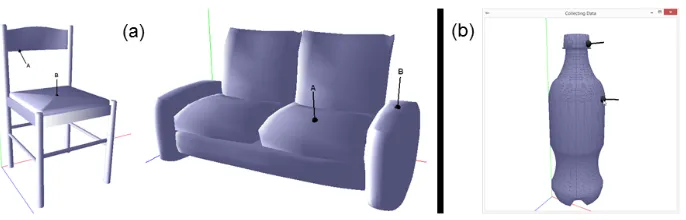
Fig. 3. Collecting Softness Data: (a) Two example HIT images we used. (b) Screenshot of software where user directly selects pairs of vertices and specify which is softer (or same).
labeling based solution. We note that the learning method optimizes for the best possible overall ranking based on the collected data and some inconsistency can be handled robustly.
4 COLLECTING SOFTNESS DATA
The initial user experiment motivates us to leverage human data to solve our problem. In this section, we describe the process for collecting softness data. This data will then be used to learn a softness measure.
We collected 160 3D models from online datasets: Trimble 3D Warehouse and ShapeNet [4]. We find on ShapeNet the categories of shapes that have soft parts. The 3D models represent various types of objects including chairs, couches/sofas, beds, shoes, sandals, bottles, backpacks, baskets, and handbags.
We used two methods to collect data. The first method is the same as the images used in the initial user experiment (previous section). We generated images of pairs of points on each 3D model and asked humans to label them on Amazon Mechanical Turk. A human rater is initially given instructions and example images with responses (Figure 2a). Each HIT then consists of 50 images (see Figure 3a for some examples). To reduce the possibility of unreliable crowdsourced data, we use the same ideas as before of a qualification test before the HITs and control images within each HIT. We rejected 7.3% of HITs. We paid $0.20 for each HIT, and we had 112 users and 6080 samples of data (each sample is one image).
The second method is a software tool we provide to users to select pairs of vertices. The reason for having another method is an attempt to collect more reliable data as we can give more guidance to the users from the start. We do not reject any data collected with this method. The user visualizes a model in 3D space and directly clicks on a vertex with the mouse to select it (Figure 3b). The user then provides the label for each pair of vertices (i.e. which vertex is softer or same) with a keyboard press. A user can label hundreds of samples each hour and we pay $10 per hour. For this method, we had 15 users and collected 7000 samples.
Note that the users only labeled data for a relatively small number of pairs of vertices, and it would be tedious for a human to label all the vertices of even one 3D model in the training data. From the data collection, we have two sets of labelled dataIandE. Each pair of vertices labeled as having one vertex being softer is in the inequality setI, while each pair labeled as having the same softness is in the equality setE. Each pair or each sample of data has two different vertices, and some vertices are repeated across samples.
5 LEARNING HUMAN-PERCEIVED SOFTNESS MEASURE
In this section, we describe how we learn a softness measure with the collected data. We have training data
X={x1, . . . ,xh}and the corresponding label setsIandEeach containing pairs of(xi,xj). The variablexis the
The results in this paper are generated with a non-linear softness measure. We compare this with a linear measure from previous work which we also describe. In both cases, the training data is the same. The main idea is to use the learning-to-rank concept with the ranking-based training data (i.e. one vertex more soft than another). Our method learns the weights for a function (non-linear or linear) that computes a softness value for a vertex.
5.1 Non-Linear Softness Function
The key idea is to use a learning-to-rank approach (to handle the ranking-based data) to learn a non-linear function (which is a multi-layer neural network). The learning framework is similar to the one in [29] but we apply it for our softness problem. We refer the reader to [29] for the implementation details and only describe the overall idea here.
We represent a 3D model with multiple depth images from various viewpoints. The non-linear function is a neural network that gives the softness for a vertex. The input of the neural network isx, which is a smaller and subsampled patch of a depth image where the patch center is the location that the vertex maps to in the depth image. The output isywhich is the softness (at the viewpoint of that depth image) of the patch center or the vertex. The multi-layer neural network can be represented by the functiony=hW(x), whereWrepresents the
weights and biases of the neural network. Note that the network is only for each view or each depth image and we compute the softness for multiple views and combine them to compute the softness of each vertex.
5.2 Linear Softness Function
This is the linear function that we compare against in Section 6 and is the existing softness measure in [28]. To learn the relation from a vertex to a softness value, we define a feature vector (x) for a vertex on a 3D model. We provide a high-level description of the features here and refer the reader to the appendix for more details. We build a feature vector with descriptors that are based on geometry alone. The main aspects of the features relate to the 3D shape (D2 Shape Distribution [37], Gaussian Image [21]), projected 2D shapes (Light Field Descriptor [6, 46]), and curvatures (Gaussian and Mean curvatures [47], Sobel operators on voxels). We compute a 117-dimensional feature vectorxfor each vertex.
For our linear function, we assume that the softnessf(x)of a vertex with feature vectorxis linear:f(x)=W⊤x.
Wis a weight vector here but we keep it capitalized such that the notation is consistent for both cases in the learning-to-rank formulation.
5.3 Computing Softness Measure with Learning-to-Rank
We take a learning-to-rank formulation for both the non-linear and linear cases. The non-linear case originates from the multi-view deep ranking approach in [29]. The linear case originates from the learning-to-rank method known as RankSVM [5] and is the softness measure in [28].
We minimize the rank cost functional over the set of training data inputsX={x1, . . . ,xh}and the
correspond-ing label setsIandE:
L(W)= 1
2∥W∥
2+C Õ
(i,j)∈I
l1(d(xi,xj))+C Õ
(i,j)∈ E
l2(d(xi,xj)) (1)
where the first term is a standard regularizer to prevent over-fitting andCis a hyper-parameter. We use:
l1(t)=max(0,1−t)2 (2)
l2(t)=t2 (3)
d(xi,xj)=hW(xi) −hW(xj) for non-linear case (4)
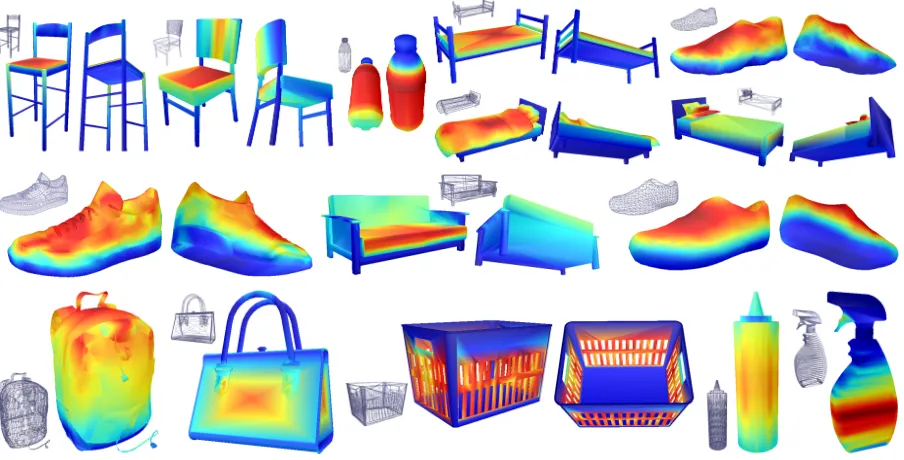
Fig. 4. Results: Input 3D models and corresponding softness maps (front and/or back views). Note that these are crowdsourced results and each result may not necessarily match with the perception of one person.
To minimize the ranking loss function, for the non-linear case, we perform an end-to-end neural network backpropagation with batch gradient descent but with a formulation that is compatible with learning-to-rank and the ranking-based data. Notably there are four copies of the network during the forward propagation and backpropagation, in contrast to the training of a usual neural network (see [29] for more details).
For the linear case [28], the energy functionLis minimized using the primal Newton method as originally developed by Chapelle [5] for inequality constraints and subsequently adapted by Parikh and Grauman [38] for equality constraints.
5.4 Using Learned Softness Measure
For the non-linear case, for each vertexvi, we choose a set of viewsviewjwherevi is visible and compute the subsampled patchesx(viewj)
i . We computehW(x (viewj)
i )for eachjwith the learnedW, and take the average of
these values to get the softness value forvi.
For the linear case, the learnedWvector has the same dimensions asx. The learned softness measure for a vertex with feature vectorxisf(x)with the learnedW.
Since the data and method are ranking-based, the learned measures provide relative softness values (and not absolute values) and they make more sense when compared to each other.
6 RESULTS COMPUTED WITH SOFTNESS MEASURE
We first demonstrate our framework by showing results computed with the learned softness measure.
Fig. 5. We took a real chair, bottle, and shoe, created 3D models of them and computed softness maps. We also used these objects in our user study.
that the learning has not seen. We generate the results by computing the softness values for each vertex, and then mapping them (while maintaining the ranking) to[0,1]so each vertex can be assigned a color for visualization purposes. For the jet colormap, red is more soft and blue is less soft. The softness results should be interpreted as follows (as this is how the data was collected): we should imagine the virtual shape to be a real object and to press into the object in the direction of the surface normal. Since our results provide a relative ranking, we should not compare between the colors across two or more shapes. For example, a vertex colored red in one shape can possibly be less soft than a vertex colored yellow in another shape. After the weights have been learned, computing the softness value for a vertex requires only a usual forward propagation of the neural network which is interactive.
Quantitative Evaluation. Besides the qualitative results in visualizing the softness maps, we aim to have some quantitative evaluation. We took fifteen example 3D meshes. For each mesh, we selected fifteen vertices and computed the ranking of their softness with our algorithm. We then labeled these vertices with relevance values according to our perception, where higher relevance is more soft. Note that we performed this ground truth labeling manually ourselves in this section, while participants were used in the next section (user study) for this kind of labeling. Since we have sets of fifteen vertices here, we use the NDCG (Normalized Discounted Cumulative Gain) measure. The NDCG ranking measure is used in information retrieval [25], which we apply to our algorithm to give some indication of accuracy in our overall framework. We computed the NDCG measures and they ranged from 0.87 to 1. This shows that our softness measure provides rankings that highly correspond to the human perception of softness.
Fig. 6. Comparison between Non-Linear and Linear Learning: Each pair shows the results for the linear case on the left and the non-linear case on the right.
Limitation Cases. There are two types of limitation cases. For the first case, if we have object types that we have no training data for, our method may not work. However, this is expected as our method isdata-driven. A human who has never seen an object of a specific type may not have much intuition about its softness or other properties.
For the second case, if a 3D model represents an object that is not intended to have any soft parts (e.g. a wooden chair or a steel bottle), our method will still produce results matching the crowdsourced data (which for example contains chairs with mostly soft seats and bottles that are mostly plastic). Hence our method will still rank the vertices from least to most soft. This would not match with the correct answer, which in this case is that there are no soft parts and all vertices have the same softness.
Comparison between Non-Linear and Linear Learning. Figure 6 shows a visual comparison of the results between the two cases. In general, the non-linear case is more accurate and can more clearly identify parts that are not soft at all (e.g. frame of bed or chair). We describe some interesting aspects of each result. For the first couch, there are quite some visual differences between the two cases. For the non-linear case, the side of the couch is red/yellow and more soft than the front bottom part which is blue. Indeed we have examined the original training data pairs to observe that there are data pairs where the side of the couch is perceived to be more soft than the front bottom part. However, the linear case result reverses this training data. Hence there is evidence that the non-linear case is more accurate than the linear case. For the second couch, the non-linear case has the front part of the seat cushion being more red and more soft than the back part. Again this is more accurate than the linear case result. For the shoe, the non-linear case has the top part being more soft and the bottom of the shoe being not soft and colored dark blue. This is more accurate according to the training data for the shoes. For the bed, the frame is more clearly dark blue and not soft for the non-linear case which is more accurate. For the bottle, the depressed region of the cylindrical shape near the bottom is yellow and perceived to be less soft for the non-linear case. For the chair with the soft back, the top part of the back is red and more soft for the non-linear case, in contrast to the linear case. For the tall chair, the frame for the non-linear case is all blue and not as soft, including from the bottom of the seat (seen from the bottom view).
bottle, for a total of 123 testing data samples. As we have many pairs of vertices here, the NDCG measure used previously does not apply. The accuracy here is the percentage of data pairs where our method is correct. The accuracy for the linear measure is 81.3% and for the non-linear measure is 90.2%.
7 USER STUDY
We perform a user study to show that the learned softness measure is accurate and that our approach can produce a useful measure that is comparable to the human perception of both virtual and real-world objects.
7.1 User Study Task and Procedure
There are tasks involving either virtual or real-world objects. The overall idea of the tasks is the same in having users label points on objects based on their perceived softness. At the start of a session, we explained to each user the tasks of the study and each user answered two questions about their previous experiences in computer science and in 3D modeling software.
Task 1: Pairs of Points on Virtual Shapes.The idea here is the same as in the initial user experiment (Figure 2). Participants observe virtual shapes with two selected points and choose the softer point (or same). They are given the same instructions as in the crowdsourced HITs, except the shapes are not provided to them on Mechanical Turk but we provide them with a program. We collected a new test set of 10 3D models. Each user was given 5 of the 10 models picked randomly beforehand. We provide the user with a program that randomly selects 16 pairs of vertices for each of the 5 models. The user can see each pair of vertices by rotating the 3D model if needed (the rotation is only for visualizing vertices if they are occluded and does not provide additional information). One pair of vertices for each model is a control sample to check for quality. There are 5 of these and if a user provides 2 or more responses that do not match ours, we reject that user’s responses for this task.
Task 2: Pairs of Points on Real-World Objects.The participants label pairs of points on real objects. We took a real bottle, chair, and shoe, and created corresponding 3D virtual models of them (Figure 5). Each user was given two of the three objects picked randomly beforehand. They were instructed to choose 15 pairs of random points on each object by pointing to them directly and then to choose the softer point (or “same”) by pressing on them to test their perceived softness. They were asked to pick points evenly on the object’s surface. For each pair of points, we record their positions manually by observing the corresponding virtual model and recording the approximate vertex of each point.
Task 3: Set of Points on Real-World Objects.The participants label a set of points on the real objects (used in Task 2) and rank them together. Each user completed Tasks 2 and 3 for one object first before starting with the second. They were instructed to choose 15 random points on each object, by sticking a small label on each point of the object. After the points were chosen, they were ranked from the most soft to the least soft where ties were possible. Each user tells us this ranking and we record each point’s position as in Task 2.
At the end of the session, each user answered two questions on whether they believe it was hard or easy (five point Likert scale and reason) to choose the softer point from one of two points and to rank 15 points together. They were also asked to provide any comments to the user study in general.
7.2 User Study Apparatus and Participants
All participants reported that they have experiences with computers in general, while five mentioned that they have programming skills. Three participants have previous experiences with 3D modeling tools such as Blender or Maya. The accuracy measure for Tasks 1 and 2 below is the percentage of correct data pairs, as the data is in the form of pairs of vertices. The accuracy measure for Task 3 is the NDCG measure, as the data is in the form of sets of fifteen vertices.
Task 1.We have 15 users x 5 models x 15 responses. No user responses were rejected based on the control samples. For each “A” or “B” response (305 and 395 of each respectively), we compute the softness of the vertex pair with our learned measure and see if it matches with the user response. All the results from our learned measure is either “A” or “B” as the measure gives real values, and it is difficult to judge when two real numbers are close enough for them to be the “same”. The accuracy of our measure is 91.43%.
For each user response labeled “same” (425 of these), we compute the absolute difference of the softness values from our measure between the two vertices. The mean of these absolute differences is 0.083 (Std=0.096). For comparison purposes, we also compute the differences for the “A” and “B” responses. In this case, if the response is “A”, we compute the softness for vertex “A” minus the softness of vertex “B”, which can be negative if our measure is incorrect. The mean of these is 0.260 (Std=0.194). We perform a two-samplet-test assuming unequal variances and find a significant effect (t=-5.595;p <0.001) between “same” and “A/B” responses.
Task 2.We have 15 users x 2 models x 15 responses. As we rejected no users from Task 1, we also do not reject users here. For each “A” or “B” response (116 and 144 of each respectively), we compare between them and the predictions from the learned measure as in Task 1. The accuracy of our measure is 92.31%. For each user response labeled “same” (190 of these), we compute the mean of the absolute differences of softness from our measure to be 0.082 (Std=0.086). For comparison purposes, we again compute the differences for the “A” and “B” responses. The mean of these is 0.399 (Std=0.310). We perform a two-samplet-test assuming unequal variances and find a significant effect (t=-7.715;p<0.001) between “same” and “A/B” responses.
Task 3.We have 15 users x 2 models x set of 15 points. For each set of 15 points, we compute the NDCG ranking measure used in information retrieval [25], which uses the ranking from the user responses and the ranking given by our softness metric. The mean NDCG is 0.93 (andStd=0.06). This large mean value shows that our metric provides softness that matches with those perceived from real-world objects.
Choosing one of two points vs. Ranking fifteen points.For the questions at the end of each session, the participants indicated that it was easy to choose between one of two points to be softer (Mean=4.27, Std=0.88) and also that it was easy to rank a set of fifteen points at the same time (Mean=4.20, Std=0.77). A two-sample
Fig. 7. Applications. Left: Personalized Softness Metrics. An input chair model and two different softness maps from two different users. Right: Fabrication Example. (a) An input 3D model of the bottom part of a sandal, the softness map computed by our method, and the softness values discretized into three types for fabrication purposes. (b) The sandal fabricated with layers of felt material. We also show (small inset images) some simple ways we experimented with to adjust the softness (e.g. adding a harder card piece, cutting a hole, or stripes of holes) if we were to press top-down into the object to match the values our method computed.
7.4 User Study Discussion
The results show that our learned measure is accurate when compared to the human perception of softness for both virtual shapes and real-world objects. The results (i.e. % accuracy, mean,t-test) between Tasks 1 and 2 are similar, indicating a similarity between virtual and real-world objects where users can perceive softness just as well in either case.
An interesting aspect is that the results from this study were not rejected compared to the Mechanical Turk results, using the same rejection criteria. Hence it seems that in-person participants were more reliable than those from Mechanical Turk, but more work is needed to investigate this further.
One limitation with real-world objects is that we can only experiment with a small number of objects, as there is a physical limit to testing real-world objects with humans compared to the potentially larger scale of Mechanical Turk.
For the two questions regarding the difficulty of labeling, it is interesting that it was equally easy to choose from one of two points and to rank fifteen points at the same time. We originally thought that the former would be easier.
8 APPLICATIONS
We show some applications of our softness measure to further demonstrate its usefulness and motivations.
8.1 Personalized Softness Metrics
One potential use of our approach is in learning personalized softness metrics. Figure 7 (left) shows an example. The input chair model is the same for two users. For each user, he/she labels the data (100 HIT images) according to his/her preferences. We learn a personalized softness metric for each user and generate personalized softness maps. Our method works well even for a small amount of data. More importantly, we can get different results for the same shape. This differentiates our work from previous physics-based methods as there are sometimes no right or wrong answers to the perceived softness if it depends on individual preferences.
Fig. 8. Application: Shape Ranking based on Softness Appearance. Two examples of eight shapes ranked according to the perceived softness appearance of each 3D model as a whole, from least soft to most soft. The colors are normalized across all eight chairs or bottles such that we can compare all shapes in each row (for colors in this figure only).
8.2 Fabrication of Virtual 3D Models
We can fabricate a virtual shape into a real object according to the computed non-uniform human-perceived softness. There are many ways to construct a physical prototype object. Inspired by methods to layer materials to fabricate soft objects [23], we choose to experiment with a layering-based technique with felt material for a simple example of the bottom part of a sandal. Shoemaking is a complicated process and we present this only as an example to demonstrate the potential of fabrication as an application. Figure 7a shows the model and the softness map. We discretize the softness values into three types to simplify the fabrication process. To approximate the object shape, we voxelize the 3D shape to create layers of 2D profiles and cut them with felt material (Figure 7b). To approximate the softness, we converted the computed softness to a top-down 2D grid of discretized softness if a human were to press top-down into the real object.
Our fabricated sandal example is just a demonstration of the idea of fabricating objects with our softness measure. More experiments are needed to produce more realistic physical objects and more complex examples either with soft material [23, 39] or printed structures [44]. Furthermore, new fabrication machines provide the ability to print materials with variable stiffness. Users can touch printed samples from such machines to produce their own perceived softness scale for the material. This can allow users to specify softness directly for the material, analogous to choosing paint colors directly from painted samples.
8.3 Shape Ranking based on Softness Appearance
The idea for this application is that our method can rank a set of virtual shapes based on their softness appearance, such that a designer or artist can search from them for use in creating virtual environments. In general, one can rank, search, and/or organize virtual shapes using their perceived softness appearance.
For the eight chairs, the colors are mostly blue as it happens that many parts of most of these chairs are not soft (e.g. chair frames or legs). It is interesting to observe that the least soft chair overall is the left one. The overall chair softness keeps increasing as we move to the right of the set of chairs and we can see this pattern intuitively from the geometry of the shapes. For the eight bottles, the colors are mostly red as it happens that most parts of these bottles are perceived to be soft. There are some interesting patterns that would be more difficult to note if we did not arrange the bottles this way. The bottles that appear to be taller and/or thinner are the most soft overall (near the right of the set). The small circular compressed regions tend to make the overall shape more soft, such that the more of these compressed circles, the more soft the shape is.
9 DISCUSSION, LIMITATIONS, AND FUTURE WORK
We have presented a framework for computing a human-perceived softness measure for virtual 3D shapes. Our framework is flexible since we can add more training data at any time and then re-learn the weights.
There exists measurement devices such as durometers to measure the “Shore” hardness of materials. However, this is mainly for rubber materials and may not apply to the virtual objects that we have. There also exists devices for measuring material stiffness or Young’s modulus, but we do not use such devices as we explore theperceived softness of virtual shapeswhich cannot be directly measured with physical devices. Physically-based simulation methods can be used to compute deformation information of 3D shapes. However, our focus is again on human perception, which may be different from the deformations computed by physically-based methods.
We gave the example of a more creative chair shape where we may get different perception of softness from different users. For more traditional chair shapes or everyday objects, the user responses tend to be consistent in that they match across different people. We only informally describe the terms “creative” and “traditional” here, and more future exploration is needed to differentiate between them.
Our sandal example for demonstrating the application of fabrication is simple. More complex methods can be incorporated in future work, either with printed structures [44] or soft materials [23, 39]. In addition, softness information alone will not be enough for realistically fabricating real objects, and future work may include fabrication by understanding and combining different physical properties of virtual shapes.
If we segment and label [26] an input 3D object first, we may have a better understanding of the shape before assigning softness values. For example, the frame of a bed or the legs of a chair are likely to be not soft. If some parts can be segmented, we may be able to assign a softness value to the whole part rather than for each point on the surface of a shape. Combining segmentation with our method can help to further understand the properties of shapes in future work.
Our work has focused on understanding the perceived softness of a single virtual object. Future work may include understanding the softness of a scene with multiple objects.
A limitation of our method (somewhat described in the second limitation case of the results section) is that there are some models where it can beambiguous even for humansto decide if the object is soft or not soft. For example, a virtual bottle with smooth surfaces may be soft if it is made of plastic or not soft at all if it is made of metal. One possible future work direction is to add an estimate of reliability to the computed softness map.
For many 3D models, humans can perceive softness information well from the geometry alone and we only take the geometric shape as input in our work. In recent work in the perception of 3D shapes [29, 32, 33], considering geometry itself already provides interesting problems, as we believe to be the case in this paper. Another possible future work direction is to also consider other properties such as material [24] or lighting.
ACKNOWLEDGMENTS
Shuran Song, Hao Su, Jianxiong Xiao, Li Yi, and Fisher Yu. 2015. ShapeNet: An Information-Rich 3D Model Repository.CoRR(2015). [5] O. Chapelle and S. S. Keerthi. 2010. Efficient Algorithms for Ranking with SVMs.Information Retrieval Journal13, 3 (June 2010), 201–215. [6] D. Y. Chen, Xiao-Pei Tian, Yu-Te Shen, and Ming Ouhyoung. 2003. On Visual Similarity Based 3D Model Retrieval.Computer Graphics
Forum22, 3 (2003), 223–232.
[7] Xiaobai Chen, Aleksey Golovinskiy, and Thomas Funkhouser. 2009. A Benchmark for 3D Mesh Segmentation.ACM Trans. Graph.28, 3, Article 73 (Aug. 2009), 12 pages.
[8] Xiaobai Chen, Abulhair Saparov, Bill Pang, and Thomas Funkhouser. 2012. Schelling Points on 3D Surface Meshes.ACM Transactions on Graphics (SIGGRAPH)31, 4, Article 29 (July 2012), 12 pages.
[9] Xiang Chen, Changxi Zheng, Weiwei Xu, and Kun Zhou. 2014. An Asymptotic Numerical Method for Inverse Elastic Shape Design.
ACM Trans. on Graphics (SIGGRAPH)33, 4, Article 95 (July 2014), 11 pages.
[10] S. A. Cholewiak, H. Z. Tan, and D. S. Ebert. 2008. Haptic Identification of Stiffness and Force Magnitude.Symposium on Haptic Interfaces for Virtual Environment and Teleoperator Systems(2008), 87–91.
[11] Paolo Cignoni, Nico Pietroni, Luigi Malomo, and Roberto Scopigno. 2014. Field-aligned Mesh Joinery.ACM Trans. Graph.33, 1, Article 11 (2014), 12 pages.
[12] L. Dominjon, A. Lecuyer, J.-M. Burkhardt, P. Richard, and S. Richir. 2005. Influence of control/display ratio on the perception of mass of manipulated objects in virtual environments.IEEE Virtual Reality(2005), 19–25.
[13] Knut Drewing, Andreas Ramisch, and Florian Bayer. 2009. Haptic, Visual and Visuo-haptic Softness Judgments for Objects with Deformable Surfaces.World Haptics - Third Joint EuroHaptics Conference and Symposium on Haptic Interfaces for Virtual Environment and Teleoperator Systems(2009), 640–645.
[14] Mark Foskey, Miguel A. Otaduy, and Ming C. Lin. 2002. ArtNova: Touch-Enabled 3D Model Design.IEEE Virtual Reality(2002), 119–126. [15] Elena Garces, Aseem Agarwala, Diego Gutierrez, and Aaron Hertzmann. 2014. A Similarity Measure for Illustration Style.ACM Trans.
Graph.33, 4, Article 93 (July 2014), 9 pages.
[16] Marcos García, Miguel Anguel Otaduy, and Carol O’Sullivan. 2010. Perceptually Validated Global-local Deformations. Computer Animation and Virtual Worlds21, 3-4 (May 2010), 245–254.
[17] Yotam Gingold, Ariel Shamir, and Daniel Cohen-Or. 2012. Micro Perceptual Human Computation.ACM Transactions on Graphics31, 5, Article 119 (Aug. 2012), 12 pages.
[18] Yotam Gingold, Etienne Vouga, Eitan Grinspun, and Haym Hirsh. 2012. Diamonds From the Rough: Improving Drawing, Painting, and Singing via Crowdsourcing. Proceedings of the AAAI Workshop on Human Computation (HCOMP). (2012).
[19] N. Gurari, K. J. Kuchenbecker, and A. M. Okamura. 2009. Stiffness discrimination with visual and proprioceptive cues.World Haptics Conference (WHC09)(2009), 121–126.
[20] Kristian Hildebrand, Bernd Bickel, and Marc Alexa. 2013. Orthogonal slicing for additive manufacturing.Shape Modeling International (SMI)37, 6 (2013), 669–675.
[21] B. Horn. 1984. Extended Gaussian images.Proc. IEEE72, 12 (1984), 1671–1686.
[22] Qi-Xing Huang, Martin Wicke, Bart Adams, and Leonidas Guibas. 2009. Shape Decomposition using Modal Analysis.Eurographics28, 2 (2009), 407–416.
[23] Scott E. Hudson. 2014. Printing Teddy Bears: A Technique for 3D Printing of Soft Interactive Objects.SIGCHI(2014), 459–468. [24] Arjun Jain, Thorsten Thormählen, Tobias Ritschel, and Hans-Peter Seidel. 2012. Material Memex: Automatic Material Suggestions for
3D Objects.ACM Trans. Graph.31, 6 (Nov. 2012), 143:1–143:8.
[25] Kalervo Järvelin and Jaana Kekäläinen. 2002. Cumulated Gain-based Evaluation of IR Techniques.ACM Transactions on Information Systems20, 4 (2002), 422–446.
[26] Evangelos Kalogerakis, Aaron Hertzmann, and Karan Singh. 2010. Learning 3D Mesh Segmentation and Labeling.ACM Trans. Graph.
29, 4 (July 2010), 102:1–102:12.
[27] Michael Kass, Andrew Witkin, and Demetri Terzopoulos. 1988. Snakes: Active Contour Models.IJCV1, 4 (Jan. 1988), 321–331. [28] Manfred Lau, Kapil Dev, Julie Dorsey, and Holly Rushmeier. 2016. Learning a Human-Perceived Softness Measure of Virtual 3D Objects.
[29] Manfred Lau, Kapil Dev, Weiqi Shi, Julie Dorsey, and Holly Rushmeier. 2016. Tactile Mesh Saliency.ACM Trans. Graph.35, 4, Article 52 (July 2016), 52:1–52:11 pages.
[30] Manfred Lau, Akira Ohgawara, Jun Mitani, and Takeo Igarashi. 2011. Converting 3D Furniture Models to Fabricatable Parts and Connectors.ACM Trans. Graph.30, 4, Article 85 (July 2011), 6 pages.
[31] Anatole Lécuyer, Jean-Marie Burkhardt, and Laurent Etienne. 2004. Feeling Bumps and Holes Without a Haptic Interface: The Perception of Pseudo-haptic Textures.SIGCHI(2004), 239–246.
[32] Tianqiang Liu, Aaron Hertzmann, Wilmot Li, and Thomas Funkhouser. 2015. Style Compatibility for 3D Furniture Models.ACM Trans. Graph.34, 4, Article 85 (July 2015), 85:1–85:9 pages.
[33] Zhaoliang Lun, Evangelos Kalogerakis, and Alla Sheffer. 2015. Elements of Style: Learning Perceptual Shape Style Similarity.ACM Trans. Graph.34, 4, Article 84 (July 2015), 14 pages.
[34] Sebastian Martin, Bernhard Thomaszewski, Eitan Grinspun, and Markus Gross. 2011. Example-Based Elastic Materials.ACM Transactions on Graphics (SIGGRAPH)30, 4 (2011), 72:1–72:8.
[35] Tamotsu Murakami and Naomasa Nakajima. 1994. Direct and Intuitive Input Device for 3-D Shape Deformation.SIGCHI Conference on Human Factors in Computing Systems(1994), 465–470.
[36] Peter O’Donovan, Janis Libeks, Aseem Agarwala, and Aaron Hertzmann. 2014. Exploratory Font Selection Using Crowdsourced Attributes.ACM Trans. Graph.33, 4 (2014), 92:1–92:9.
[37] Robert Osada, Thomas Funkhouser, Bernard Chazelle, and David Dobkin. 2001. Matching 3D Models with Shape Distributions.Shape Modeling International(2001), 154–166.
[38] Devi Parikh and Kristen Grauman. 2011. Relative Attributes.International Conference on Computer Vision (ICCV)(2011), 503–510. [39] Huaishu Peng, Jennifer Mankoff, Scott E. Hudson, and James McCann. 2015. A Layered Fabric 3D Printer for Soft Interactive Objects.
SIGHI(2015), 1789–1798.
[40] H. Petrie, N. King, and P. Tomlins. 2004. Investigations into Sensation of “Softness" and Perception of the Tactile Properties of “Soft Touch" Thermoplastic Elastomers.National Physics Laboratory Report(2004), 1–30.
[41] Michal Piovarči, David I. W. Levin, Jason Rebello, Desai Chen, Roman Ďurikovič, Hanspeter Pfister, Wojciech Matusik, and Piotr Didyk. 2016. An Interaction-aware, Perceptual Model for Non-linear Elastic Objects.ACM Trans. Graph.35, 4, Article 55 (July 2016), 13 pages. [42] Parinya Punpongsanon, Daisuke Iwai, and Kosuke Sato. 2015. SoftAR: Visually Manipulating Haptic Softness Perception in Spatial
Augmented Reality.IEEE Transactions on Visualization and Computer Graphics21, 11 (July 2015), 1279–1288.
[43] Ferran Argelaguet Sanz, David Antonio Gómez Jáuregui, Maud Marchal, and Anatole Lécuyer. 2013. Elastic Images: Perceiving Local Elasticity of Images Through a Novel Pseudo-Haptic Deformation Effect.ACM Transactions on Applied Perception10, 3 (2013), 17:1–17:14. [44] Christian Schumacher, Bernd Bickel, Jan Rys, Steve Marschner, Chiara Daraio, and Markus Gross. 2015. Microstructures to Control
Elasticity in 3D Printing.ACM Trans. Graph.34, 4, Article 136 (July 2015), 13 pages.
[45] Yuliy Schwartzburg and Mark Pauly. 2013. Fabrication-aware Design with Intersecting Planar Pieces.CGF32, 2pt3 (2013), 317–326. [46] Philip Shilane, Patrick Min, Michael Kazhdan, and Thomas Funkhouser. 2004. The Princeton Shape Benchmark.SMI(2004), 167–178. [47] T. Surazhsky, E. Magid, O. Soldea, G. Elber, and E. Rivlin. 2003. A Comparison of Gaussian and Mean Curvatures Estimation Methods on
Triangular Meshes.ICRA(2003), 1021–1026.
[48] Nawel Takouachet, Nadine Couture, Patrick Reuter, Pierre Joyot, Guillaume Rivière, and Nicolas Verdon. 2012. Tangible user interfaces for physically-based deformation: design principles and first prototype.The Visual Computer28, 6 (June 2012), 799–808.
[49] Demetri Terzopoulos, John Platt, Alan Barr, and Kurt Fleischer. 1987. Elastically Deformable Models. InComputer Graphics, Vol. 21. 205–214.
[50] Grit Thürmer and Charles A. Wüthrich. 1998. Computing Vertex Normals from Polygonal Facets.Journal of Graphics Tools3, 1 (1998), 43–46.
[51] Wouter M. Bergmann Tiest. 2010. Tactual Perception of Material Properties.Vision Research50, 24 (2010), 2775–2782.
A 3D MESH FEATURES
For the linear softness measure in Section 5.2, we definedxto be a feature vector for a vertex of a 3D model. In this appendix, we provide more details about this feature vector.
3D Shape Descriptors.We choose a shape descriptor based on distances. We compute theD2 Shape Distribution
2D Light Field Descriptor.This descriptor is intended for gathering information about the global shape from 2D views. All models are originally rotated to be axis-aligned. We compute theLight Field Descriptor[6, 46], adapted for our purpose of computing features for one vertexv. First, we voxelize the model surface into a grid resolution of 100 x 100 x 100. Second, we render the voxel representation into three axis-aligned 2D views, and find the 2D outer contour of the shape in each view. Third, we compute the Fourier Contour Descriptor [6]. For each 2D view, we compute a histogram of 2D distances fromvto all other discretized points on the contour. The distances are normalized as the model is scaled to fit as tightly as possible with the voxelization. The histogram is normalized such that itsL2-norm is 1. Each histogram has 16 bins (we tested with parameters of 16 and 32), and hence we have a total of 48 feature values (= 3 views x 16 bins). The rationale is again that this gives information about the global shape ofMand the approximate location ofvwithin the global shape.
Curvatures.This is intended for gathering information about the local mesh surface curvature. First, we compute Gaussian and Mean curvatures (the discrete version of the Gauss-Bonnet Scheme in [47]). Second, we voxelize the mesh surface as above, and apply Sobel operators at vertexv. We apply 3D 3x3x3 Sobel operators in the x, y, and z directions. Hence we have two curvature values and three Sobel operator values for each vertex.