© 2019, IRJET | Impact Factor value: 7.211 | ISO 9001:2008 Certified Journal
| Page 5228
Power Spectral Density Based Technique for Feature Detection in
SAR Images
Anupama A
1, Lekshmi S
21
Senior Engineer, Keltron Controls Aroor, Alappuzha, Kerala, India
2
Scientist, Naval Physical and Oceanographic Laboratory (NPOL-DRDO), Kochi, Kerala, India
---***---Abstract – Synthetic Aperture Radar (SAR) images areaffected by a special type of granular noise called as the speckle noise. Manifestation of speckle noise often makes automatic feature detection from such images a challenging task.Hence filtering of speckle noise is a crucial step for SAR image segmentation. This paper proposes a novel Power Spectral Density based filtering technique to reduce the speckle noise in the SAR images of the ocean surface and further segment it to extract the different ocean surface features like ships, oil slicks etc.
Key Words: SAR, power spectral density, Ocean, speckle, filtering.
1. INTRODUCTION
Remote sensing using Synthetic Aperture Radar (SAR) is one of the emerging areas for earth surveillance and geosciences studies. SAR is basically a radar imaging system mounted on a moving platform like satellite. It transmits periodic pulses of electromagnetic waves which strike the earth’s surface. Based on the reflectivity of various objects on the earth’s surface, the EM waves are transmitted back. These consecutive pulses collected over a period of time are coherently combined which gives a virtually larger aperture for the antenna. This enables SAR to capture very fine resolution images of a very large area of the earth’s surface at a time.
SAR is a preferred choice over conventional optical based remote sensing techniques. The prominence of SAR imaging over conventional optical imaging lies in the fact that it is unaffected by cloud cover and does not depend on any solar illumination. Hence it can provide a day and night surveillance of the entire earth surface on a periodic basis [1].
Processing of SAR images of the ocean surface is by far one of the most challenging areas in remote sensing. The continuous motion of the ocean and air-sea interference provides complexity in interpreting the SAR images. Given, the vast geographic extent of the ocean surface and the difficulty to directly access the deeper and dangerous areas of the ocean surface, the SAR satellite based surveillance proves to be the most effective tool for a global target detection mapping.
Several ocean phenomena like internal waves, surface waves and other man-made artifacts like ships and its subsequent wakes, illegal oil spills etc can be identified using fine resolution SAR images. Calm ocean surface appear very dark in SAR images where as rough ocean appear bright when the angle of incidence is small. Oil films appearing in the ocean surface due to oil spills smoothens the ocean surface. When the sea is normally rough these slicks appear as distinct dark patches. The shape and pattern of the oil slicks in the images can be analyzed to identify the direction of winds and the extent of spills.
The radar return from ships and vessels in the ocean surface is high and therefore appear as bright cluttered pixels in the SAR images. If the ships are moving at sufficient speed the subsequent wakes also appear as signatures in the SAR image. The extent and direction of the wakes can even be used to identify the direction [2].
The inherent ocean roughness often adds more noise to the ocean SAR images. The incident microwave radiations strike the various targets on the ocean surface and the backscattered radiations generated undergo a change in phase and power. These scatters are summed at the receiving end and undergo either constructive or destructive interference. This variance contributes to the bright random pixels in SAR images which often create false detections in processing algorithms. Hence conventional feature extraction techniques often fail to give good results for SAR images. Hence it is a requisite to develop special processing algorithms for SAR image interpretation.
There are several conventional filters that are used to minimize the speckle in SAR images. Some of them include the spatial domain filters like mean filter, median filter, frost filter etc [3]. Even though excessive use of such filters reduces the speckle, it also leads to loss of information from the images. Filtering techniques in the frequency domain is worth investigating because the distribution of the signal in the frequency spectrum gives insight into the magnitude of information and noise present.
© 2019, IRJET | Impact Factor value: 7.211 | ISO 9001:2008 Certified Journal
| Page 5229
2. TECHNIQUE
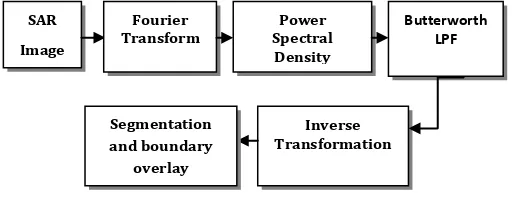
[image:2.595.34.290.231.331.2]The block representation of the proposed technique is shown in Figure 1. The SAR image is transformed into frequency domain using the Discrete Fourier Transform (DFT) and the Power Spectral Density (PSD) of the image is then computed. The PSD is filtered using a low pass filter. The filtered image is further segmented to identify various features present in the image.
Fig-1: Block Diagram
2.1 Power Spectral Density
The power spectral density (PSD) of an image is computed from the Discrete Fourier Transform (DFT) [4]. The Fourier transform is a fundamental transfrom used to represent any image to the frequency domain. It basically converts any signal into a combination of sinusoids, in which the frequency of each sinusoid is related to a particular frequency component present in the signal.
The two sided DFT is a symmetric frequency transform in which the negative and positive frequency components are taken into consideration. For the computation of PSD the two sided DFT is considered. This is preferred because the inverse transformation needs to be done to obtain the filtered image.
The two sided DFT is given by equation (1).
F(u,v) = F{f(x,y)} = (1)
The DFT is computed using an efficient algorithm called as the Fast Fourier Transform (FFT). The use of FFT aids in reducing the number of computations and fastens up the operations. The PSD of the signal is computed from FFT as
P(u,v) = (2)
Where N is the width of the frequency spectrum. The PSD
of the image is computed in a logarithmic scale and its unit is energy per frequency (i.e. the width).
A typical PSD plot tends to show that the majority of the power concentrates towards the origin. At higher spatial frequencies the magnitude of power is reduced by several magnitudes.
2.2 Filtering
The SAR image is transformed to the frequency domain in terms of the PSD function and this can be used to identify the noise. In any image, a uniform intensity region i.e. a region with no sudden change in terms of pixel intensity, appear as low frequency in the power spectral density. Any swift in intensities appears as high frequencies. Since the speckle is random bright and dark pixels appearing in the image, it can be considered as high frequencies in the power spectrum. Moreover the magnitude of the power contributed by the actual information in the image is much larger when compared to that contributed by speckle. Hence the filtering of the high frequency components from the power spectral density will ensure that the speckle is largely removed. This is done by using an appropriate low pass filter (LPF).
The choice of an appropriate LPF is significant in filtering process. An ideal LPF is described by the following equation.
H(u,v)= (3)
Here H represents the low pass filter mask. Do represent a positive cut off frequency and D(u,v) is the line of distance from (u,v) to the centre of the mask. If the image to be filtered is of the size M*N, then the center of the frequency rectangle is identified as (M/2, N/2). The distance D(u,v) is calculated as
D(u,v) =
(4)The frequency response of an ideal LPF is shown in Figure 2.
Fig- 2: An ideal LPF frequency response
The LPF mask generated is shown in Figure 3(a). A three dimensional view of the mask is shown in Figure 3(b).
A SAR image filtered using the ideal LPF is shown in figure 4. It can be observed that even though the noise present in the image is reduced, the filtered image is affected by ringing noise. Ringing produces special artifacts that appear at sharp pixel transitions in the image, e.g. edges and curves. They appear like bands or echoes on the edges of the images giving a faded repetitive look to the edges.
SAR Image
Fourier
Transform Spectral Power Density
Butterworth LPF
Inverse Transformation Segmentation
[image:2.595.363.507.513.611.2]© 2019, IRJET | Impact Factor value: 7.211 | ISO 9001:2008 Certified Journal
| Page 5230
[image:3.595.54.284.93.224.2]
(a) (b)
Fig- 3: (a) 2D view of the generated Filter Mask (b) 3D view of the generated filter mask
(a) (b)
Fig- 4: (a) SAR Image (b) Ideal LPF Filtered Image
The ideal LPF in the frequency domain can be considered as a rectangular signal whose frequency domain transformation is a sinc function. The ripples present in the magnitude of the sinc function introduce the ringing effect which is called as the Gibbs phenomenon. Hence in order to avoid the ringing effect in the filtered output the LowPass Butterworth filter is considered [5]. The general definition of a Butterworth LPF is given in equation (5).
H(u , v) = (5)
Where Do represent a positive cut off frequency, D(u,v) is the distance from a point (u,v) in the mask to the centre of the mask and n represents the order of the filter. The frequency response of the low pass Butterworth filter is shown in Figure 5.
Fig- 5: Frequency Response of a Butterworth LPF
The order ‘n’ of the filter decides the sharpness of the filter. This ensures that the filter preserve the frequencies of the transformed image within the limits of the radius Do and beyond the cut off frequency it introduces a gradual transition from 1 to 0 which removes the ringing effects. The generated Butterworth LPF mask is shown in figure 6(a). A 3D view of the generated filter mask is shown in figure 6(b).
Fig-6: (a) 2D view of the generated Filter Mask (b) 3D view of the generated filter mask
By appropriate choice of the cut off frequency of the low pass filter, the high frequency components in the PSD is suppressed. The filtered PSD of the image is now converted back by applying the inverse transformation. The noise suppressed SAR image is now given to the segmentation algorithm to extract the different features.
3. RESULTS AND DISCUSSION
3.1 Satellite Data
The satellite data used for the analysis is Sentinel-1A, multi-polarized C-band data. Sentinel 1A is one of the leading SAR data acquisition satellite developed by the European Space Agency. The satellite captures high resolution images of the earth’s surface at regular intervals. The satellite is capable of functioning in a wide variety of acquisition modes namely Strip map (SM) mode, Extra-wide swath (EW) mode, Interferometric Wide Swath (IW) and Wave Mode (WV). The different polarizations available are single (HH or VV) polarization and dual polarization (VV+VH or HH+HV). The Sentinel-1A satellite provides a continuous global coverage through a near-polar, sun-synchronous orbit and has a repetition cycle of 12 days. SAR satellites therefore provide access to the most remote areas of land and ocean surface.
3.2 Results
[image:3.595.307.558.205.299.2] [image:3.595.54.268.233.366.2] [image:3.595.79.229.612.725.2]© 2019, IRJET | Impact Factor value: 7.211 | ISO 9001:2008 Certified Journal
| Page 5231
majority of power is concentrated at the centre of thespectrum i.e. the lower frequencies. The spectrum is then filtered using a low pass Butterworth filter. The order of the filter mask generated is 2. The 2nd order Butterworth LPF
filter implemented is shown in figure 7(c). The PSD of the image is filtered using the LPF. The filtered PSD is shown in figure 7(d). Inverse transformation is applied on the filtered PSD to obtain the filtered SAR image. The filtered SAR image is shown in Figure 7(e).
(a) (b)
(c)
(d) (e)
Fig- 7: (a) SAR Image of the ocean surface (b) Power Spectral Density (c) Butterworth LPF Mask (d) Filtered
PSD (e) PSD Filtered SAR Image
The segmentation technique is carried out in two steps. The image is primarily threshold into a binary image. Binarizing the image is a primary step in most segmentation algorithms. However the SAR image might still contain random white and dark pixels which manifest itself in the binary image. Hence to remove such random pixels the binarization is followed by area thresholding technique. The thresholded image is further segmented to extract features.
In-order to test the efficiency of the filter the original SAR image and the filtered image was processed with the segmentation algorithm. Figure 8(a) shows the segmented output of the original SAR image and figure 8(b) shows the
boundary of the segmented output overlaid on the original image. The green boundary in the image represents the white regions identified by the segmentation algorithm. It can be seen that even though the algorithm was able to identify the two white objects the presence of excessive speckle has also caused some false detections in the SAR image.
Figure 9(a) shows the segmented output of the PSD filtered SAR image and Figure 9(b) shows the boundary of the segmented output overlaid on the PSD filtered SAR image. It can be seen that the algorithm was able to correctly identify the two objects of interest from the image without any false detections.
[image:4.595.37.285.212.567.2]
(a) (b) Fig- 8: (a) Segmented Output of the Original SAR image (b) Boundary of the segmented output overlaid on
the PSD filtered image
(a) (b)
Fig- 9: (a) Segmented Output of the PSD Filtered image (b) Boundary of the segmented output overlaid on
the PSD filtered image
[image:4.595.308.561.276.400.2] [image:4.595.308.556.432.570.2]© 2019, IRJET | Impact Factor value: 7.211 | ISO 9001:2008 Certified Journal
| Page 5232
(a) (b)
(c)
(d) (e)
Fig-10: (a) SAR Image of the ocean surface (b) Power Spectral Density (c) Butterworth LPF Mask (d) Filtered SD
(e) PSD Filtered SAR Image
Figure 11(a) shows the segmented output of the original SAR image and figure 11(b) shows the boundary of the segmented output overlaid on the original image. The green boundary in the image represents the regions identified by the segmentation algorithm. There are a lot of false detections present due to the speckle.
(a) (b)
Fig- 11: (a) Segmented Output of the Original SAR image (b) Boundary of the segmented output overlaid on
the image
Figure 12(a) shows the segmented output of the PSD filtered SAR image and Figure12 (b) shows the boundary of the segmented output overlaid on the PSD filtered SAR image. It can be seen that the algorithm was able to identify the dark oil slick from the SAR image without any false detections.
[image:5.595.40.278.91.475.2]
(a) (b)
Fig- 12: (a) Segmented Output of the PSD Filtered image (b) Boundary of the segmented output overlaid on
the PSD filtered image
3. CONCLUSION
The quality of SAR satellite images is largely affected by the speckle noise that is present. This makes feature extraction from these images a difficult task. A unique PSD based speckle reduction and feature extraction technique has been proposed. The proposed technique was used to extract different features like ships, slicks etc. from SAR images of the ocean surface.
ACKNOWLEDGEMENT
The authors are thankful to Dr P.V. Hareesh Kumar, Scientist and Project Director, Naval Physical and Oceanographic Laboratory (NPOL-DRDO) for his guidance and suggestions.
REFERENCES
[1] A. Moreira, P. Prats-Iraola, M. Younis,G. Krieger,
I.Hajnsekand K.Papathanassiou “A Tutorial On Synthetic
Aperture Radar,” IEEE Geoscience and Remote Sensing Magazine, Vol. 1, pp. 6-43,10.1109/mgrs.2013.2248301, 2013.
[2] Y. X. Sun, P. Liu, and Y.Q. Jin, Life Fellow, IEEE “Ship
Wake Components: Isolation, Reconstruction, and Characteristics Analysis in Spectral, Spatial, and TerraSAR-X Image Domains” IEEE Transactions on Geoscience and Remote Sensing, Vol. 56(7), 2018.
[3] M. Mansourpour, M. A. Rajabi, J. A. R. Blais, “Effects and
performance of speckle noise reduction filters on active radar and SAR images”, Proceedings of the ISPRS Ankara Workshop 2006, Ankara, Turkey, February 2006.
[4] S. Sarkar and G. Healey “Hyperspectral Texture
[image:5.595.327.544.170.319.2]© 2019, IRJET | Impact Factor value: 7.211 | ISO 9001:2008 Certified Journal
| Page 5233
[5] R. C. Gonzalez, R. E. Woods, “Digital Image Processing”,