warwick.ac.uk/lib-publications
Manuscript version: Author’s Accepted Manuscript
The version presented in WRAP is the author’s accepted manuscript and may differ from the
published version or Version of Record.
Persistent WRAP URL:
http://wrap.warwick.ac.uk/92081
How to cite:
Please refer to published version for the most recent bibliographic citation information.
If a published version is known of, the repository item page linked to above, will contain
details on accessing it.
Copyright and reuse:
The Warwick Research Archive Portal (WRAP) makes this work by researchers of the
University of Warwick available open access under the following conditions.
Copyright © and all moral rights to the version of the paper presented here belong to the
individual author(s) and/or other copyright owners. To the extent reasonable and
practicable the material made available in WRAP has been checked for eligibility before
being made available.
Copies of full items can be used for personal research or study, educational, or not-for-profit
purposes without prior permission or charge. Provided that the authors, title and full
bibliographic details are credited, a hyperlink and/or URL is given for the original metadata
page and the content is not changed in any way.
Publisher’s statement:
Please refer to the repository item page, publisher’s statement section, for further
information.
Enabling Dependability-Driven Resource Use and Message Log-Analysis for Cluster
System Diagnosis
Edward Chuah
k∗, Arshad Jhumka
∗, Samantha Alt
††, Theo Damoulas
k∗, Nentawe Gurumdimma
∗∗,
Marie-Christine Sawley
††, William L. Barth
¶, Tommy Minyard
¶, James C. Browne
‡kThe Alan Turing Institute, 96 Euston Road, London NW1 2DB, UK. Email: {echuah, tdamoulas}@turing.ac.uk ∗University of Warwick, Coventry CV4 7AL, UK. Email:{E.Chuah, H.A.Jhumka, T.Damoulas}@warwick.ac.uk
††Intel Corporation, USA and France. Email:{samantha.alt, marie-christine.sawley}@intel.com ∗∗University of Jos P.M.B 2084 Jos, Plateau State Nigeria, Post code: 930001. Email: [email protected]
¶Texas Advanced Computing Center, Texas 78758. Email:{bbarth, minyard}@tacc.utexas.edu ‡University of Texas at Austin, Texas 78712. Email: [email protected]
Abstract—Recent work have used both failure logs and re-source use data separately (and together) to detect system failure-inducing errors and to diagnose system failures. System failure occurs as a result of error propagation and the (unsuccessful) execution of error recovery mechanisms. Knowledge of error propagation patterns and unsuccessful error recovery is im-portant for more accurate and detailed failure diagnosis, and knowledge of recovery protocols deployment is important for im-proving system reliability. This paper presents the CORRMEXT framework which carries failure diagnosis another significant step forward by analyzing and reporting error propagation patterns and degrees of success and failure of error recovery protocols. CORRMEXT uses both error messages and resource use data in its analyses. Application of CORRMEXT to data from the Ranger supercomputer have produced new insights. CORRMEXT has: (i) identified correlations between resource use counters that capture recovery attempts after an error, (ii) identified correlations between error events to capture error propagation patterns within the system, (iii) identified error propagation and recovery paths during system execution to explain system behaviour, (iv) showed that the earliest times of change in system behaviour can only be identified by analyzing both the correlated resource use counters and correlated errors. CORRMEXT will be installed on the HPC clusters at the Texas Advanced Computing Center in Autumn 2017.
Index Terms—Large cluster system; Correlation; Variance extraction; Error Recovery and propagation; Cluster log data
I. INTRODUCTION
There has been much fruitful research on failure-inducing error detection and the analysis and diagnosis of system fail-ures. This research is summarized briefly below and analyzed in Section V. HPC and data center operators face challenges on a day by day basis. Recent work that studied HPC and data center failures [1], [2] have shown that the mean time between failures is decreasing and it is important for the system administrators to identify errors quickly. However, these high-performance systems generate a massive amount of data. The different types of data are not necessarily structured. Therefore, finding the right types of data and rapidly analyzing the data to diagnosis system problems is a challenging task while at the same time important for improving the HPC system performance and uptime. A significant body of research has shown the value of message logs for error detection [3]–
[5], failure prediction [6]–[12] and failure diagnosis [13]–[15]. Another significant body of research has shown the value of resource use data to detect anomalies and characterize errors [16]–[18], predict failures [19] and recovery [20]. The use of resource use data and message logs separately has provided important methods and tools that help manage these systems. Recent work which use resource use dataand message logs for failure diagnosis [21], [22] and error detection [23], [24] has shown increased accuracy over using message logs alone. [21] provides partial diagnosis of system failures by using resource use data to identify resource anomalies, and provides a more precise diagnosis by using message log-analysis. [24] combines analyses of message logs and resource use data but the focus is on error detection. [23] uses message logs and resource use data to increase the error handling time window, and [22] is focused on correlating resource usage and message logs with system failures. [25] combines analysis of RAS logs and job logs but the focus is on identifying failure characteristics in a cluster system. Previous work [21], [22], [26] have correlated errors only with failures, but there is little work which focuses on other dependability-related issues such as error propagation and error recovery. The knowledge of error propagation paths can be useful to system designers and implementators for improving the effectiveness of error recovery protocols.
inodes (rather than communication errors).
This paper introduces the CORRMEXT framework to identify possible error propagation paths and provide more dependability-oriented system diagnosis. CORRMEXT uses the TACC Stats [27] resource monitoring system and Ra-tionalized message logging [28] to resolve resource use and system messages by job, node and time for open-source Linux clusters. CORRMEXT identifies and links groups of resource use and events patterns on a given date. It applies multiple correlation algorithms. CORRMEXT implements a three-phase approach where: (i) correlations are performed on the resource use counters, (ii) correlations are performed on the message logs, (iii) variance extraction is performed on time-bins associated with the correlated resource use counter groups and correlated error groups.
The benefit of combining analysis of resource use and message logs is given in the following example: When cor-relations of process and NUMA1 resource use counters, and correlations of memory errors occur on the same date, it shows that memory allocation activities are associated with the generation of memory errors. Therefore, the correlated NUMA and process counters can be used to monitor the state of memory allocation and the correlated memory errors can be used to identify the application which caused the error. In this paper, we will show that CORRMEXT provides a pathway to the root-cause of successful and failed error recovery mechanisms which alternative diagnostics tools can not provide.
The main contributions of this paper include:
• A new framework (CORRMEXT) that combines resource use data and message logs for detailed dependability-oriented system diagnosis.
• A demonstration that CORRMEXT can: (i) identify error propagation paths leading to failure, (ii) explain instances of error recovery, (iii) explain the causes of failed error recovery mechanisms.
• CORRMEXT shows that more correlated errors
associ-ated with error propagation and recovery can only be identified by applying different correlation algorithms.
• CORRMEXT includes a detailed statistical analysis step to ensure accurate dependability diagnosis. In our case studies, we show that all the correlations are statistically significant by applying the Bonferroni correction.
• CORRMEXT shows that the earliest times of change in system behaviour can only be identified by analyzingboth the correlated resource use counters and correlated errors on all dates.
The remainder of this paper is structured as follows: We define the system and fault models in Section II, present the problem description and framework in Section III, evaluate CORRMEXT in Section IV, review the related work in Section V, conclude with a summary and future work in Section VII.
1Non-Uniform Memory Access (NUMA)
II. SYSTEM ANDFAULTMODELS
The class of systems to which CORRMEXT can be applied is specified in terms of a generic model of cluster systems given in [21] and we summarize here: A cluster system consists of a set of nodes and jobs and a scheduler that assigns jobs to nodes. Each component of a node or a job can output messages which are recorded in a message log-file. In addition, system resources used by the various jobs are recorded at regular intervals. The resource usage is recorded in a resource use log-file.
Fault Model: System failure2 occurs when the system output deviates from the expected one. To increase the de-pendability of such systems, it is important to tolerate those errors that occur shortly before a system failure. Knowing the nature of these errors will ease error detection or failure diagnosis, thus helping with debugging or maintenance. We assume faults can occur at any level in the system, at the lowest level, e.g., register level to the highest level such as file systems. Execution of these faults will lead to errors which, if not handled, may lead to system failure.
III. SYSTEMISSUES, PROBLEMSPECIFICATION AND
FRAMEWORK
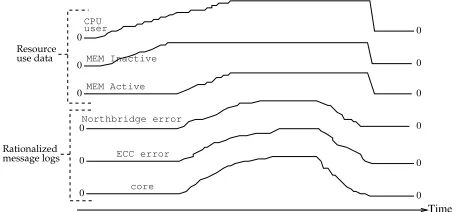
An illustration of resource use and error messages by time is shown in Fig. 1. In the resource use data, we ob-served that user processor utilization (CPU user) and memory pages not accessed recently (MEM Inactive) are correlated. We also observed that user processor utilization (CPU user) and memory pages accessed recently (MEM Active) are correlated. In the rationalized message logs, we observed that chipset error (Northbridge Error), memory error (ECC error) and processor core (core) messages are correlated.
message logs Rationalized Resource use data
Time
0 0
0 0
0 0
ECC error
core Northbridge error
0 0
user CPU
0 0
0 0
MEM Inactive
[image:3.612.323.551.457.563.2]MEM Active
Fig. 1. An illustration of user processor utilization, memory pages not accessed recently, memory pages accessed recently, chipset, memory error and processor core messages.
Capturing these correlations is important as these can pro-vide insights into the behaviour of the system. For example, a resource counter r1 may capture the existence of an error in the system while another counterr2may capture the execution of some recovery procedure. A correlation betweenr1 andr2 shows that a recovery procedure was triggered following an error. Similarly, a correlation between different event groups
will provide insights into the system state. However, under-standing the occurrence of groups of errors from message logs alone is challenging. The framework we present in this paper seeks to determine the occurrence of these patterns to enable study of various dependability-oriented processes such as error recovery and error propagation .
A. Problem Specification
The problem that we address in this paper is given as follows: Given (i) a set of resource use data, (ii) a set of message logs, (iii) a list of resource use counter names, (iv) a list of messsage types, and (v) a date, then:
1) Identify groups of resource use counters that are linearly or monotonically correlated on the specified date, 2) Identify groups of errors that are linearly or
monotoni-cally correlated on the specified date,
3) Identify the time-bin(s) that are associated with the correlated resource use counter groups and correlated error groups on the date specified.
The date specified captures the date where deeper insights are sought. To achieve this, we develop the CORRMEXT (CORrelating Resource use data and Message logs and
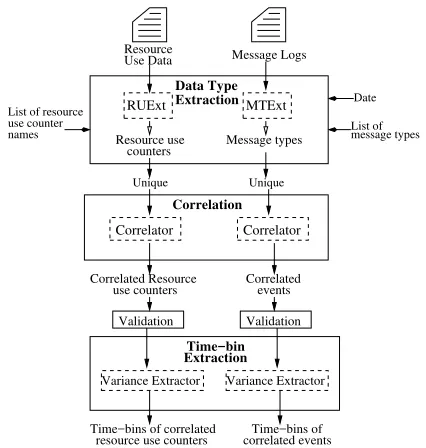
EXtracting Time-bins) framework as shown in Fig. 2. Next, we describe in detail, each of the three modules used within the CORRMEXT framework.
Message Logs
Data Type Extraction
Correlated Resource
use counters Correlatedevents
Validation Validation
Time−bins of correlated
resource use counters correlated eventsTime−bins of List of message types use counter
names
List of resource RUExt MTExt Resource
Use Data
Resource use
counters Message types
Unique Unique
Correlation
Correlator Correlator
Time−bin Extraction
[image:4.612.66.279.367.591.2]Variance Extractor Variance Extractor Date
Fig. 2. The workflow of the CORRMEXT framework. The CORRMEXT framework is composed of three modules: (1) Data Type Extraction, (2) Correlation, (3) Time-bin Extraction. The workflow automatically process the resource use and message logs through the Data Type Extraction, Correlation and Time-bin Extraction modules. The output of each module are sets of reports which can be used for diagnosis.
B. Data Type Extraction
CORRMEXT targets processing of TACC Stats resource use data [27], Syslogs [29] and Rationalized message logs
[28]. TACC Stats [27] is a job-oriented and logically struc-tured version of the conventional Sysstat system performance monitor. The Rationalized message log [28] is a special type of message log that incorporates a logical structure and additional content such as job-identification to the POSIX formatted logs. The resource use data and message logs contain hundreds of different resource use counters and thousands of message types. In addition, the messages in the message logs may be ambiguous and unstructured. We developed a Data Type Extractormodule that extracts: (i) resource use counters from the resource use data, and (ii) message types from the standard Syslogs and Rationalized message logs.
Resource Use Extractor (RUExt): We implemented the Resource Use Extractor to organize the resource use counters. RUExt extracts resource use counters from a major new version of TACC Stats and presents the resource use counters in the form of a matrix of counts on which standard analysis algorithms can be applied. In addition to hardware perfor-mance monitoring data, Lustre file-system operation counts and InfiniBand device usage collected by an earlier version, the new TACC Stats collects a comprehensive range of metrics that spans all system resources including energy consumption, vectorization, I/O and network activity. An example of a resource use log is shown below:
2066522 Aug 11 12:50:01 i150-412 mem 2 MemTotal 8273920 MemFree 5466616 MemUsed 2807304 ...
The sources of this resource use log can be identified from the job (2066522) and node (i150-412). The time that this resource use log was recorded can be identified from the timestamp (Aug 11 12:50:01). The main component associ-ated with this resource use log can be identified from the word (mem) that follows immediately after the node identifier; in this example, the main component is the onboard memory system of the nodei150-412. A second-level component can be identified from the word (2) that follows immediately after the first component identifier; in this example, the second-level component is memory bank number 2. The resource use counters can be identified from the key-value pairs (e.g. MemFree 5466616) that follow after the second component identifier. We define a parameter name, param-name, as a triple which comprises of the main component, second-level component and resource use counter key; in this example, the param-name is “mem 2 MemFree”. A list of resource use counters and their components is given in Table I.
Currently,RUExt generates a data matrixDRtimebins
con-taining counts of resource use counters by time-bins. In the matrix, each row represents a param-name, each column represents a time-bin of one hour tbj and each cell contains
the count of param-name within time-bintbj. The data matrix
is generated using a process which is given as follows:
• Step 1: Split the resource usage logs into individual hours by the given date.
TABLE I
SYSTEM METRICS GROUPS AND RESOURCE USE COUNTERS.
Metric Qty. Resource use counters group
Lustre 6 tx msgs, rx msgs, rx msgs dropped, tx bytes, network rx bytes, rx bytes dropped
Lustre read bytes, write bytes, direct read, direct write, /work, 23 dirty pages hits, dirty pages misses, ioctl, open, /share, 23 close, mmap, seek, fsync, setattr, truncate, flock, /scratch 23 getattr, statfs, alloc node, setxattr, getxattr,
listxattr, removexattr, inode permission
Virtual 21 pgpgin, pgpgout, pswpin, pswpout, pgalloc normal memory pgfree, pgactivate, pgdeactivate, pgfault, pgmajfault
pgrefill normal, pgsteal normal, pgscan kswapd normal, pgscan direct normal, pginodesteal, slabs scanned, kswapd steal, kswapd inodesteal, pageoutrun, allocstall, pgrotated
Block 11 rd ios, rd merges, rd sectors, rd ticks, wr ios, md0, 11 wr merges, wr sectors, wr ticks, in flight, io ticks,
hdd time in queue
Cpu 112 user, nice, system, idle, iowait, irq, softirq 0 to 15
Mem 80 MemTotal, MemFree, MemUsed, Active, Inactive, 0 to 3 HighTotal, HighFree, LowTotal, LowFree, Dirty,
Writeback, FilePages, Mapped, AnonPages, PageTables, NFS Unstable, Bounce, Slab, HugePages Total, HugePages Free
Net ib0, 23 collisions, multicast, rx bytes, rx compressed, rx crc lo, 23 errors, rx dropped, rx errors, rx fifo errors, rx eth0, 23 frame errors, rx length errors, rx missed errors,
rx over errors, rx packets, tx aborted errors, tx bytes, tx carrier errors, tx compressed, tx dropped, tx errors, tx fifo errors, tx heartbeat errors, tx packets, tx window errors
Numa 24 numa hit, numa miss, numa foreign, interleave hit, 0 to 3 local node, other node
Ps 7 ctxt, processes, load 1, load 5, load 15, nr running, nr threads
• Step 3: Identify the unique param-namesin the list and obtain the param-name types.
• Step 4: For each param-name type in a resource use log which match the given list of resource use counter names, if the values associated with the param-name types of two consecutive log entries are different, obtain the difference and add the difference to the value obtained in the preceding operation and store the value.
Message Types Extractor (MTExt): We implemented the Message Types Extractor to extract structured message tem-plates from large quantities of message logs. MTExt extracts sequences of messages from the message logs and presents these messages in the form of a matrix of counts on which standard analysis algorithms can be applied. An example of a message log is shown below:
2055415 Aug 3 00:00:03 i120-306 kernel X Northbridge Error, node %d ...
The date and time that this message log was recorded can be identified from the timestamp (Aug 3 00:00:03). The sources that generated this message log can be identified from the job (2055415) and node (i120-306). The messageconstantpart in this message log can be identified from a sequence of English-only words (X Northbridge Error, node). The message type
can be identified from the message constant; in this message log, the message type is a Northbridge error.
Currently, MTExt generates a data matrix DMtimebins
containing counts of message types by time-bins. In the matrix, each row represents a message typemti, each column
represents a time-bin of one hour tbj and each cell contains
the count of a message typemti within time-bintbj. The data
matrix is generated using a process which is given as follows:
• Step 1: Split the message logs into logs of individual
hours by the given date.
• Step 2: For each message log, extract the message
con-stant part and store it in a list.
• Step 3: Identify the unique messageconstants in the list and obtain the message types.
• Step 4: Given a list of message types, count the number of message types by hour for the given date in the logs.
C. Correlation
Once the Data Type Extractor module has generated the time-bin data matrices, the Correlationmodule computes: (i) the correlation coefficients between the resource use counters contained in the time-bin (DRtimebins) data matrix and
ex-tracts a smaller set of resource use counters for analysis, and (ii) the correlation coefficients between the events contained in the time-bin (DMtimebins) data matrix and extracts a smaller
set of message logs for analysis. We implemented Pearson correlation as the base algorithm to identify linear patterns and Spearman-Rank correlation to identify patterns that increase monotonically.
Pearson correlation [30] draws a line of best fit through the data of two variables and it assumes a linear relationship between the data of two variables. The Pearson correlation coefficient, r is defined as the mean of the products of the standard scores, i.e., r = 1
n−1
Pn
i=1
x
i−x¯
sx
yi−y¯
sy
where
xi−¯x
sx
is the standard score of x, yi−s y¯
y
is the standard score of y, x and y are two datasets containing n values of a pair of resource use counters or a pair of events,
sx= q
1
n−1
Pn
i=1(xi−x)¯ 2 is the sample standard deviation of x, sy =
q
1
n−1
Pn
i=1(yi−y)¯ 2 is the sample standard
deviation ofy,x¯ andy¯is the sample mean ofxandy. Spearman-Rank correlation [30] assumes a monotonic rela-tionship that does one of the following: (i) when the value of one variable increases, the value of the other variable increases, (ii) the value of one variable remains, the value of the other variable remains. The Spearman-Rank correlation coefficient, ρis defined as the Pearson correlation coefficient between a pair of ranked variables. To rank the variables, we implemented a standard technique called the tied rank average method [30]. The process is given as follows:
• Rank order the values in the datasetxwith the smallest value getting a rank of 1.
• Rank order the values in the dataset y with the smallest
value getting a rank of 1.
• If more than one value has the same rank in the dataset
y, assign the average rank to these values.
Our objective is to identify patterns in the resource use data and message logs which are strongly positive correlated. The correlation algorithms require that a pair of datasets contain the same number of data points on the x-axis. The resource use data and message logs are generated by different open source software tools and the log entries in the resource use data and message logs may contain different timestamps. As a result, the dataset for a resource use counter and a message type may contain different numbers of data points. It is for this reason that we do not apply our Correlation module directly on a pair of resource use counter and message type dataset. Having said that, our objective is to identify correlations of resource use counters and correlations of events. Hence, we apply our Correlation module separately on the resource use data and message logs as shown in Fig. 2.
Once the correlation matrices have been generated, we apply a process given in [21] to generate the lists of strongly cor-related resource use counters and strongly corcor-related events. The process automatically identifies a correlation threshold
rth and uses rth to extract the strongly correlated resource
use counters, strongly correlated events and their correlation coefficients. We use the following rules to interpret the strength of the correlation coefficient: (a) 0.9 to 1: Very strong positive correlation, (b) 0.7 to 0.9: Strong positive correlation, (c) 0.5 to 0.7: Moderate positive correlation, (d) 0.3 to 0.5: Weak positive correlation, (e) 0.1 to 0.3: Very weak positive correlation.
Validation: To test the significance of the correlation co-efficient, we apply a standard technique called Fisher’s z-transform [30] F(r) = 12ln1+1−rr on the correlation co-efficient to obtain a z-score. We define the null hypothe-ses as: (i) H0r that a pair of resource use counters are
very weakly positive correlated, and (ii) H0e that a pair of
events are very weakly positive correlated. We define the alternate hypotheses as: (i) Har that a pair of resource use
counters are strongly positive correlated, and (ii) Hae that
a pair of events are strongly positive correlated. Under the null hypothesis H0r, F(r) approximately follow a normal
distribution with mean uz =F(H0r) = 0 and standard error
SE = √ 1
nr−3, where nr is the number of time-bins in the pair of resource use counters. Under the null hypothesis H0e,
F(r)approximately follows a normal distribution with mean
uz =F(H0e) = 0 and standard error SE = √n1e−3, where
ne is the number of time-bins in the pair of message types.
Then, we obtain the z-score for all correlation coefficients, i.e., zr = F(rSE)−uz = (F(r)−F(H0r))×
√
nr−3 and
ze = F(rSE)−uz = (F(r)−F(H0e))×
√
ne−3 where zr is
the z-score for a pair of correlated resource use counters and
ze is the z-score for a pair of correlated events.
A large absolute value of z, e.g., 2.64 at 99% confidence level, will reject the null hypotheses in favour of the
alter-nate hypotheses that a pair of resource use counters and a pair of events are correlated. We are interested in strongly positivecorrelated resource use counters andstrongly positive correlated events. To test the probability of rejecting the null hypothesis when it is true, we apply a one-sided test and use the significance level, α = 0.01 to obtain a P-value for all hypothesis tests. Since this is a one-sided test, the
P-value is equal to the probability of observing a value greater than zr or ze in the standard normal distribution, or
P(Z > zr) = 1−P(Z≤zr)orP(Z > ze) = 1−P(Z ≤ze).
A P-value less than 0.01 indicates that it is highly unlikely the result would be observed under the null hypothesis.
Implementation of significance testing: We implemented a process to test the significance of all the correlation coeffi-cients. The process is given as follows: The number of hours for each date of logs is generated by RUExt andMTExt and the number of dates processed is generated by the Data Type Extractor (DTE). The total number of hours in each date of logs is given to the validation sub-component by RUExt and MTExt and the correlation coefficients are given to the validation sub-component by the Correlation module shown in Fig. 2. The correlation coefficients and number of hours are then used to compute Fishers z-scores for all correlation coefficients. Then, the unadjusted P-values are obtained by mapping the z-scores to P-values using a Z-table which is implemented in the validation sub-component. The adjusted
P-value is then obtained by multiplying the unadjusted P -value by the total number of dates.
Bonferroni Correction: Given d number of hypotheses, the probability of observing at least one significant result just due to chance is1−(1−P)dwherePis the p-value obtained from
each test. If there is only one hypothesis to test and theP-value obtained is 0.01, then there is a 1% probability that it is a false positive. When there is more than one hypothesis to test, for example 26 hypotheses and aP-value of 0.01 is obtained for each test, the probability that there is at least one false positive is1−(1−0.01)26= 1−0.9926= 0.22or 22%. To account for inflation in false positive due to multiple independent tests, we apply a standard technique called Bonferroni correction to counteract the problem of multiple comparisons [31]. We use the Bonferroni correction on the unadjustedP-value obtained for each test to obtain an adjusted P-value. Given d testsTi
for hypotheses Hi(1 ≤ i ≤ d) under the null hypothesis
assumption H0 that all alternate hypotheses Hi are false,
and if the individual test critical values are ≤α/d, then the experiment-wide critical value is≤α. We obtain the adjusted
P-value for all hypothesis tests by multiplying the unadjusted
P-value byd.
D. Time-bin Extraction
represents a resource use counter and each column represents a time-bin of one-hour. In the correlated events dataset, each row represents a message type and each column represents a time-bin of one-hour. Our Time-time-bin Extraction module currently computes the variance of both the correlated resource use counters dataset and correlated events dataset at every hour. The variance is s2= n−11Pn
i=1(xi−x)¯ 2 wheren=sample
size of x,x¯=sample mean ofx.
Our objective is to identify times of change in the system behaviour during the day. To identify the earliest times in the correlated resource use counters and correlated events datasets, we implemented a process to extract the variance associated with the time-bins. The process is given as follows:
1) Store the variance for each time-bin in a list lvar.
2) Obtain the difference in the variance between two con-secutive time-bins and store the difference in a list
lvardif f.
3) Sort lvardif f in descending order with the first element
the largest difference in variance.
IV. CASESTUDY: RANGERSUPERCOMPUTER
Our study of error recovery and propagation is carried out within the context of the decommissioned Ranger cluster at the Texas Advanced Computing Center at the University of Texas at Austin. We collected the resource use data3and rationalized
message logs for June, July and August 2011, and a summary is given in Table II.
TABLE II
SUMMARY OF LOG-DATA COLLECTED ONRANGER.
Resource use data Rationalized message logs
Month Size Qty. lines Size Qty. messages June 2011 120.9 GB 603,024,456 2.7 GB 10,021,516 July 2011 124.1 GB 637,860,203 9.6 GB 64,822,682 August 2011 125.4 GB 633,396,685 14.5 GB 114,745,476
[28] reported that the lead time on occurrence of an error to a soft lockup failure is six hours. There are 26 dates in the rationalized message logs when soft lockups were reported. The dates of log-data analyzed are given in Table III.
TABLE III
LIST OF DATES OF LOG-DATA ANALYZED ONRANGER.
Month Dates
June 2011 3, 5, 14, 15, 16, 21, 22 July 2011 5, 6, 7, 11, 18, 19, 23, 24, 25, 26, 27, 31 August 2011 3, 4, 11, 22, 24, 30, 31
We obtain the list of correlated resource use counters and list of correlated events, discussed the lists of resource use counters and events with the systems administrators and identified three dependability use cases, and summarized them in Table IV.
In this section, we give the details for the first use case on recovery attempt and its impact on application and process
3The resource use on the Ranger cluster was sampled at 10-minute intervals.
TABLE IV
SUMMARY OF DEPENDABILITY USE CASES ONRANGER.
Issue System Error No. of dates
Recovery Application & process Memory allocation 25 attempt memory allocation & memory leaks
Error pro- Lustre file-system I/O & Communication & 24 pagation Infiniband file-system I/O errors Recovery Chipset & system Chipset & memory 26
attempt memory errors
memory allocation. The details for the second and third use cases are provided in a companion report4.
A. Capturing Recovery Attempt and its Impact
In this section, we explain how correlations between NUMA (Non-Uniform Memory Access) and process resource use counters and between application memory leaks can be used to first infer error recovery, and then assess the impact of the recovery mechanism on the system reliability.
1) Phase 1: Correlated NUMA & Processes counters: The numa and processes resource use counters can be used to see what happens when a node runs out of free memory pages. If a process makes a request for memory pages on its local node but the node is out of memory (an error), then the numa misscounter on that node is incremented. Another node is assigned to accommodate the process request for memory pages and the numa foreign counter on the node is incremented (error recovery). The ps processes counter records the number of processes created, and the ps ctxt counter records the total amount of context switches across all CPUs. From Fig. 3, we observed that numa miss is strongly correlated to ps processes with scores that range between 0.93 to 1 on 25 dates, and numa missis strongly correlated to ps ctxt with scores that range between 0.93 to 1 on 23 dates. From Fig. 4, we observed thatnuma foreignis strongly correlated to ps processes with scores that range between 0.93 to 1 on 21 dates, andnuma foreignis strongly correlated to ps ctxt with scores that range between 0.93 to 1 on 21 dates. We observed that only Pearson correlation identified the correlated NUMA & processes counters on two dates. However, we observed that only Spearman-Rank correlation identified the correlated NUMA miss & processes counters on 17 dates and the correlated NUMA foreign & processes counters on 16 dates. If Pearson correlation is used as the only correlation method, the correlated NUMA & processes counters on these 16 dates would not be identified. However, if Spearman-Rank correlation is used as the only correlation method, the correlated NUMA & processes counters on the two dates would not be identified. Our results show that:
• Pearson correlation and Spearman-Rank correlation are
suitable methods. Pearson correlation identified memory and process resource allocations that follow a linear pat-tern and Spearman-Rank correlation identified memory
4Case Study of Error Recovery and Error Propagation on Ranger, available
and process resource allocations that follow a monotoni-cally increasing function.
• When a process requests memory on out-of-memory nodes, the system attempts to recover by allocating mem-ory on another node to the process. Further, when the system allocates memory on another node to a process, context switching occurs across all the CPUs.
(a) June 2011.
(b) July 2011.
[image:8.612.316.553.47.484.2](c) August 2011.
Fig. 3. Correlations between “numa miss”, “ps processes” and “ps ctxt” coun-ters. The full-circled counters were identified by Spearman-Rank correlation only. The dot-circled counters were identified by Pearson correlation only.
2) Phase 2: Correlated Segmentation Faults & General Protection Errors: Segmentation faults can be identified from the segfault event. Access violations can be identified from thegeneral protection errorevent. Segmentation faults are often caused by programs that tried to read or write a protected memory location. When a program tries to access a protected memory location, it can trigger the processor to issue a general protection fault (GPF) interrupt. In most cases, the operating
(a) June 2011.
(b) July 2011.
(c) August 2011.
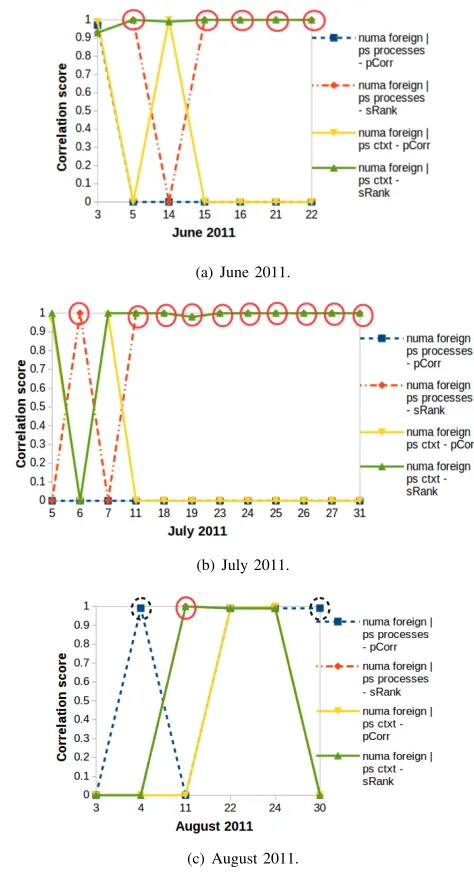
Fig. 4. Correlations between “numa foreign”, “ps processes” and “ps ctxt” counters. Full-circled counters were identified by Spearman-Rank correlation only, dot-circled counters were identified by Pearson correlation only.
system will remove the program, signal the user and continue executing other programs. However, if the operating system fails to catch the GPF, the processor will issue a second GPF. If the operating system fails to catch the second GPF, the processor stops working and will only respond to a reset.
From Fig. 5, we observed thatsegfaultevents are strongly correlated to general protection error events with scores that range between 0.98 and 1 on 10 dates. The dates coincide with all the dates when NUMA miss and NUMA foreign counters are correlated. We observed that only Pearson corre-lation identified the correlated segmentation faults and general protection errors on June 21 and August 22.
[image:8.612.57.290.142.579.2](a) June 2011.
(b) July 2011.
[image:9.612.315.561.373.443.2](c) August 2011.
Fig. 5. Correlations of “segfault” and “general protection error” events. The dot-circled events were identified by Pearson correlation only.
The programs are: enzo.exe, preplot, charmm, fft_x, siesta_test, lx, phParAdapt,openGR, vasp_acmland mpmc. enzo.exeis an executable of a cosmology simulation.preplot is a program that reformats the output of analysis programs so that they may be plotted by Gnuplot. charmm is a molec-ular simulation program. fft_x is a fast fourier transform algorithm. siesta_test is a JavaScript unit testing tool. phParAdapt is a parallel adaptive mesh method for the nu-merical simulation of multiphase flows.openGRis a framework that supports large numerical simulations in general relativity. vasp_acmlis a Vienna Ab initio simulation package and AMD core maths library. mpmcis a Massively Parallel Monte Carlo method package.
Correlations with failures: Next, we manually scanned the list of correlated events to determine the correlation
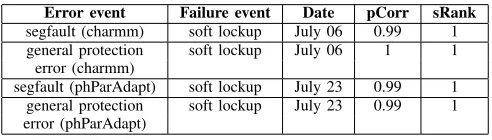
strength between segfault and soft lockup events, and general protection errorandsoft lockupevents. A sum-mary of the strongly correlated events is given in Ta-ble V. From TaTa-ble V, we observed that the segmentation faults and general protection errors are associated with the programs charmm and phParAdapt, and the segfault and general protection error events are strongly correlated to soft lockup events on July 06 and 23. Our results suggest that access to protected memory location by the programs charmm andphParAdapthas led to memory location access violations and these access violations have led to soft lockups on July 06 and 23. Further, we found that the correlated segmentation faults and general protection errors are weakly correlated to soft lockups on eight dates.
Detailed diagnosis:When the system was attempting a recov-ery caused by a NUMA miss, several applications attempted writes to protected memory locations which caused segmenta-tion faults. On eight of ten dates the operating system removed the faulty application. This represents a recovery rate of 80%. However, the operating system did not catch the general protection faults that were triggered by two applications on two of ten dates which led to failure. This represents a failure rate of 20%.
TABLE V
SUMMARY OF CORRELATED“SEGFAULT”AND SOFT LOCKUP,AND CORRELATED“GENERAL PROTECTION ERROR”AND SOFT LOCKUP.
Error event Failure event Date pCorr sRank
segfault (charmm) soft lockup July 06 0.99 1 general protection soft lockup July 06 1 1
error (charmm)
segfault (phParAdapt) soft lockup July 23 0.99 1 general protection soft lockup July 23 0.99 1 error (phParAdapt)
3) Phase 3: Earliest times of change: From Fig. 6, we observed that the earliest times of change in the correlated NUMA & process counters and correlated segmentation faults & general protection errors on each date are different. The times of change: (i) occurred first in the correlated NUMA & process counters on six dates, (ii) occurred first in the correlated segmentation faults & general protection errors on three dates, and (iii) occurred in both the correlated counters and correlated errors at the same time on one date. If the correlated errors were used as the only source, the earliest times of change on six dates would not be identified. Having said that, if the correlated resource use counters were used as the only source, the earliest times of change on three dates would not be identified. Our results show that both the correlated resource use counters and correlated errors are required to identify the earliest times of system behaviour change on all dates. Further, we observed there are different time-windows between the times of change identified on all dates. The time-windows range from one-hour to 12-hours.
(a) June 2011.
(b) July & August 2011.
Fig. 6. Times of change in the correlated NUMA & process counters and correlated segmentation faults & general protection errors.
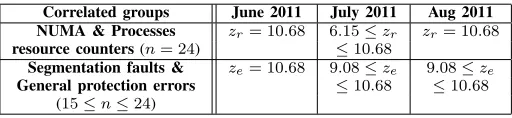
of the strongly positive correlated error groups. We test all the correlation coefficients against the null hypothesis and obtained the z-scores for all the correlation coefficients and a summary is given in Table VI.
TABLE VI
SUMMARY OFz-SCORES.nCONTAINS THE NUMBER OF HOURLY TIME-BINS IN ONE DAY OF LOGS.
Correlated groups June 2011 July 2011 Aug 2011 NUMA & Processes zr= 10.68 6.15≤zr zr= 10.68 resource counters(n= 24) ≤10.68
Segmentation faults & ze= 10.68 9.08≤ze 9.08≤ze General protection errors ≤10.68 ≤10.68
(15≤n≤24)
From Table VI, we observed that the z-scores for all the correlation coefficients range from 6.15 to 10.68. At the 99% confidence level, under the null hypothesis z0r = 2.64 and
z0e= 2.64. Hence, we reject the null hypothesis in favour of
the alternate hypothesis.
We determine the probability of rejecting the null hypothesis when it is true. We apply a one-sided test and use the significance level, α = 0.01 for all given hypothesis tests to obtain a P-value. From Table VI, we observed that the lowest z-score is 6.15. Since this is a one-sided test, the
P-value is equal to the probability of observing a value greater than 6.15 in the standard normal distribution, or
P(Z >6.15) = 1−P(Z≤6.15) = 1−0.99999 = 0.00001. The adjustedP-value is0.00001×25 = 0.00025where 25 is the number of dates. TheP-value is less than 0.01, indicating it is highly unlikely this result would be observed under the null hypothesis. All thez-scores in Table VI are greater than or equal to 6.15 and all the adjusted P-values are less than 0.01, indicating it is highly unlikely these results would be observed under the null hypothesis.
V. RELATEDWORK
A method that uses a feature construction scheme evaluates Pearson correlation and Spearman-Rank correlation based clustering to rank system log messages that are important for problem diagnosis was presented in [32]. In contrast, COR-RMEXT evaluates Pearson and Spearman-Rank correlations to identify patterns of groups of resource use counters in resource use data and groups of errors in message logs. [33] proposes a metric that measures correlations of events and applies an algorithm called event correlation graphs on message logs of two HPC systems and predicted failure and non-failure events. In [14], a time-anomaly correlation approach called SIGs was developed to infer influences between interacting components in the system message logs. The Wilcox Rank-sum correlation method is applied on system performance data to monitor and predict processor failures in [19]. CORRMEXT complements these approaches by identifying patterns of groups of resource use and groups of errors.
[34] proposes a novel way for characterizing normal and faulty behaviour of large-scale cluster systems. The approach uses an Event Log Signal Analyzer (ELSA) module and ap-plies the module on the event logs of two cluster systems. The approach uses two steps: (i) the first step identifies correlations between events, (ii) the second step detects anomalies in the times of the faulty signals. While both the approach and CORRMEXT study the behaviour of cluster systems, there are several differences. First, CORRMEXT implemented a three-step approach. Second, CORRMEXT identifies the time-windows of change in system behaviour by using the corre-lated resource use counter groups and correcorre-lated error groups. Third, CORRMEXT applies both Pearson and Spearman-Rank correlation on the resource use data and message logs.
Several tools such as IPLOM [35], LoGs [36], SLCT/Loghound [37] and SEC [38] have been developed to automate processing of system message logs. Fluentd5 is an
open-source data collector that process multiple application logs. [39] evaluates four log-parsing methods and package them into a toolkit for reuse. CORRMEXT complements these tools by processing standard Syslog messages, Rationalized message logs and TACC Stats resource use data.
[25] analyze the RAS logs and job logs of a IBM Blue-Gene/P MPP system and report several interesting observa-tions on the failure characteristics across different jobs. While
[image:10.612.49.305.532.591.2][25] and CORRMEXT combine analysis of multiple sources of data, there are several differences. First, CORRMEXT analyzed patterns of resource use and events associated with error recovery and error propagation. Second, it combined analysis of both the resource use data and message logs. Third, unlike the IBM BlueGene/P RAS logs the Ranger message logs do not contain any severity-level tags.
Pivot Tracing [40] provides system diagnosis by combin-ing dynamic instrumentation with a novel relational oper-ator. OpenTracing6 provides system diagnosis by using a directed acyclic graph. While Pivot Tracing, OpenTracing and CORRMEXT all provide diagnosis of system problems, the approach implemented by Pivot Tracing, OpenTracing and CORRMEXT are different. First, CORRMEXT combines correlation algorithms and variance extraction. Second, COR-RMEXT does not require additional instrumentation. Third, CORRMEXT identifies error propagation paths which led to both system recovery and failure. Because CORRMEXT pro-vided a pathway to explain the cause of successful and failed error recovery mechanisms, better error handling techniques can be designed by targeting specific issues such as memory allocation and memory leaks.
[21], [22], [26] which are the predecessors of CORRMEXT, correlate errors only to failure events. If errors are correlated only to failure events, the recovery attempt and error propaga-tion process would not be identified. CORRMEXT diagnosed three new dependability cases listed in Table IV. [21], [26] applies only Pearson correlation. In Section IV-A, we showed that only Spearman-Rank correlation identified the NUMA & processes resource use counters on 16 dates and only Pearson correlation identified the NUMA & processes resource use counters on two dates. If Pearson correlation was used as the only correlation method, the correlated NUMA & process resource use counters on the 16 dates would not be identified. However, if Spearman-Rank correlation was used as the only correlation method, the correlated NUMA & process resource use counters on the two dates would not be identified. [21] applies feature extraction on the resource use data and applies Pearson correlation on the message logs, and identifies the time-windows between error and failure events in the message logs. [22] applies Pearson and Spearman-Rank correlation on both the resource use data and message logs but it did not identify the time-windows of change in system behaviour. Differently to [21], [22], CORRMEXT applies Pearson and Spearman-Rank correlationandvariance extraction to both the resource use data and message logs. CORRMEXT identified the correlated groups of resource use counters and correlated groups of errors, and it showed that Pearson correlation and Spearman-Rank correlation are suitable methods. Further, CORRMEXT identified the earliest times of system behaviour change during the day and it showed that the earliest times on alldates can only be identified by analyzing both the resource use data and message logs.
6http://opentracing.io/
VI. DISCUSSION
In this section, we discuss one limitation of the COR-RMEXT framework: Pearson correlation and Spearman-Rank correlation. CORRMEXT does not take into account spikes in resource use and error events. For example, when inodes on a file-system are corrupted and an application sends a large chunk of data to the file-system for writing, this can generate a large quantity of inode failure events and write bytes on the file-system. Further, we do not take into account relation-ships between two events that occur in different time-bins. Having said that, we argue that this pertains to the problem specification described in Section III, i.e.,we seek to identify the resource use counters and events which are linearly or monotonically correlated on the specified date.
VII. CONCLUSION ANDFUTUREWORK
We presented the CORRMEXT framework that correlated both the resource use data and message logs to identify (i) error propagation paths, (ii) reasons of unsuccessful error recovery and (iii) instances of successful error recovery. CORRMEXT diagnosed three dependability-oriented system problems and extracted the variance in the times of the correlated resource use counter groups and correlated error groups to identify the earliest occurrences of the problem. To ensure diagnostics accuracy, CORRMEXT applied the Bonferroni correction and showed that all the correlations are significant. We showed that CORRMEXT can identify recovery attempts and error propagation processes, and showed that knowledge of error propagation paths can be used to aid the systems designers and administrators to improve the effectiveness of error recovery protocols.
In our future work, we plan to extend our analyses of error recovery and error propagation to deal with errors other than memory, communication and file-system I/O errors.
ACKNOWLEDGEMENTS
We would like to thank the Texas Advanced Comput-ing Center (TACC) for providComput-ing the Ranger cluster log data and granting access to their systems administrators. We also thank Karl Solchenbach (Intel Corporation, Europe) for granting access to his research scientists. This research is supported by The Alan Turing Institute under the EPSRC grant EP/N510129/1, The Alan Turing Institute-Intel partnership and the National Science Foundation under OCI awards #0622780 and #1203604 to TACC at the University of Texas at Austin.
REFERENCES
[1] N. El-Sayed and B. Schroeder, “Reading between the lines of failure logs: Understanding how hpc systems fail,” inProceedings of IEEE/IFIP DSN, 2013, pp. 1–12.
[2] G. Wang, L. Zhang, and W. Xu, “What can we learn from four years of data center hardware failures?” in 2017 47th Annual IEEE/IFIP International Conference on Dependable Systems and Networks (DSN), June 2017, pp. 25–36.
[3] A. J. Oliner, A. Aiken, and J. Stearley, “Alert detection in system logs,” inProceedings of IEEE ICDM, December 2008, pp. 959–964. [4] J. Stearly and A. J. Oliner, “Bad words: Finding faults in spirit’s
[5] W. Xu, L. Huang, A. Fox, D. Patterson, and M. Jordan, “Detecting large-scale system problems by mining console logs,” inProceedings of the ACM SIGOPS 22nd Symposium on Operating Systems Principles, 2009. [6] Y. Liang, Y. Zhang, H. Xiong, and R. Sahoo, “Failure prediction in ibm bluegene/l event logs,” inProceedings of IEEE ICDM, 2007, pp. 583–588.
[7] E. W. Fulp, G. A. Fink, and J. N. Haack, “Predicting computer system failures using support vector machines,” in1st USENIX Workshop on the Analysis of System Logs, 2008.
[8] F. Salfner and S. Tschirpke, “Error log processing for accurate failure prediction,” in 1st UNIX Workshop on the Analysis of System Logs, December 2008.
[9] Z. Lan, J. Gu, Z. Zheng, R. Thakur, and S. Coghlan, “A study of dynamic meta-learning for failure prediction in large-scale systems,”Journal of Parallel and Distributed Computing, vol. 70, no. 6, pp. 630–643, 2010. [10] A. Gainaru, F. Cappello, M. Snir, and W. Kramer, “Fault prediction under the microscope: A closer look into hpc systems,” inProceedings of the International Conference on High Performance Computing, Networking, Storage and Analysis, ser. SC ’12. Los Alamitos, CA, USA: IEEE Computer Society Press, 2012, pp. 77:1–77:11. [Online]. Available: http://dl.acm.org/citation.cfm?id=2388996.2389101 [11] I. Fronza, A. Sillitti, G. Succi, M. Terho, and J. Vlasenko, “Failure
prediction based on log files using random indexing and support vector machines,” vol. 86, pp. 2–11, 2013.
[12] A. Pelaez, A. Quiroz, J. C. Browne, E. Chuah, and M. Parashar, “Online failure prediction for hpc resources using decentralized clustering,” in Proceedings of IEEE HiPC, 2014, pp. 1–9.
[13] T. Reidemeister, M. A. Munawar, M. Jiang, and P. A. Ward, “Diagnosis of recurrent faults using log files,” inProceedings of the 2009 Con-ference of the Center for Advanced Studies on Collaborative Research, 2009, pp. 12–23.
[14] A. J. Oliner, A. V. Kulkarni, and A. Aiken, “Using correlated surprise to infer shared influence,” inProceedings of IEEE/IFIP DSN, 2010, pp. 191–200.
[15] S. P. Kavulya, S. Daniels, K. Joshi, M. Hiltunen, R. Gandhi, and P. Narasimhan, “Draco: Statistical diagnosis of chronic problems in large distributed systems,” inProceedings of IEEE/IFIP DSN, 2012, pp. 1–12. [16] Z. Lan, Z. Zheng, and Y. Li, “Toward automated anomaly identification in large-scale systems,”IEEE Transactions on Parallel and Distributed Systems, vol. 21, no. 2, pp. 174–187, 2010.
[17] Q. Guan, D. Smith, and S. Fu, “Anomaly detection in large-scale coalition clusters for dependability assurance,” inProceedings of IEEE HiPC, 2010, pp. 1–10.
[18] G. Bronevetsky, I. Laguna, B. R. de Supinski, and S. Bagchi, “Auto-matic fault characterization via abnormality-enhanced classification,” in Proceedings of IEEE/IFIP DSN, 2012, pp. 1–12.
[19] F. Salfner, P. Troeger, and S. Tschirpke, “Cross-core event monitoring for processor failure prediction,” inProceedings of HPCS DMCC Workshop, 2009, pp. 67–73.
[20] N. Gurumdimma and A. Jhumka, “Detection of recovery patterns in cluster system using resource usage data,” in Proceedings of IEEE PRDC, 2017, pp. 1–10.
[21] E. Chuah, A. Jhumka, S. Narasimharmuthy, J. Hammond, J. C. Browne, and B. Barth, “Linking resource usage anomalies with system failures from cluster log data,” inProceedings of IEEE SRDS, 2013, pp. 1–10. [22] E. Chuah, A. Jhumka, J. C. Browne, N. Gurumdimma, S. Narasimhar-muthy, and B. Barth, “Using message logs and resource use data for cluster failure diagnosis,” inProceedings of IEEE HiPC, 2016, pp. 1– 10.
[23] N. Gurumdimma, A. Jhumka, M. Liakata, E. Chuah, and J. C. Browne, “Towards increasing the error handling time window in large-scale dis-tributed systems using console and resource usage logs,” inProceedings of IEEE ISPA, 2015, pp. 1–10.
[24] ——, “Crude: Combining resource usage data and error logs for accurate error detection in large-scale distributed systems,” in Proceedings of IEEE SRDS, 2016, pp. 1–10.
[25] Z. Zheng, L. Yu, W. Tang, and Z. Lan, “Co-analysis of ras log and job log on blue gene/p,” inProceedings of IEEE IPDPS, 2011, pp. 840–851. [26] Z. Zheng, L. Yu, Z. Lan, and T. Jones, “3-dimensional root cause diagnosis via co-analysis,” in Proceedings of ACM ICAC, 2012, pp. 181–190.
[27] R. T. Evans, J. C. Browne, and W. L. Barth, “Understanding application and system performance through system-wide monitoring,” in Proceed-ings of IEEE DPDNS (IPDPS Workshops), 2016, pp. 1702–1710.
[28] J. L. Hammond, T. Minyard, and J. Browne, “End-to-end framework for fault management for open source clusters: Ranger,” inProceedings of ACM TeraGrid, no. 9, 2010.
[29] IEEE,IEEE Std 1003.1-2001 Standard for Information Technology — Portable Operating System Interface (POSIX) Base Definitions, Issue 6. IEEE Standards, 2001.
[30] R. E. Walpole, R. H. Myers, and S. L. Myers,Probability and Statistics for Engineers and Scientists. Prentice Hall International, 1998. [31] J. J. Goeman and A. Solari, “Multiple hypothesis testing in genomics,”
Statistics in Medicine, vol. 33, no. 11, pp. 1946–1978, 2014. [Online]. Available: http://dx.doi.org/10.1002/sim.6082
[32] S. Sabato, E. Yom-Tov, A. Tsherniak, and S. Rosset, “Analyzing system logs: A new view of what’s important,” in 2nd USENIX workshop on Tackling Computer Systems Problems with Machine Learning Tech-niques, 2007.
[33] X. Fu, R. Ren, J. Zhan, W. Zhou, Z. Jia, and G. Lu, “Logmaster: Mining event correlations in logs of large-scale cluster systems,” inProceedings of IEEE SRDS, 2012, pp. 1–10.
[34] A. Gainaru, F. Cappello, and W. Kramer, “Taming of the shrew: Modeling the normal and faulty behaviour of large-scale hpc systems,” in 2012 IEEE 26th International Parallel and Distributed Processing Symposium, May 2012, pp. 1168–1179.
[35] A. Makanju, A. N. Zincir-Heywood, and E. E. Milios, “Clustering event logs using iterative partitioning,” inProceedings of ACM SIGKDD, 2009, pp. 1255–1264.
[36] J. E. Prewett, “Listening to your cluster with logs,” in5th LCI Interna-tional Conference on Linux Clusters, 2004.
[37] R. Vaarandi, “Mining event logs with slct and loghound,” inProceedings of IEEE/IFIP NOMS, 2008, pp. 1071–1074.
[38] J. P. Rouillard, “Real-time log file analysis using the simple event correlator (sec),” inProceedings of 18th USENIX Conference on System Administration, 2004, pp. 133–150.
[39] P. He, J. Zhu, S. He, J. Li, and M. R. Lyu, “An evaluation study on log parsing and its use in log mining,” in2016 46th Annual IEEE/IFIP International Conference on Dependable Systems and Networks (DSN), June 2016, pp. 654–661.