The Phonon Entropy of Metals and Alloys: The
effects of thermal and chemical disorder
Thesis by
Peter David Bogdanoff
In Partial Fulfillment of the Requirements for the Degree of
Doctor of Philosophy
California Institute of Technology Pasadena, California
2001
@ 2001
Acknowledgements
I
would like to thank my advisor, Brent Fultz, for his encouragement, support andoutstanding research group.
I
count myself fortunate beyond words for having Brent as a research advisor and intellectual collaborator these many years.I
also owe an enduring debt t o those in whose resea,rch footstepsI
followed: Lawrence Anthony, Laura Nagel and Heather Frase being chief among these at Caltech.My research would not have been possible without the help and wisdom of our many collaborators at Argonne and Oak Ridge national labs: Stefan Rosenkranz, Ray Osborn and Lee Robertson. In addition, I owe much t o the many people at Caltech who helped with experiments over the years: Channing Ahn, Tab Stephens, Carol Garland, Chuck Witham, Stephen Glade, Adrian Hightower, Andy Waniuk and many others who
I
have undoubtedly forgotten. Many thanks to my colleague Mike Manley, who contributed much t o my underst anding of vibrational entropy.My thanks and best wishes to Alexander Papandrew, Olivier Delaire and Tabitha Swan-Wood for showing an interest in phonons and for many interesting discussions this past year. Good luck!
I
would like t o thank my long time friend and co-conspirator Adrian Hightower,as well as Stephen Glade, Ben Shapiro, Jason Graetz and others for keeping me sane and productive over the years. Many thanks to Heather Frase for introducing me to swing dancing. To my Harvey Mudd friends: Daniel "Hole" Hyman, Adam "Lithuanian High Command7' Rakunas, John "Trager" Trager, Paul "Leo" Parker, Ben Melhuish and many others who
I
best not identify by name.To my friend Jeffrey Drummond I offer my heartfelt appreciation and gratitude for his support over the years.
I
am in your debt.Abstract
Vibrational entropy is important for the thermodynamics of alloying, alloy formation, phase transitions and pha-se stability at high temperature. Vibrational entropies of alloying and alloy formation were calculated for 32 binary alloys and intermetallic compounds using phonon DOS curves taken from the literature. The vibrational entropies of formation span a wide range from -0.64 t o $0.55 k ~ / a t o m , and the vibrational entropies of alloying ranged from -0.39 to $1.0 ks/atom. This range ex- ceeds the range of configurational entropy of a binary alloy, which reaches a maximum value of $0.69 kB/atom and a minimum value of 0 kB/atom.
The vibrational entropy of the NiTi rnartensitic transition was measured using low- temperature calorimetry and inelastic neutron-scattering. The high-temperature B2 phase of NiTi has a vibrational entropy 0.5 kB/atom larger than the low-temperature martensitic phase. The difference in vibrational entropy accounts for the total entropy
of the austenitic-martensitic phase transition.
Inelastic neutron scattering was used to show that the phonon DOS of
V
is un- changed between 20 and 1000"
C, inconsistent with the phonon softening expected from thermal expansion.It
is found that the effects of volume expansion and rising temperature exert equal and opposite shifts on the phonon DOS. The pure temper- ature dependence of the phonon DOS is due to strong phonon-phonon scattering, which in turn leads t o a large anharmonic vibrational entropy contribution at high temperature.v
Contents
...
Acknowledgements 111
Abstract iv
1 Introduction 1
1.1 Overview
. . .
1. . .
1.2 Experimental Met hods 5 1.2.1 Calorimetry. . .
5. . .
1.2.2 Inelastic Neutron Scattering 5 1.3 Anharmonic Entropy. . .
8. . .
1.4 Chemically Disordered Materials 9 1.5 Summary. . .
112 Experimental Trends in Vibrational Entropy 12 2.1 Introduction
. . .
122.2 Methods and Results
. . .
142.3 Correlations
. . .
162.3.1 Vibrational Entropy of Formation
. . .
162.3.2 Vibrational Entropy of Alloying
. . .
212.4 Summary
. . .
293 T h e Role of Phonons in t h e Thermodynamics of t h e NiTi Marten- sitic Transformation 30 3.1 Introduction
. . .
303.2 Experimental Methods
. . .
313.3 Results
. . .
35. . .
3.3.2 Thermal Expansion
. . .
3.3.3 Neutron Scattering
. . .
3.4 Discussion. . .
3.4.1 Vibrational Entropy. . .
3.4.2 Premartensitic Phonon Softening. . .
3.4.3 Soft Acoustic Phonons in B2 Austenite. . .
3.5 Conclusions4 The Temperature Dependence of t h e Phonon Entropy of Vanadium
. . .
4.1 Introduction. . .
4.2 Experimental. . .
4.3 Analysis and Results. . .
4.3.1 Phonon Density of States. . .
4.3.2 Vibrational Entropy. . .
4.3.3 Phonon Broadening. . .
4.4 Discussion
. . .
4.4.1 Phonon DOS Curves. . .
4.4.2 Anharmonic Entropy. . .
4.4.3 Chromium, Niobium, Titanium and Zirconium. . .
4.5 Conclusions. . .
4.6 Acknowledgements5 The Vibrational Entropy of Alloying and Ordering in Cu-Au
. . .
5.1 Introduction
5.1.1 Alloying in Cu-Au
. . .
. . .
5.1.2 Ordering in Cu3Au5.2 Experimental Methods
. . .
. . .
5.2.1 Disordered Cu- Au Alloys5.2.2 Ordered Cu3Au
. . .
. . .
5.3.2 Neutron-Weighted Vibrational Entropy
. . .
5.3.3 Neutron-Weight Corrections for Disordered Alloys5.3.4 Vibrational Entropy of Ordering of Lla CusAu
. . .
. . .
5.4 Discussion
5.4.1 Phonon DOS
. . .
. . .
5.4.2 Generalized Partial Entropy Modeling. . .
5.4.3 Local Cluster Approximation5.4.4 Vibrational Entropy of Ordering of Cu3Au
. . .
. . .
5.5 Conclusions6 Conclusions
. . .
6.1 Science and Methods. . .
6.1.1 Method 1. . .
6.1.2 Method 2. . .
6.1.3 Method3. . .
6.2 Future Work6.2.1 Temperature Dependence of the Phonon
DOS
. . .
6.2.2 Vibrational Entropy of Alloying in the Dilute Limit
. . .
6.2.3 Fitting Lattice Dynamics to the Phonon DOS. . .
A Neutron Scattering Analysis from TOF Instruments
. . .
A.lTOF
Spectrometer. . .
A.2 Data Analysis. . .
A.3 Background Correction. . .
A.4 Thermal and Multiphonon Corrections. . .
A.5 Neutron-Weight CorrectionsB Local Cluster Approximation
List
of
Figures
. . .
1.1 Phase diagram of the Co-V alloy system. . .
2.1 Measured versus Debye value for selected alloys2.2 Measured AS2bm versus difference in metallic radii of solute and solvent atoms
. . .
2.3 Measured AS,lp
versus atomic mass difference for L12 alloys. . .
2.4
Measured AS:? versus prediction from volume and mass effects for. . .
selected alloys2.5 Measured
AS:;?
versos Debye value for selected Llz alloys. . .
2.6 Measured AS~::Y versus volume change upon alloying for L12 alloys ..
3.1 Latent heat of martensite-austenitephase transitionin NiTi
. . .
3.2 The low-temperature heat capacity of martensitic NiTi. . .
3.3 Thermal expansion of NiTi plate in three orthogonal directions. . . .
3.4 Neutron scattering data and multiphonon contribution for NiTi. . . .
3.5 Neutron de-weighting functionF(E)
for NiTi. . .
3.6 Phonon DOS of martensitic and austenitic NiTi. . .
4.1 Phonon DOS ofV
at 293. 873. 1273 and 1673K. . .
. . .
4.2 Anharmonic entropy contributions to V at high temperature4.3 Effect of convolving 293
K
V DOS with damped harmonic oscillator of. . .
variable Q4.4 Best-fit inverse
&
versus temperature. . .
4.5 Phonon DOS of vanadium at 293K
compared with results of Sears, eta1.[1].
. . .
4.6 Anharmonic entropy of elemental chromium, niobium, titanium and4.7 Phonon DOS of bcc zirconium. niobium and chromium at high tem-
. . .
perature 59
5.1 X-ray diffraction patterns of disordered C U ~
. . .
~ A ~ ~ ~. . .
5.2 X-ray diffraction patterns of ordered and disordered Cu3Au
5.3 Neutron-weighted phonon DOS of disordered CuxAul-, alloys
. . .
5.4 Neutron-weighted vibrational entropies of disordered Cu-ilu alloys at3 0 0 K
. . .
5.5 Phonon DOS of elemental Cu and Au at 300K
. . .
5.6 Neutron-weight corrected vibrational entropies of disordered Cu-Au
. . .
alloys at 300K
5.7 Partial vibrational entropies of Cu and Au in Cu-Au alloys
. . .
5.8 Phonon DOS of 3 and 10% Cu-Au alloys using Green function analyt-
. . .
ical theory5.9 Partial phonon DOS of Au in Cug6AuO4 alloy using resonance peak approximation
. . .
5.10 Phonon DOS of ordered and disordered Cu3Au. . .
5.11 Vibrational entropy of formation of disordered Cu-Au alloys. . .
5.12 Phonon DOS of disordered CusAu derived from phonon dispersions ..
. . .
A.l Schematic diagram of time-of-flight neutron spectrometer 101
. . .
A.2
k,
k;
andkf
neutron wavectors 102A.3 Q as a function of angle-bank and energy gain for a T O F spectrometer
.
104 A.4 Scattering surface, S(Q,E). for the third angle-bank of an FeAl samplecontaining 2% vacancies
. . .
105 A.5 Neutron data (background corrected) from the twelfth and fourth an-glebanks of the LRMECS T O F spectrometer
. . .
106 A.6 Neutron data analysis flowchart. . .
107List
of
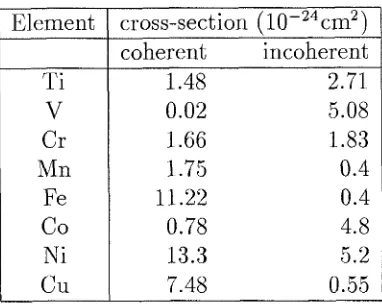
Tables
1.1 Thermal neutron scattering cross-section of 3d-transition metals
. . . .
7 2.1 Vibrational entropies of alloying and formation for 32 binary alloys and. . .
compounds 17
. . .
2.2 Correlations with entropy of alloying 28
3.1 Enthalpy and entropy of martensite transformation in NiTi
. . .
35 3.2 Best fit Born-von KArmin force constants to NiTi neutron-weighted. . .
phononDOS 40
5.1 LCA cluster coeffecients for the vibrational entropy of formation of
. . .
Cu-Au 88
. . .
Chapter
1
Introduction
1.1
Overview
The measurement and prediction of thermodynamic equilibrium in the solid state is one of the enduring scientific goals of materials science and condensed matter physics. Measuring thermodynamic equilibrium is the everyday work done in characterising new materials: atomic positions and crystal structure are determined by diffraction, microstructural features through electron miscroscopy. Predicting thermodynamic equilibrium has historically been the work of theory and theorists; the minimization of the free energy function with respect to atomic position is the ultimate goal. Much progress has been made towards this goal in the last few decades; the advent of fast, cheap computation has been crucial in this regard. The free energy function has two discrete terms: energy and entropy. The free energy function,
F,
can be calculated withwhere
E
is the internal energy,T
is the temperature andS
is the entropy.The energy term can now be calculated, in the ground state at zero temperature, for near arbitrary atomic positions. The entropy terms, however, are less well char- acterised. There are many different possible sources of entropy in a solid: electronic, magnetic, configurational and vibrational:
2
the handful of materials that exhibit magnetic order. The vibrational entropy is ubiquitous, very difficult to predict computationally and also quite hard to measure experiment ally. Ironically, the vibrational entropy comprises most of the entropy of a solid, yet historically is the least well understood.
Some progress has been made in our understanding of the vibrational entropy of materials. Grimvall and J. Roskn have shown that calorimetric entropy differences between T i c , ZrC and HfC are explained entirely by the mass differences of the constituent metals [2]. Langeveld and Niemantsverdriet showed that segregation of P t to the surface of a bulk Pt-Rh alloy was accounted for by the large vibrational entropy difference between bulk and surface P t [3]. Clark and Ackland calculated the effect of vacancies and interstitial atoms on the vibrational entropy of silicon
[4].
[image:13.579.45.495.308.650.2]Co Atomic Percent Y
Figure 1.1: Phase diagram of the Co-V alloy system.
3
figure 1.1 we show the alloy phase diagram for the Co-V system [5]. The solubility of Co in bcc
V
rises from 8% at ambient to 15% at 1000"
C. The configurational entropy, in the absence of short-range order, averages 0.35 ks/atom in this concentration range. The contribution to the free energy is arrived at using equation 1.1. We calculatea configurational free energy of -900 J/mol at room temperature and -3700 J/mol at 1000 "C. Clearly, the fourfold increase in the free energy contribution at 1000 "C is responsible for the greater solubility at higher temperature. We arrive at this conclusion by noting that the bcc V solid solution phase competes with the CoV3 phase up to 1000°C. For a given temperature and total composition, the relative amounts of bcc
V
and CoV3 are determined by the choice that minimizes the total free-energy,Ftotal.
The quantityFtOtal
is the sum of the free-energies of the two phasesThe
FbccV
term has an entropy contribution that the CoV3 phase lacks: the configura- tional entropy. The CoV3 phase is a stoichiometric intermetallic compound, and thus lacks the configurational degrees of freedom. As the temperature rises, the greater total entropy of the bcc V phase becomes a more important term to the total free energy, and the free energy minimum moves in the direction of more bcc V phase.Although it is likely that the vibrational entropy as a function of Co concentra- tion contributes t o the rising solubility of Co in bcc V, the effect is masked by the configurational entropy.
A
clear example of the effects of vibrational entropy are in the allotropes of elemental Co. Co undergoes a transition from hcp to fcc crystal structure at 422°C. The free-energy difference between the two phases must be zero at this temperature,T,.
4
electronic band structures and total electronic energies. The source of the entropy
difference can be arrived at by elimination. Elemental crystalline solids have no con- figurational entropy, and the magnetic entropy difference is zero since both phases are ferromagnetic. Electronic entropies of transition metals are small at moderate temperatures, typically 1 to 10% of the size of the vibrational entropies. Thus, we ex- pect the electronic entropy difference between the two phases to be small and unable to account for all the entropy of the ~ h a s e transition. The only possible remaining source of the entropy difference between the phases is vibrational.
The entropy of solid state allotropic phase transitions has attracted much recent interest. Inelastic neutron scattering and calorimetric measurements on Ce showed that the allotropic /'3 - y phase transition has a vibrational entropy contribution that accounts for 65% of the total entropy difference 161. In chapter 3 we show that vibra- tional entropy accounts for the entire entropy of the ambient martensite transition in NiTi, to within experimental error. At higher temperatures, the electronic entropy can equal the vibrational contribution. Electronic band-structure calculations show that the electronic entropy accounts for 63% and 40% of the hcp-bcc phase transitions in Ti and Zr, respectively
[7].
More recent calculations by Moroni, Grimvall and Jarl- borg [8] claim the electronic entropy accounts for over 90% of the transition entropy in both these cases. However, the same work show that the high temperature hcp-bcc phase transitions in Sc andY
have electronic entropy differences that accounts for only 32% and 50% of the total entropy, respectively. In the high temperaturey
-6
transition in Ce, recent measurements [6] show that the vibrational entropy differ- ence is almost twice as large as the total transition entropy. The electronic entropy difference must be half as large and with the opposite sign in order to account for the measured total entropy.
Allotropic phase changes are an example of first-order phase transitions. First order phase transitions follow the relationship between energy differences, entropy differences and transition temperature shown in equation 1.4. Given a fixed energy difference, the exact value for AS is said to determine the transition temperature,
T,.
5
agreement with experiment and measured transition temperatures. The effect of lattice vibrations improved the agreement between predicted and experimental values of the solubility of Sc in
A1
[9]. On the other hand, agreement between predicted and experimental values of the order-disorder transition temperatures in Cu-Au alloys worsen when vibrational effects are included [lo]. In this case, the lack of agreement with experiment is indicative of our continuing poor methodology for calculating the energies and entropies of the chemically disordered solid.1.2
Experimental Methods
1.2.1 Calorimetry
Calorimetric data are indispensable in any thermodynamic study. Heat capacity measurements and their corresponding entropies are regarded as the most reliable direct measurements of thermodynamic quantities. However, there exists no way to separate the differing contributions t o the heat capacity from all the internal degrees of freedom. Thus, although one can measure the calorimetric entropy of a solid very accurately, one cannot separate the vibrational entropy from the electronic, magnetic and ordering contributions. Vibrational entropies derived from calorimetric studies suffer from both the uncertainty of the measurement and the difficulty in ascertaining other contributions t o the entropy. In many cases, the latter overwhelm the former. Calorimetric data is a useful piece of the entropic puzzle, but it fails to give the entire picture.
1.2.2 Inelastic Neutron Scattering
6
accurately one can measure the vibrational excitations of the solid. In turn, these de- pend on how well the sample scatters neutrons and the type of neutron spectrometer used. These factors are given further consideration below.
Incoherent and Coherent Scattering
Neutrons can scatter from a solid coherently or incoherently. The former preserves phase between the initial and scattered neutron waves; the latter does not. An im- portant consequence of this distinction is that Bragg peaks are observed only from coherently scattered neutrons. Coherent inelastic scattering occurs when the change in neutron wavevector equals the wavevector of the dynamic excitation in the Sam- ple: magnetic, vibrational or otherwise. Incoherent inelastic scattering, on the other hand, has no such conservation. The vibrational entropy can be calculated from measurements of either the incoherent or coherently scattered neutron cross-section. The former is most easily performed using a triple-axis neutron spectrometer and involves no approximations in the data analysis. This technique is unfeasible when the sample exhibits significant coherent scattering. The latter demands the use of a time-of-flight (TOF) neutron spectrometer and involves a number of approximations in the data analysis. As a side note, these approximations can be eliminated by us- ing a lattice dynamics model t o interpret the raw data. However, current generation T O F instruments lack the neutron flux and spectrometer resolution to make this a feasible option. The T O F spectrometer method is also appropriate for samples that have significant incoherent scattering.
In theory, every element exhibits some coherent and some incoherent scattering. Practically, most elements, in their naturally found isotopic proportions, exhibit a signicant amount of coherent scattering (see Table 1.1). Therefore, with the exception of a handful of elements and almost no alloys, most materials require time on a T O F neutron spectrometer for measurements of the vibrational entropy. Chapters 3 and 5
Table 1.1: Thermal neutron scattering cross-section of 3d-transition metals. Element Ti
V
C r Mn Fe Co Ni CuVariation in Elemental Scattering Cross-Section
cross-section (10-24~m2) coherent incoherent
1.48 2.71
0.02 5.08
1.66 1.83
1.75 0.4
11.22 0.4
0.78 4.8
13.3 5.2
7.48 0.55
Additional difficulties arise for samples containing more than one element. Differ- ing elements have differing total neutron scattering cross-sections; Ni and Al have, respectively, cross-sections of 18 and 1.3 barns. Individual lattice-dynamical excita- tions (phonons) scatter neutrons with an efficiency proportional to the quotient of cross-section and atomic mass of the atoms undergoing displacement during the ex- citation. Practically speaking, this means that the phonons that displace the species with larger cross-sections and samller masses give a much greater signal than the phonons that displace the lesser-scattering elements. The energy spectrum of phonons measured by inelastic neutron scattering is thus weighted by the neutron-scattering cross-sections of the individual atomic species in the sample. This neutron-weighting of the phonon spectrum, or density of states (DOS), prevents a correct derivation of the vibrational entropy. The neutron-weight correction for experiment a1 data is not simple. Chapters 3 and 5 both contain numerous examples of different techniques used t o remove the neutron-weighting from the phonon DOS of binary alloy systems. These include using a lattice-dynamical model to fit the neutron-weighted DOS and estimating the element-specific partial DOS from multiple neutron-weighed DOS at similar compositions. These corrections become more elaborate and less reliable for ternary and high-order systems. Chapter 4 contains neutron-scattering data taken from an elemental metal. In this case no neutron-weight correction was needed.
[image:18.581.168.359.58.211.2]8
phonons is the largest obstacle in any attempt t o measure the phonon
DOS
directly with inelastic neutron scattering. Historically, these obstacles were considered so unmanageable that very few systematic atternpts to measure the phonon DOS in coherently scattering multi-atomic systems were made. In part, this thesis deals di- rectly with how to overcome these obstacles, showing in chapters 3 and 5 a consistent methodology for extracting and correcting the neutron-weighted DOS from coherently scattering alloys.1.3
Anharmonic Entropy
Lattice vibrations are primarily quantum mechanical phenomena at low temperature and classical phenomena at high temperature. The classical nature of phonons at finite temperature is responsible for the existence of a quantity known as anharmonic entropy. Simply put, anharmonic entropy is the entropy due to deviations from harmonicity of the interatomic forces. The cubic and quartic terms in the interatomic forces are responsible for the existence of thermal expansion; the anharmonic entropy has often been loosely defined as the excess vibrational entropy associated with the thermal expansion of the solid. This definition is strictly incorrect because the thermal expansion of the solid accounts for both a volume and a temperature effect on the phonon energies. Furthermore, changes in the electronic entropy with specific volume can also drive thermal expansion. It can be shown that the anharmonic entropy is identified solely with the temperature effect on the phonon energies, to first order.
9
low and thus the atoms mostly see harmonic interatomic forces. At high tempera-
tures vibrational displacements are large and atoms see large anharmonic interatomic forces.
By using phonon energies modified by phonon-phonon scattering t o calculate the vibrational entropy we can account for the anharmonic contribution. This method is exact to first order in the vibrational entropy Ell]. If the anharmonic effects are large and the phonon energy shifts are large, it is unclear how well this method accounts for the anharmonic entropy. Thus, at very high temperatures it is unclear whether using the temperature dependent phonon
DOS
with the standard formula is sufficient to capture the entire anharmonic contribution to the vibrational entropy. In chapter 4 it is shown that forV
the temperature dependent phononDOS
captures the anharmonic contribution to at least 1400 OC.
1.4
Chemically Disordered Materials
simultaneously in order t o account for the long range of the forces in metals. This methodology is not possible using the most accurate ab-inito calculation codes, which requires days or weeks t o calculate the energy of one crystal configuration.
Two theoretical approaches have shown some success in dealing with chemical
disorder. The cluster variation method
(CVM),
refined by Zunger and others [lo], was first formulated to calculate the configurational entropy in the presence of short range order [12, 131. Using this method, the vibrational entropy of a chemically disordered material can be calculated by computing the entropy of a large number of chemically ordered materials. The chemically disordered alloy is then approximated by a suitable average over the ordered materials, taking into account short-range chemical correlations t o arbitrary distances. Our measurements of disorderd Cu-Au alloys in chapter 5 show good agreement with this method. The drawback of this method is that the phonon DOS of the disordered material is never computed, only the vibrational entropy and free energy.The second approach uses special quasi-random structures (SQS) to approximate the disordered material [14]. Using this method, an artificial unit cell (SQS) is constructed that has the property that the resultant crystal has some of the same short-range chemical correlations of the disordered material. The SQS crystal has long-range translation periodicity and is amenable to ab-initio computation, unlike the real disordered material. The properties of the SQS crystal are then assumed t o be the same as the disordered material. The drawback of this approach is that the SQS crystal matches only a handful of the short-range chemical correlations in the disordered material. It is unclear if the SQS crystal handles local relaxations in the same way as the real disordered material. In contrast, the
CVM
method can abri- trarily extend the range of the chemical correlations that are matched by including more ordered materials in the computation.1.5
Summary
Chapter 2 Experimental Trends in
Vibrational Entropy
2.1
Introduction
There has been a steady growth in our understanding of alloy phase diagrams from ab-initio calculations [15] and more phenomenological approaches [16, 17, 18, 191. From the work of Ising [20] and Bragg and Williams 1121, 221 to the present day, the free energies of alloy phases have been largely understood as an internal energy plus a
configurational entropy [23, 24, 25, 26, 27, 151. There were indications that vibrational entropy could also be important to alloy phase stability
[28,
29, 30, 31, 32, 331 but experimental proof of this has been available only recently [34, 35, 36, 37, 38, 391.In the harmonic approxin~ation, differences in the phonon density of states
(DOS)
can be used t o identify the reasons for differences in vibrational entropies of alloy phases. There have been recent attempts to calculate the lattice dynamics of inter- metallic phases [4, 40, 41, 421 and some alloys were chosen for these calculations in part to provide comparisons with experimental vibrational entropies of order-disorder transformations. The difficulty with such comparisons is calculating the phonon
DOS
of the disordered alloy. The state of disorder involves chemical and spatial disorder of atoms on crystal lattice sites, and the details of this disorder may differ between experiments and calculations. For example, disordered alloys of Ni3Al show a wide range of lattice parameters [43, 44, 45, 461, suggesting that Ni3A1 is not a reliable alloy for experimental comparisons.
13
of both the initial state (two crystalline elemental metals) and the final state (inter- metallic compound) are translationally ~ e r i o d i c , so well-defined phonon modes exist. An advantage for experimental studies of vibrational entropies of formation is that the lattice dynamics for the phonon
DOS
should be obtained reliably from coher- ent neutron inelastic scattering experiments on single crystals. In contrast, coherent neutron inelastic scattering experiments on disordered alloys are typically interpreted with the assumption of a virtual crystal, an assumption that has been shown to be unreliable 138, 47, 41, 421.Here we report differences in vibrational entropies of formation, AS$irn
,
for in- termetallic compounds and alloys in the harmonic approximation. We performed a search of the literature for data on phonon densities of states for alloys and com- pounds, and their elemental constituents [48, 49, 50, 51, 52, 53, 54, 55, 56, 571. The vibrational entropies of formation can be large and range from 0.64 to $0.55 ks/atom. It is interesting that this range is larger than is possible for the range of the configu- rational entropy of mixing for a binary alloy, ASCOnfig(c):AScOnfig(c) = ks[c In c
+
(1 - c) ln(1 - c)]which has a maximum value of 0.693 kB/atom when c = 0.5, and has a minimum value of 0.
matrix atoms.
2.2
Methods and Results
In the high temperature limit, the vibrational entropy of formation can be obtained from the phonon densities of states as
00
= -3ka
1
Ag(E) ln(E)dE (2.2)where Ag(E) is defined as the difference in phonon DOS of the intermetallic com- pound, g(E), and the elemental constituents, g;(E):
where fi is the atom fraction of the elemental constituent, i, in the intermetallic compound. The fi sum to unity. To calculate the vibrational entropy of alloying, a s a l l o y
,;,, ,
we use the following definition of Ag(E):where gl(E) is the DOS of the majority constituent element - the element with the largest fi. To compare the success of the many different correlations and models, we use the parameter,
R,
the standard error of estimate, as a measure of the quality of the fit to a straight line through the origin. We defineR
aswhere the index i sums over all the data points, ASexP is the measured value of the vibrational entropy difference for data point i, Asfit is the best fit or model value of the vibrational entropy for data point i, and n is the number of data points. The value
R
can be used to compare the quality of correlation between different models.15
pounds and alloys and their 21 elemental constituents compiled in the Landolt- Bornstein tables [51, 521 and other references [48, 49, 50, 53, 56, 58, 54, 59, 361. All neutron scattering measurements were performed at room temperature, with the exceptions of elemental Ge (80 K), P b (80 K) and
Pt
(90 K). Most phonon DOS curves were obtained from coherent inelastic neutron scattering measurements of phonon dis- persion curves from single crystals. The original authors fit their measured phonon dispersion curves to predictions from a Born-von KBrmAn model of lattice dynam- ics. This model was then used to calculate the phonon DOS. Exceptions were the DOS curves for the A15 intermetallics, bcc alloys and the MgZn2 Laves compound, which were obtained by neutron scattering from polycrystalline samples. For these polycrystalline samples, the neutron data were interpreted in the incoherent approxi- mation [60, 611, but without correcting for the different constituent scattering lengths. This correction is in principle impossible without prior knowledge of the lattice dy- namics, but it could be important. Results for the A15 intermetallics, bcc alloys and the MgZn2 Laves compound should therefore be treated with caution.For the present study, we used two methods for obtaining phonon DOS curves. In the first method, the interatomic force constants provided by the original authors were used to calculate the phonon DOS, as described previously 157, 361. In the second method, we converted the published graphs of the phonon DOS curves into digital form using the software package Datathief 2.0b. Although the number of original points in the data was not preserved, the shape of the DOS curve was reproduced
faithfully after digitization. The digitization process provided essentially the same phonon DOS curves that we calculated from the force constants, and nearly the same values of AS$;m that we calculated directly with the Born-von KLrmAn model
16
underlying lattice. We therefore do not present
boy
for the A15 and Laves phase compounds.2.3
Correlations
2.3.1
Vibrational Entropy of Formation
We correlated the values of 4 S g m in Table 2.2 to the standard thermochemical properties of the elements suggested by Hume-Rothery and others, i.e., differences in metallic radius, mass, electronegativity, the enthalpy of mixing [62, 63, 64, 651 and Mendeleev number [66]. Some of the more interesting correlations are reported here. It might be expected that differences in vibrational entropy would correlate t o changes in Debye temperature,
OD
,
which we obtained from measured values of the bulk modulus 167, 68, 69, 70, 711. We used the following relationship to find the Debye temperature,OD :
where
B
is the bulk modulus,M
is the atomic mass and p is the density. The value ofM
for the compound was the compositionally-weighted mean of the elemental atomicmasses. From equation 2.6 we calculated the vibrational entropy of forination as
where Ob is the Debye temperature of the ith constituent element. Note that any constant of proportionality in equation 2.6 would cancel in equation 2.7. The re- sults, presented in figure 2.1, show that the Debye approximation is unsuccessful for predicting vibrational entropies of formation.
Alloy Structure
AS::?
a s f o r m vib (kB/atom) (kB/atom)CeSn3 Ll2 NA -0.54
k
0.09LaSn3 Ll2 NA -043
f
0.09Ni3AS Ll2 -0.20 -0.20
Ni3Fe Ll2 0.02 0.09
Nio.7Pto.3 L12 0.24 -0.24
Pt3Fe L12 -0.23 0.14
Pd3Fe L12 -0.27 0.05
Pt3Mn Ll2 -0.25 NA
Cu3Zn Ll2 0.23 -0.01
Cu3Au L12 0.51 0.07
Fe3Pt L12 1.0 0.55
Fe3A1 Do3 -0.01 -0.06
Nb3A1 A15 NA -0.28
Nb3Sn A15 NA -0.59
V3Si A15 NA -0.31
V3Ge A15 NA -0.25
Nio.3Feo.7 A1 (fcc) 0.13 0.32
Nio.55Pdo.45 A1 0.48 0.02
Nbo.75Zro.25 A2
(bee)
0.32 0.23Nbo.zZro.8 A2 0.54 0.21
Vo.75Tio.25 A2 0.37 0.31
f
0.07 Vo.75Cro.25 A2 -0.19 -0.03 6 0.07 V0.93Pto.07 A2 -0.39 -0.56k
0.09 V0.95Pto.05 A2 -0.26 -0.42f
0.09 V0.95Cr0.05 A2 -0.02 -0.10f
0.09Zno.47C~o.53 B2 NA 0.04
CeAS2 C l 5 NA -0.64
LaA12 C15 NA -0.41
YA12 C15 NA -0.33
MgZn2 C14 NA 0.19
MgaPb C1 NA -0.57
-3k,ln[0
alloy
0 1 - f 1 ~ ~ f 2 ]elastic constants emphasize the low energy phonons.
At
modest temperatures the higher energy phonons account for most of the heat capacity, however, and the ele- ments and compounds discussed here showed large differences in the structure of the higher energy part of their phonon DOS. The structure of the phonon DOS at higher energies is expected to depend more sensitively on the local structure of the alloy [72]than the low energy part of the DOS.
Of the correlations performed with other thermochemical parameters, the most successful involved the difference in metallic radius [73] between the majority and minority species. This correlation is shown in figure 2.2 for L l z compounds.
Ar
metal
(4
Figure 2.2: Vibrational entropies of formation of L I Z alloys as a function of differ- ence in metallic radius between the majority species and the minority species. The difference, Armetal, is positive when the majority species is larger than the minority species.
[image:30.592.56.439.259.555.2]2 0
a similar trend was found, although the entropy va.lues for the A15 compounds were all strongly offset negative by about 0.36 kB/atom. This offset may originate with the difference between bcc and A15 structures, probably because the A15 structure includes compressed chains of atoms. The L12 data of figure 2.2 lack this offset because the underlying lattice has not changed (fcc t o ordered fcc).
The success of the correlation of with differences in metallic radius seems consistent with interatomic force constants determined from coherent inelastic neu- tron scattering. Consider first the case where the B-atom is larger than the A-atom. The condition for axially-symmetric I n n force constants, C1,, - CI,, = C1,,, is sat- isfied reasonably well for both A-A pairs and A-B pairs in most L12 alloys of A3B stoichiometry [51]. Furthermore, the force constants
C ~ G ~
are usually small, indi- cating that the dominant forces between A-B Inn pairs are radial. This suggests an intuitive picture of the lattice dynamics involving spheres that interact by stiff first-neighbor central forces. First consider the case of an A3B alloy with the L12 structure, where the largerB
atoms fit tightly into a matrix of smallerA
atoms. The general trend of finding large force constantsc$gB
andC ~ G ~
is consistent with this stiff sphere picture. When the larger B-atoms are squeezed onto the A-lattice without causing much change in lattice parameter, the amplitudes of the atomic vibrations are expected to be constrained, and the vibrational frequencies increased. This effect is consistent with the large slope of the curve ofA S z m
versus Ar at increasingly negative Ar. (The exception to the trend in figure 2.2 was the invar alloy FesPt,not shown on figure 2.2, which has a positive of $0.5 kB/atom. The force constants for Fe-Pt neighbors showed by far the largest deviations from central force character of any L12 alloy. Invar alloys are generally expected to show anomalous vibrational modes.)
21
metallic radius of the B-atom. This is consistent with the flattening of the curve in figure 2.2 for small and positive values of Ar. As a corollary, we suggest that when the B-atoms are smaller than the A-atoms, the phonon DOS of the L12 alloy should be less sensitive to the state of chemical order in the alloy.
2.3.2
Vibrational Entropy of Alloying
It
is well-known that mass disorder has no effect on vibrational entropy, assuming theforce constants remain unchanged. It is therefore unreasonable to make a model for the effect of atomic mass on the vibrational entropies of formation of intermetallic compounds from their constituent elements. In alloying, however, substituting atoms of one mass for atoms of a different mass will alter the vibrational entropy even when the interatomic force constants remain unchanged. At a fixed temperature such a substitution will have no effect on the mean-squared interatomic displacement (in the harmonic approximation), which is set by the force constants. The substituted alloy will explore a different range in its momentum coordinates, p, however. Since p2/2M oc kBT, the range in momentum coordinates will increase as the square root of the increased mass of the alloy. The change in vibrational entropy will be (per substituted atom):
where the masses of the solute and matrix atoms are MsOlute and M,,triX. The corre- lation between the vibrational entropy of alloying and In(Ms,lute/M,,t,ix) is shown in figure 2.3. This mass correlation, without adjustable parameters, seems reasonably successful with
R
= 0.212.where yi is the mode Gruneisen parameter. Using w,,,, as a constant of normal- ization, the force constant effect on the vibrational entropy,
A S Z
,
can then be evaluated as3N
a s f o r c e
vib = + k B z 7 i A l n V i = l
We assume the Griineisen parameter is the same for all phonon modes. For the contribution to the vibrational entropy change upon substituting the minority species for the majority species, we attempt to use x-ray lattice parameter data [69, 741 for the change in volume upon alloying. The change in entropy of the alloy owing to changes in force constant is (per atom):
V a ~ l o y
OS"'~'
vib = 3y
kBln(-)
V m a t r i x
where
Vall,,
is the volume per atom of the alloy, andVrnatrix
is the volume per atom of the elemental metal of the majority species.Combining the mass effect of alloying, equation 2.8, with the force constant effects predicted by equation 2.14, and setting y = 2, we obtain for an alloy with solute concentration, c:
M s o l u t e V a ~ ~ o y
= c 3 k ~ in
(
)
+
6 k s in(-)
vib
2
24
For L12 alloys, the correlation with equation 2.15 is less successful than the mass effect alone (equation 2.8 and figure 2.3). The theoretical fit overestimated the mea- sured entropy change by a factor of 2 to 3 in most cases. The change in unit cell
volume may be unsuccessful as a parameterization of the change in vibrational modes because some interatomic separations are reduced, and some are expanded beyond their equilibrium separations when an atom of different size is inserted into the ma- trix. Upon alloying, some of the interatomic forces are therefore increased, and some decreased. The expected trend for correlation of vibrational modes to the unit cell volume is uncertain. We may expect equation 2.15 to be more appropriate for the vibrational entropy of substitution between the same cryst a1 structures. Figure 2.4 shows the vibrational entropy difference between similar Laves, L12 and A15 phases as a function of minority constituent and volume difference [69, 741. The same data plotted versus equation 2.8 (mass term only) gives a moderately better correlation (not shown) with an
R
value of 0.316.In figure 2.5 we plot the vibrational entropy of alloying for L12 alloys against the Debye model approximation of equations 2.6 and 2.7. As was the case for the vibrational entropy of compound formation, the Debye temperature is not very suc- cessful for predicting the vibrational entropy of alloying. The emphasis of the Debye temperature on low energy phonons makes it less relevant for most of the phonon DOS.
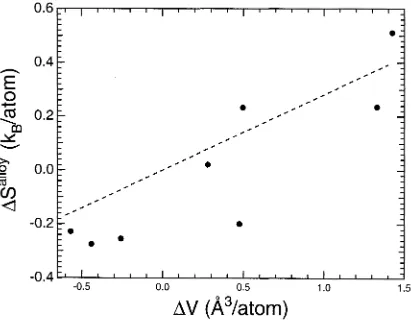
Finally, in figure 2.6 we plot the vibrational entropy of alloying for eight L12 compounds versus the atomic volume change associated with alloying. The correlation is good, with an R value of 0.190. Atomic mass and atomic volume are correlated,
Figure 2.4: The vibrational entropy difference of substitution for Laves, A15 and L12 alloys versus the prediction from equation 2.15. The specific intermetallics being compared are indicated for each data point. The variables
MI,
andM2,
are the atomic masses of the minority constituents of the final and initial states, respectively.R
= [image:36.591.58.439.192.498.2]-3k,ln(O
a110
JO,)
Notes: For consistency,
R
values for all correlations were calculated with sixLIZ
compounds for which all physical parameters were available.
Table 2.2: Correlations with entropy of alloying.
R
0.372 0.208 0.637 0.207 0.280 CorrelationDebye (equation 2.7) Mass (equation 2.8)
Mass plus Griineisen (equation 2.15) Change in atomic volume (W3/atom) Difference in metallic radius
(A)
expansion [75] and classical heat capacity for five
Liz
compounds was 1.82f
0.46. The average Griineisen constant (derived from best fit line t oAV,
see figure 2.6) for the same 5 L l z compounds was 1.04. The lack of agreement is a good indication that equation 2.13 fails to model the observed entropy of alloying, and that the correlation in figure 2.6 may, as stated above, reflect the correlation between atomic volume and atomic mass.Some comparison of the success of the various correlations for the entropy of alloying are presented in Table 2.2. Six
Liz
compounds were chosen for the results of Table 2.2 because bulk moduli were available for them. For consistency, these same six compounds were used for all correlations in Table 2.2.It is important t o note some limitations of the experimental measurements of the phonon DOS curves. The phonon DOS curves for the A15 compounds (Fawcett
,
et al. 1983) were determined in the incoherent scattering approximation, but no attempt was made to correct the experimental DOS curve for differences in neutron scattering cross-sections and masses of the elements. The relative strength of scattering of each element is determined by the quotient of total scattering cross-section and atomic mass. Those phonons that involve primarily the motions of atoms having a small value of this ratio will be under-represented in the experimental phonon DOS. For example, the ratios of total scattering cross-section to mass differ by 60% for Nb and Sn in Nb3Sn, but differ by only about 20 - 25% for the other A15 compounds. The entropy of formation of NbsSn may therefore be in error. The phonon DOSModel
O a l l o ~ -3 kg In rn2jority
0,
c 3/2
\Ll
c3/2 In
+
6 In(
2 9
curves for the bcc alloys listed in Table 2.2 were also obtained in the incoherent scattering approximation (Fawcett et al. 1983), suggesting problems with the V-Ni alloy. Finally, we point out that the phonon
DOS
curves used for the data of Table 2.2 were obtained at temperatures of 300K
and below. For phase transformations at elevated temperatures, anharmonic effects could alter considerably the vibrational entropies.2.4
Summary
Using all available data on phonon densities of states of intermetallic compounds, alloys, and their element a1 metals, we calculated and tabulated the vibrational en- tropies of formation of the alloys and compounds in the harmonic approximation. The range of these entropies of formation, from -0.64 t o $0.55 ks/atom, is larger than the maximum possible range for the configurational entropy of formation of a binary alloy. Vibrational entropies of alloying ranged from -0.35 to 1.0 ks/atom.
We correlated the vibrational entropies of formation to several thermophysical properties of the atoms. The Debye approximation does not account adequately for the structure of the phonon
DOS,
and the Debye model made poor predictions of the vibrational entropy of formation and the vibrational entropy of alloying. ForL12
compounds and A15 compounds, we found that the vibrational entropy of formation
Chapter
3
The Role of Phonons in the
Thermodynamics of the NiTi Martensitic
Transformat ion
3.1
Introduction
T h e intermetallic compound NiTi exhibits the shape memory effect near room tem- perature. This phenomenon involves large, reversible strains, and is closely related t o the martensitic transformation that occurs spontaneously upon heating or cooling. The high temperature 'austenite' has the cubic B2 structure (CsC1 prototype), and the low temperature 'martensite' has a monoclinic B19' structure [76]. Since this martensitic phase transformation is reversible, we expect the austenite to have larger energy and larger entropy than the martensite. The present investigation addresses the entropy. Since the atom motions during the transformation occur by a coopera- tive process, no significant change in configurational entropy can occur. The phase transformation involves no known chemical, electronic or magnetic ordering; hence the entropy should be entirely vibrational.
3 1
ing in the austenite near the martensitic transformation temperature. These studies on NiTi [80, 81, 82, 831, with a single exception 1841, were single-crystal experiments measuring a few phonon dispersion curves. Their focus was on the mechanism by which the phase transformation occurs, not the vibrational entropy. More recently, there have been several experiment a1 and theoretical investigations on the role of vi- brational entropy in solid-state phase transformations [34, 35, 38, 101. The emphasis of this work has been on how differences in vibrational entropy originate from dif- ferences in the phonon density of states (DOS) of the different phases. The present investigation has this same emphasis.
We performed measurements of the phonon
DOS,
heat capacity, transformation ent halpy, thermal expansion, and performed calculations of Born-von KBrmAn lattice dynamics to investigate the vibrational entropy of the martensitic transformation. The neutron scattering and latent heat data gave independent measurements of the entropy. The heat capacity measurements and lattice dynamics simulations were used to check the reliability of the phononDOS
measured by neutron scattering. The phonons implicated in the mechanism of the martensitic transformation, the k =$
[110] 27r/a transverse acoustic phonons, are not sufficient in number to account for the entropy of the transformation. On the other hand, the softness of the acoustic branches in the B2 austenite phase is shown to be responsible for most of the vibra- tional entropy of the phase transformation. The stability of this bcc-like B2 phase seems related to the transverse force const ant between first-nearest neighbors.3.2
Experimental Methods
A
NiTi plate of 0.125 cm thickness was obtained from Shape Memory Applications,Inc., and annealed for 15 min at 700 O C . This annealed plate provided all samples for
the same number of atoms.
Low-temperature heat capacity measurements were performed with a Perkin- Elmer DSC-4 differential scanning calorimeter that had been modified by installing its sample head in a liquid helium dewar. The latent heat measurements were taken using liquid nitrogen as the cryogen. Heating scans were performed from -90 "C to
+
100"
C, at heating rates of 10, 5 and 3"
C
per second. Cooling scans were taken from +I00"C
to -90 "C at cooling rates of 10 and 5 "C per second. All measurements were repeated with the two samples interchanged in the sample pans. Representative data are shown in figure 3.1.-40
0
40
80
Temperature ("C)
Figure 3.1: Representative data of the latent heat upon cooling and heating of the martensite-austenite phase transformation in NiTi. In both cases a background has been subtracted from the raw data.
[image:43.593.58.449.263.530.2]pans. The difference between the pairs of data with samples interchanged is equal to twice the differential heat flow, from which the differential heat capacity was found. The differential heat capacity was added to the heat capacity of Ni [85] to obtain the absolute heat capacity for martensitic NiTi. The result is shown in figure 3.2.
Corrected martensite DOS
Temperature
(K)
Figure 3.2: The low-temperature heat capacity of martensitic NiTi. The filled dia- monds are our calorimetric results. The thin curve was calculated from the neutron- weight corrected martensite phonon DOS derived from low temperature neutron in- elastic scattering (shown in figure 3.6). Dashed line is heat capacity taken from Herget, et al. [84].
Three samples for thermal expansion measurements were cut with a water-cooled diamond saw into rectangular prisms of typically 0.5 x 0.7 x 0.125 cm.
A
Perkin- Elmer TMA 7 with liquid nitrogen as the cryogen was used for measuring the linear thermal expansion from - 160 to $100 OC.
Samples were cycled typically between-160 and +lOO°C at heating (cooling) rates of 20, 10 and 5"C/min. Our best data were obtained at 5 "C/min, and these are shown in figure 3.3.
-150
-100
-50
0
50
100
Temperature ("C)
Figure 3.3: Thermal expansion of NiTi plate in three orthogonal directions. The long dashed line is linear expansion in the direction perpendicular to the plane of the plate. The continuous and short dashed lines are linear expansion in orthogonal direct ions within the plate plane. Data were taken with the sample at low temperature, pro- ceeding to 100°C and then returning to low temperature. Heating and cooling are indicated by arrows.
plate of 7 x 9 x 0.125 cm encased in thin-walled
A1
pans and mounted at a 45 O angleMethod
AS
AH
(kslatom) (J /mol> Calorimetric heating
2
0.41f
0.04 1070 f. 100 Calorimetric cooling 5 0 . 5 6 f 0 . 1 -1300rt200 Calorimetric (section 3.3.1) 0.47 f 0.09 NAt Neutron scattering 0.57 -1 0.03 NA'Ctnot available.
Table 3.1: Enthalpy and entropy of martensite transformation. Calorimetric error bounds were obtained from the statistical variation of the repeated measurements for both heating and cooling.
3.3
Results
3.3.1
Calorimetry
The enthalpy of the martensitic transformation is obtained from the area under the heating and cooling curves in figure 3.1. The entropy can then be calculated by
integrating d Q / T , where
dQ
is the measured heat input, over the temperature range of the phase transformation. A reversible process should provide the same values of AH and AS for heating and cooling, but Table 3.1 shows a discrepancy between the heating and cooling results slightly beyond the error bars.This hysteresis of the phase transformation implies that the transformation to martensite is more dissipative. Assuming this is so, the values of
AS
in Table 3.1 are upper and lower bounds as indicated. Alternatively, by assuming that the heating and cooling ent halpies are in substantial agreement (within error bars), we can calculate AS = AHIT,, where the equilibrium transformation temperature, T,, is assumed to lie equidistant between the heating and cooling transformation start temperatures. This provides a value for AS of 0.476
0.09 kB/atom.3.3.2
Thermal Expansion
Figure 3.3 presents the fractional sample dilatation versus temperature along each orthogonal sample dimension. The anisotropy of the B19' martensite structure and the strong crystallographic texture of the samples caused different dilatations in each direction. The martensitic transformation is evident between -30 and $50 OC, where the linear thermal expansion is interrupted by a large contraction or expansion, de- pending on the axis. Summing the linear transformation dilatations gives a volumetric expansion of -0.2% (i.e., a contraction) upon transformation to martensite.
The transformation start and stop temperatures for heating and cooling agree well with those observed in the calorimetric measurements of the latent heat (figure 3.1). The complicated kinetics observed upon cooling, which appear as the three separate peaks in the cooling curves in figure 3.1, are also observed in the thermal expansion data. The linear expansions measured within the plane of the rolled plate (short dashed and solid lines, figure 3.3) show a kink in slope between 0 and 10°C upon cooling, corresponding to the region between the peaks in latent heat of cooling a t -4 and +12OC (figure 3.1).
The linear thermal expansion was determined by measuring the slopes of the curves in the straight regions above and below the transformation temperature (fig- ure 3.3). For martensite this depends on the crystallographic direction. Summing the linear thermal expansion in all three plate dimensions gives the volumetric thermal expansion, which is independent of the crystallographic texture in the sample. The coefficients of volume thermal expansion are 36
f
3 x 10⁻⁶K-1 for the austenite and 30f.
2 x IO-~K-' for the martensite.3.3.3
Neutron Scattering
3 7
was removed using the runs on the empty container. The data below 3-4 meV are dominated by the large elastic peak, which was stripped from the data by assuming the raw data were linear in energy at small energy transfer.
The first step in obtaining a phonon DOS from the corrected spectra used an iter- ative procedure to calculate the multiphonon contribution t o the measured scattering, and this multiphonon contribution was subtracted from the data
[88].
The 'neutron- weighted' phonon DOS, gNw(E),
is obtained easily from the remaining 1-phonon cross-section. When using this procedure with data from LRMECS, we accounted for the fact that the T O F spectra were obtained a t constant scattering angle, not constant scattering vector. The scattering vector and multiphonon correction there- fore vary with energy transfer, and this dependence is different for the energy spectra from the different angle banks. The sum of the corrected intensities from the upper 6 angle banks was used t o obtain the phonon DOS. Disallowing the data from the lower 6 angle banks eliminates any possible contribution from magnetic scattering, which is greatly suppressed at high Q. Summing over the highest angle banks ensures that a large portion of reciprocal space is sampled at each phonon energy. Figure 3.4 shows that the calculated 1-5 phonoli contribution fits well a typical T O F spectrum of austenite. The amount of the multi-phonon (2-5 phonon) contribution is large at this temperature.Energy Transfer (meV)
Figure 3.4: Raw T O F data compared with the self-convergent multiphonon expansion. The background corrected T O F spectra, at the
1 2 ~ ~
angle bank, of NiTi at 573K
is the bold line. The thin line is the 1-5 phonon contribution as calculated with the procedure of Bogdanoff, Fultz and Rosenkranz [88]. The dashed line is the 2-5 phonon contribution.
and q and j are the phonon wave vectors and polarization branch that specify a single vibrational mode. Here e$ and wqj are the polarization vector for atom d and frequency of mode q,j. Note that g(E) = C d g d ( E ) but the neutron-weighted phonon DOS ~ N ~ ( E ) is given by
3 9
self-consistent neutron-weighted D 0 s . The factor exp[2(W - Wd)] is approximately unity. For the case where ad/md is the same for all species d, gNw(E) m g(E). For the case of NiTi, the quotient of aNi/mNi and aTi/mTi is 3.6, so the correction is potentially large. We need a correction function F(E), where
The correction function F(E) for the austenite DOS was obtained by a Born-von KBrmAn lattice dynamics simulation. Such simulations are often used to generate interatomic force constants by fitting to experimental phonon dispersions. In turn, the force constants can be used to calculate complete lattice dynamics information for the crystal, including the partial DOS, the neutron-weighted DOS, and arbitrary phonon dispersions. The acoustic phonon dispersions in the high symmetry directions are well documented in the literature [80, 81, 82, 891, and the neutron-weighted phonon DOS is known from our measurements. These data provide adequate constraints on the force constants t o allow a hybrid least-squares fit procedure. Our model generates the dispersions of acoustic phonons, which are well-documented, but also generates the neutron-weighted phonon DOS by sampling the phonon frequencies and polarization vectors over the irreducible portion of the Brillouin zone of the B2 structure. The best 16 independent force constants out to 4th nearest neighbors are shown in Table 3.2. These force constants produce a good fit to the neutron-weighted phonon DOS and a fair fit to the known acoustic dispersions.
Using the force constants of Table 3.2, the correction function F(E) is calculated from the lattice dynamics simulations by taking the ratio of the real and neutron- weighted DOS, both of which are generated by the simulation. As with any optimiza- tion scheme, the uniqueness of the fitted force constants is unclear. Nevertheless, the shape and magnitude of the calculated F(E) itself proved rather insensitive to the choice of force constants. This correction function is shown in figure 3.5.
Force Const ants (103dyne/cm)
Ni-Ni Ti-Ti Ni-Ti
Table 3.2: Best fit Born-von KArmAn force constants to NiTi neutron-weighted phonon DOS.
The correction is physically reasonable. Given the lower mass of Ti compared to Ni, we expect the higher-energy modes to have more Ti displacements and the lower- energy modes to have more Ni displacements. Since the scattering is stronger for Ni, the higher-energy modes are under-emphasized in the neutron-weighted DOS. The correction, F(E), should enhance the high energy modes at the expense of the low energy modes. We also expect the correction to become a constant in
E
at low energies in the hydrodynamic limit. We use the sameF(E)
to correct the martensite neutron- weighted DOS. Although the real correction function for martensite is most likely different in detail, we note below that theF(E)
for austenite is successful in providing a martensite phonon DOS that is consistent with the heat capacity measurements on martensite. The corrected and uncorrected (neutron-weighted) martensite DOS are shown in figure 3.5. The corrected austenite and martensite DOS are shown infigure 3.6.
As a test for the reliability of applying the austenite correction function to the g ~ w (E) of the martensite, the heat capacity calculated from the corrected martensite
Figure 3.5: The upper curves show the uncorrected and corrected martensite DOS. The thin curve is the neutron-weighted martensite DOS, obtained by averaging the measurements at 127 and 177 K. The thick curve is the neutron-weighted DOS mul- tiplied by the correction function F(E). The lower plot shows the correction function F(E), derived from Born-von KArmAn lattice dynamics simulation.
Figure 3.6: Phonon DOS of NiTi from
8
to 573K.
The thin curve with error bars is the average of the DOS curves from 127 to 177 K, the bold curve is the 300K
DOS, and the unadorned thin curve is the 573K
DOS.which found no statistically significant softening between the 296 and 406 K data, our measurements to 573
K
seem to show a softening in the DOS.3.4
Discussion
3.4.1
Vibrational Entropy
In the quasi-harmonic approximation, the vibrational entropy of phase A, Sab