Manuscript version: Author’s Accepted Manuscript
The version presented in WRAP is the author’s accepted manuscript and may differ from the published version or Version of Record.
Persistent WRAP URL:
http://wrap.warwick.ac.uk/112800
How to cite:
Please refer to published version for the most recent bibliographic citation information. If a published version is known of, the repository item page linked to above, will contain details on accessing it.
Copyright and reuse:
The Warwick Research Archive Portal (WRAP) makes this work by researchers of the University of Warwick available open access under the following conditions.
Copyright © and all moral rights to the version of the paper presented here belong to the individual author(s) and/or other copyright owners. To the extent reasonable and
practicable the material made available in WRAP has been checked for eligibility before being made available.
Copies of full items can be used for personal research or study, educational, or not-for-profit purposes without prior permission or charge. Provided that the authors, title and full
bibliographic details are credited, a hyperlink and/or URL is given for the original metadata page and the content is not changed in any way.
Publisher’s statement:
Please refer to the repository item page, publisher’s statement section, for further information.
Core crystallisation in evolving white dwarf stars from a pile-up in
the cooling sequence
Pier-Emmanuel Tremblay1,*, Gilles Fontaine2, Nicola Pietro Gentile Fusillo1, Bart H. Dunlap3, Boris T. Gänsicke1, Mark Hollands1, J. J. Hermes3,4, Thomas R. Marsh1, Elena Cukanovaite1
& Tim Cunningham1
Received: 16 August 2018; Accepted: 29 October 2018
1 Department of Physics, University of Warwick, Coventry CV4 7AL, UK
2 Département de Physique, Université de Montréal, C. P. 6128, Succursale Centre-Ville, Montréal, QC H3C 3J7, Canada
3 Department of Physics and Astronomy, University of North Carolina, Chapel Hill, NC 27599, USA 4 Hubble Fellow
White dwarfs are stellar embers depleted of nuclear energy sources that predictably cool
over billions of years at the expense of their leaking thermal reservoir of ions1. These stars,
supported by electron degeneracy pressure, are essential to develop our understanding of
dense plasmas, reaching densities of 107 g/cm3 in their cores2. It is predicted that a first-order
phase transition occurs during white dwarf cooling, leading to the crystallisation of the
non-degenerate carbon and oxygen ions in the core that releases a significant amount of latent
heat and delays the cooling process by about one billion years3.Here we report the presence
of a pile-up in the cooling sequence of white dwarfs within 100 pc of the Sun, using
photometry and parallaxes determined from the Gaia satellite4. Based upon modelling, we
infer that the pile-up arises from the release of latent heat as the cores of the white dwarfs
further slowed by the liberation of gravitational energy from element sedimentation in the
crystallising cores5-7. Our results demonstrate the total energy released by crystallisation in
strongly coupled Coulomb plasmas8-9, and the newly measured cooling delays could improve
the accuracy of using white dwarfs for age-dating stellar populations10.
The white dwarf cooling age at which crystallisation sets in is predicted to depend on the mass
(Fig. 1), with more massive white dwarfs entering this phase transition earlier3. Another major
event in the evolution of a white dwarf is the direct coupling between the degenerate core and the
convective envelope11, resulting in an initial slow down in cooling rates followed by an increase. At the low white dwarf masses (~0.55 M☉) of the old stellar populations in globular clusters, this
event occurs at a similar age as crystallisation but has a stronger signature12. Previous attempts to measure cooling effects from crystallisation in globular clusters have therefore provided indirect
evidence, based on linking the white dwarf and turn-off age determinations13. In contrast,
crystallisation occurs much earlier than convective coupling in white dwarfs more massive than
0.7 M☉. The observational implication of this, predicted over fifty years ago3, is an isolated
crystallisation sequence in the colour versus absolute magnitude Hertzsprung-Russell (H-R)
diagram, yet no direct observational evidence existed until now to characterise this event.
Because of their small radii, typically on the order of 0.01 R☉, white dwarfs are intrinsically faint,
and consequently until recently very few had accurate distance measurements needed to measure
their luminosities14. The second Data Release of the European Space Agency Gaia mission4 (Gaia
DR2) has led to a breakthrough, defining the first empirical cooling sequence of field white dwarfs
dwarfs in old globular clusters16, only a local volume-limited sample will contain white dwarfs
spanning the full ranges of total ages and initial masses17.
We used a recently established catalogue of high-confidence Gaia white dwarf candidates18 to
extract degenerate stars within 100 pc. The selection function of Gaia was found to be colour and magnitude independent down to the sky-position dependent faint magnitude limit18 and the median parallax precision of 1.5 percent allows for unambiguous transformation to distances. For 15,109
sources the Gaia photometry and astrometry are reliable enough to derive the surface temperature, surface gravity, and mass18 by fitting the data to model atmospheres19 and standard evolutionary tracks with 12C/16O core-composition and thick H envelopes11. Sloan Digital Sky Survey (SDSS)
spectroscopy is available for 1309 of the white dwarfs within 100pc, providing their atmospheric
composition.
The 100 pc field white dwarf cooling sequence exhibits a substantial amount of structure (Fig. 2).
The bifurcation into two sub-sequences in the range −0.1 < GBP− GRP < 0.6 has been shownto be
a split between H atmospheres in the upper branch and He-dominated atmospheres in the lower
branch18,20. These two branches correspond to cooling tracks at the median (~0.6 M☉) white dwarf
mass. More massive white dwarfs have larger absolute magnitudes because of their mass-radius
relation21 and are therefore expected to populate the area below the principal branches. A third
separate “transverse” sequence is visible at fainter absolute magnitudes. Unlike the
aforementioned bifurcation, this transverse feature is inconsistent with a single-mass cooling track.
This rules out a simple astrophysical explanation such as effects from the mass loss in
conceivably result in a tight white dwarf mass versus surface temperature correlation unrelated to
the cooling process.
The transverse sequence fully coincides with the range of absolute magnitudes and colours at
which the bulk of the latent heat from crystallisation is released for white dwarfs over the full range
of masses. The crystallisation sequence is more clearly visible when the sample is restricted to
white dwarfs with more simple hydrogen-dominated atmospheres, and for which independent
spectroscopic parameters determined from fitting the hydrogen lines19,22,23 agree with their position
in the H-R diagram (Fig. 3). Roughly eight per cent of sources within the crystallised sequence
harbour large (>2 MG) global magnetic fields detected from Zeeman splitting18.
Helium-atmosphere white dwarfs also populate the cooler and less massive (< 0.7 M☉) area of the
sequence. There is a dearth of massive helium-atmosphere stellar remnants in all parts of the H-R
diagram including the crystallised sequence, which is likely caused by single star evolution not
forming thin-hydrogen layers for higher mass progenitors24. The 100 pc sample was cross-matched
with the Galex, 2MASS, WISE, Pan-STARRS and SDSS photometric data sets, and it was determined that white dwarfs within the transverse sequence are under luminous at all wavelengths
compared to objects on the dominant cooling sequence, and therefore behave as genuine
high-mass objects. We conclude that nothing stands out in the atmospheric properties of the white
dwarfs in the crystallised sequence, apart from a tight correlation between colour and absolute
magnitude. The consistent explanation is crystallisation, a cooling effect that is expected to impact
white dwarfs of similar mass and interior composition at the same age, with little influence from
The crystallised sequence is not a cooling track but a mass-dependent pile-up across the H-R
diagram resulting from the white dwarfs spending more time at this location as they release their
latent heat. To further characterise this process we have extracted the white dwarf luminosity
function in the mass range 0.9-1.1 M☉ from the Gaia 100 pc sample (Fig. 4). Two peaks are clearly
seen in the luminosity function, one at higher luminosities that is attributed to crystallisation, and
the other one at lower luminosities which is unambiguously linked to the finite age of the Galactic
disk10. At lower masses than those considered, crystallisation occurs at fainter absolute magnitudes where it overlaps both with the convective coupling of the core with the envelope and the peak in
the luminosity function caused by the age of the Galactic disk.
We have performed white dwarf population simulations (Fig. 4) assuming constant stellar
formation over the past 10 Gyr, the Salpeter initial-mass function, a standard initial-to-final mass
relation26 coupled with predicted main-sequence lifetimes27, and a Gaia magnitudelimit of G =
20. These input parameters do not influence the slope of the luminosity function where
crystallisation occurs, so we made no attempt to fit them to the observations. In contrast, the three
simulations presented in Fig. 4 use different assumptions about the crystallisation process, showing
a strong influence on the prediction of a peak at −3.75 < log L/L☉ < −2.75. The case without latent
heat release by crystallisation is clearly ruled out by the observations. When latent heat is included
in the modelling, there is, comparatively, a substantial increase of the predicted number of white
dwarfs in the range of luminosity of the observed peak. The Gaia luminosity function is best reproduced when 16O sedimentation is allowed to occur along with the release of latent heat. Compared to the original 12C/16O fluid mixture, sedimentation leaves behind a solid region that is
carbon in the fluid phase is forced upward from a crystallising shell, leading to a release of potential
energy that further delays the cooling7. Note that this third model, with latent heat and phase separation, provides an excellent description of the overall Gaia luminosity function, including its descending branch. The cumulative cooling delay from crystallisation has a direct effect on the
descending branch; stars that have more internal energy become warmer for the same age. The
model bump is not perfectly modelled, as the observed feature is narrower and of higher
magnitude, but its exact shape depends on several choices including the value of the Coulomb
plasma parameter28 (Γ = 175 here), the assumed chemical profile in the core (12C/16O in 50/50
proportions by mass and distributed homogeneously), the envelope stratification (MH/MWD = 10−4
and MHe/MWD = 10−2), as well as possible 22Ne sedimentation9,13. More fundamentally, the
existence and location of this bump provides the extremely strong evidence that the observed
excess of white dwarfs in the Gaia transverse sequence bears the signature of crystallisation.
We report direct evidence that a first-order phase transition really occurs in high-density Coulomb
plasmas3, a theory that cannot be tested in laboratories because of the extreme densities involved, thus providing strong constraints on dense plasma physics7-9,28. Crystallisation significantly slows down the cooling process in white dwarfs and the observations also require the release of
gravitational energy from the separation of an initially homogeneous fluid into a stratified solid
with 16O/12C ratio that increases towards the centre of the star, providing a new method to test nucleosynthesis processes in low and intermediate-mass stars29. The descending branch of the empirical white dwarf luminosity function is heavily impacted by phase separation5-7 and quantum
effects in Debye cooling6,30, necessitating the understanding of these processes when relying on
References
1
Mestel, L. On the theory of white dwarf stars. I. The energy sources of white dwarfs. Mon. Not.
R. Astron. Soc.112, 583-597 (1952).
2 Tassoul, M., Fontaine, G. & Winget, D. E. Evolutionary models for pulsation studies of white
dwarfs. Astrophys. J. Supp. 72, 335-386 (2010).
3
van Horn, H. M. Crystallization of White Dwarfs. Astrophys. J.151, 227-238 (1968).
4 Gaia Collaboration et al. Gaia Data Release 2. Summary of the contents and survey properties.
Astron. Astrophys. 616, A1 (2018).
5
Garcia-Berro, E., Hernanz, M., Mochkovitch, R., & Isern, J. Theoretical white-dwarf luminosity functions for two phase diagrams of the carbon-oxygen dense plasma. Astron.
Astrophys.193, 141-147 (1988).
6 Segretain, L. et al. Cooling theory of crystallized white dwarfs. Astrophys. J. 434, 641-651
(1994).
7
Althaus, L. G., García-Berro, E., Isern, J., Córsico, A. H. & Miller Bertolami, M. M. New phase diagrams for dense carbon-oxygen mixtures and white dwarf evolution. Astron. Astrophys.
537, A33 (2012).
8 Horowitz, C. J., Schneider, A. S. & Berry, D. K. Crystallization of Carbon-Oxygen Mixtures in
White Dwarf Stars. Phys. Rev. Lett.104, 231101 (2010).
9
Hughto J. et al. Direct molecular dynamics simulation of liquid-solid phase equilibria for a three-component plasma. Phys. Rev. E.86, 066413 (2012).
10
Winget et al. An independent method for determining the age of the universe. Astrophys. J.
Lett.315, L77-L81 (1987).
11
Fontaine, G., Brassard, P. & Bergerson, P. The Potential of White Dwarf Cosmochronology.
Publ. Astron. Soc. Pac.113, 409-435 (2001).
12 Obertas, A. et al. The onset of convective coupling and freezing in the white dwarfs of 47
13 Garcia-Berro, E. et al. A white dwarf cooling age of 8 Gyr for NGC 6791 from physical
separation processes. Nature. 465, 194-196 (2010).
14
Bédard, A., Bergeron, P. & Fontaine, G. Measurements of Physical Parameters of White Dwarfs: A Test of the Mass-Radius Relation. Astrophys. J.848, 11 (2017).
15 Gaia Collaboration et al. Gaia Data Release 2: Observational Hertzsprung-Russell diagrams.
Astron. Astrophys. 616, A10 (2018).
16
Hansen, B. M. S. et al. The White Dwarf Cooling Sequence of the Globular Cluster Messier 4.
Astrophys. J. Lett. 574, L155-L158 (2002).
17 Tremblay, P.-E. Kalirai, J. S., Soderblom, D. R., Cignoni, M. & Cummings, J. White Dwarf
Cosmochronology in the Solar Neighborhood. Astrophys. J. 791, 92 (2014).
18
Gentile Fusillo et al. The Gaia Data Release 2 catalogue of white dwarfs and a comparison with SDSS. Submitted to Mon. Not. R. Astron. Soc. Preprint at https://arxiv.org/abs/1807.03315 (2018).
19 Tremblay, P.-E., Ludwig, H.-G., Steffen, M. & Freytag, B. Spectroscopic analysis of DA
white dwarfs with 3D model atmospheres. Astron. Astrophys. 559, A104 (2013).
20
El-Badry, K., Rix, H.-W. & Weisz, D.R. An Empirical Measurement of the Initial-Final Mass Relation with Gaia White Dwarfs. Astrophys. J. Lett.860, L17 (2018).
21
Chandrasekhar, S. The highly collapsed configurations of a stellar mass (Second paper). Mon.
Not. R. Astron. Soc. 95, 207-225 (1935).
22
Kleinman, S. J. et al. SDSS DR7 White Dwarf Catalog. Astrophys. J. Supp.204, 5 (2013).
23
Bergeron, P., Saffer, R.A. & Liebert, J. A spectroscopic determination of the mass distribution of DA white dwarfs. Astrophys. J.394, 228-247 (1992).
24
Kalirai, J. S., Richer, H. B., Hansen, B. M. S., Reitzel, D. & Rich, R. M. The Dearth of
Massive, Helium-rich White Dwarfs in Young Open Star Clusters. Astrophys. J. Lett.618, L129-L132 (2005).
25
26 Kalirai, J. S. et al. Ultra-Deep Hubble Space Telescope Imaging of the Small Magellanic
Cloud: The Initial Mass Function of Stars with M < 1 Msun. Astrophys. J.763, 110 (2013).
27
Bertelli, G., Nasi, E., Girardi, L. & Marigo, P. Scaled solar tracks and isochrones in a large region of the Z-Y plane. II. From 2.5 to 20 Msun stars. Astron. Astrophys. 508, 355-369 (2009).
28 Potekhin, A. Y. & Chabrier, G. Equation of state of fully ionized electron-ion plasmas. II.
Extension to relativistic densities and to the solid phase. Phys. Rev. E.62, 8554-8563 (2000).
29
Marigo, P. Chemical Yields from Low- and Intermediate-mass Stars: Model Predictions and Basic Observational Constraints. Astron. Astrophys.370, 194-217 (2001).
30 Mestel, L. & Ruderman, M. A. The energy content of a white dwarf and its rate of cooling.
Mon. Not. R. Astron. Soc. 136, 27-38 (1967).
Acknowledgements
The research leading to these results has received funding from the European Research Council
under the European Union's Horizon 2020 research and innovation programme n. 677706 (WD3D)
and under the European Union's Seventh Framework Programme (FP/2007- 2013) / ERC Grant
Agreement n. 320964 (WDTracer). This work has made use of data from the European Space
Agency (ESA) mission Gaia (https://www.cosmos.esa.int/gaia), processed by the Gaia Data
Processing and Analysis Consortium (DPAC,
https://www.cosmos.esa.int/web/gaia/dpac/consortium). Funding for the DPAC has been provided
by national institutions, in particular the institutions participating in the Gaia Multilateral
Agreement. Support for J.J.H. was provided by NASA through Hubble Fellowship grant
#HST-HF2-51357.001-A, awarded by the Space Telescope Science Institute, which is operated by the
Association of Universities for Research in Astronomy, Incorporated, under NASA contract
Author Contributions
P.-E.T. and B.D. have identified and characterised the empirical crystallisation sequence. G.F.
made the evolutionary white dwarf models used in this work. N.P.G.F., M.H., and T.C. constructed
the Gaia white dwarf sample employed in this study and performed the cross-match with other
photometric and spectroscopic surveys. P.-E.T., B.G., T.M., J.J.H. and G.F. wrote the text and
participated in the elaboration of the argument for a crystallisation sequence. E.C. and T.C.
characterised the accuracy of Gaia measurements and derived parameters for white dwarfs.
Author Information
Reprints and permissions information is available at www.nature.com/reprints. The authors
declare no competing financial interests. Correspondence and requests for
materials should be addressed to P.-E.T. ([email protected]).
Data Availability Statement
The Gaia DR2 catalogue of white dwarfs used in this study is available from the University of
Warwick astronomy catalogues
repository, https://warwick.ac.uk/fac/sci/physics/research/astro/research/catalogues/gaia_dr2_wh
ite_dwarf_candidates_v2.csv. All modelling was performed with our extensive white dwarf
evolution code. We have opted not to make this multi-purpose code available, but the cooling
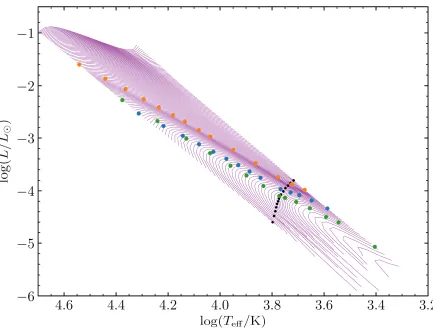
Fig. 1 | Illustration of the effects of crystallisation on the cooling of white dwarfs. The closely
spaced isochrones in effective temperature-luminosity space connect white dwarfs of the same age
(log tcool = 7.5 [yr] at the top, with subsequent increments of Δlog tcool = 0.02) but with different
masses (from 0.4 M☉ on the low-Teff sides of the isochrones to 1.3 M☉ on the high-Teff sides). The
(variable) density of these many isochrones indicates graphically phases of slowing down and of
accelerated cooling. All models are for standard pure-hydrogen atmosphere DA white dwarfs with
the same envelope stratification (MH/MWD = 10−4 and MHe/MWD = 10−2) and core composition
(12C/16O in 50/50 proportions by mass fraction, and homogeneously distributed)11. The models include the release of latent heat, but no additional energy source associated with phase separation 5-7
evolving model in selected evolutionary sequences. At that point, as the crystallisation front
progresses upward in the star from the centre, latent heat is liberated, forming a crest of isochrones
taking the shape of a “transverse” sequence. Since the internal energy is discontinuous between
the liquid and solid phases, this is a predicted phase transition of the first order3. The series of blue
dots indicates the location where 80% of the mass has solidified. Following this event, the most
significant effect of crystallisation on the cooling of white dwarfs is the so-called Debye cooling
phase6,11, i.e., the transition, in the solid state, from the classical regime to the quantum regime,
indicated through a series of green dots. Finally, the onset of the coupling between the upper
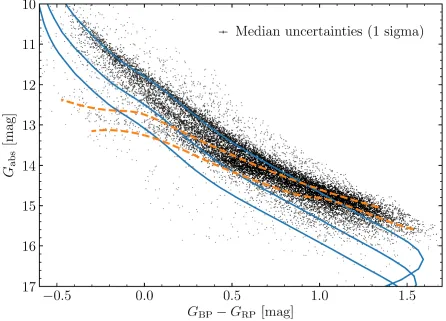
Fig. 2 | Observational Gaia colour-magnitude H-R diagram for white dwarfs within 100 pc.
Dereddened G, GBP, and GRP photometry along with parallaxes are used for 15,109 white dwarf
candidates with Gaia data reliable enough to derive atmospheric parameters18. For visualisation purposes, the data are shown in a greyscale according to a Gaussian kernel density estimate, and
with a power-law scaling of exponent 0.25. Two orange dashed sequences illustrate where
evolutionary models predict that 20% (top sequence) and 80% (bottom sequence) of the total white
dwarf mass has crystallised. The higher density of white dwarfs within that region corresponds to
the transverse sequence discussed in the text. Three evolutionary models at 0.6, 0.9, and 1.1M☉
from the top to bottom (blue solid lines) illustrate the evolution of H-atmosphere white dwarfs
tracks in the range −0.1 < GBP− GRP < 0.6, and above the orange-dashed curves, is not caused by
crystallisation but has been interpreted as the different positions of hydrogen- and
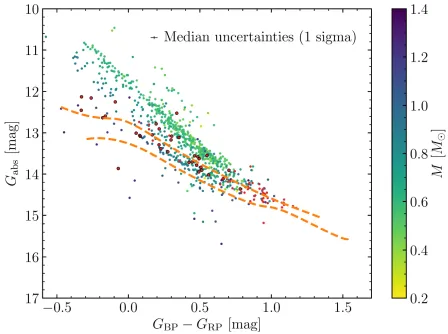
Fig. 3 | Observational Gaia H-R diagram for white dwarfs with SDSS spectra. Included are
798 objects within 100 pc that show the presence of hydrogen Balmer lines and no helium lines or
red excess from a companion18. White dwarfs are colour coded (see right-hand scale) for their independent spectroscopic masses19,22,23 except when lines are too weak to derive masses (σM/M >
50%, red dots), or there is evidence of a magnetic field (>2 MG) from Zeeman line splitting (red
dots with black outlines). Two orange dashed sequences illustrate where evolutionary models
predict that 20% (top) and 80% (bottom) of the total white dwarf mass has solidified. This region
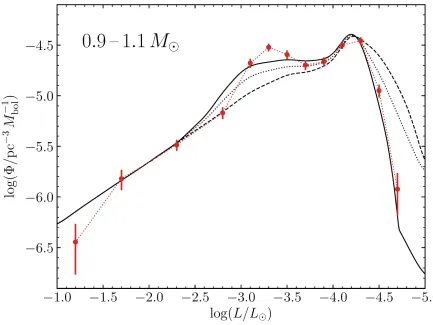
Fig. 4 | Luminosity function for massive white dwarfs within 100 pc. Stellar remnants with
Gaia derived masses between 0.9 and 1.1 M☉ were used to calculate the observed luminosity
function (connected red dots). Error bars are from number statistics (1 sigma). The first peak on
the left is a direct observational signature of crystallisation in white dwarfs. The second peak on
the right followed by a sharp drop off at smaller luminosities is caused by the finite age of the
Galactic disk10. Three different predicted luminosity functions are employed to illustrate the physics of crystallisation. All models use the same assumptions on Galactic evolution, including
an age of 10 Gyr for the disk. In the standard case (solid line) both the latent heat released from
crystallisation and the gravitational energy released from 16O sedimentation are included. The
dashed curve neglects both latent heat and phase separation. In the latter case the equation-of-state
still transits from liquid to solid as otherwise the solution is not physical. The three models are