The technological quality of wheat for milling and baking use varies in a wide range. Variety composition is one of the most important factors and it causes protein and starch quality changes. The most important factor is the strength given by gluten quality and content, and also starch-amylase-complex properties (enzymatic activity, starch particles damage). These properties are observed by means of different methods (Po-meranz 1988).
Protein amount and quality according to Zeleny test, which is an empirical method, are the first sorting traits for wheat quality evaluation. Rheolog-ical characteristics such as elasticity, viscosity, and extensibility and their changes during fermentation are also important for the bakery industry. A lot of empirical techniques based on dough rheology
are commonly used for the analysis of wheat flour baking value. The information on the behaviour of fermented dough can be obtained from such apparatuses as fermentograph, maturograph, and OTG. Czuchajowska and Pomeranz (1993) developed a methodology to assess fermentation with the use of rheofermentometer and a short-ened baking test on the bread-making machine. Usual physical dough tests do not appear to meas-ure the properties that are directly important for the bread-making performance. The success of these tests, which measure dough rheological properties, may result from the correlation with the parameters that directly influence wheat and flour behaviour in the mill (flour yield) and the bakery (bread volume) (Janssen et al.1996). The formula of dough also influences the properties
Bread Features Evaluation by NIR Analysis
Ondřej JirSa, Marie HruškOVá and ivan šVeC
Department of Carbohydrate Chemistry and Technology, Faculty of Food
and Biochemical Technology, institute of Chemical Technology in Prague,
Prague, Czech republic
Abstract
Jirsa O., Hrušková M., Švec I. (2007): Bread features evaluation by NIR analysis. Czech J. Food Sci.,
25: 243–248.
Bakery characteristics of wheat dough and the final product and their predictability by NIR technique was investi-gated using 231 variety and commercial wheat samples (crop years 2003–2005). The behaviour of doughs was assessed with Brabender maturograph and OTG (Germany), the final product quality was evaluated by the baking test and image analysis. NIR spectra of flours were acquired on a NIRSystem 6500 spectrometer. Calibration equations for the selected rheological characteristics were computed by WINISI II using mPLS regression. The quality of predic-tion was evaluated by means of coefficients of correlapredic-tion between measured and predicted values from cross and independent validation. A statistically significant dependence (with probability higher than 99%) was found with all rheological characteristics. The standard errors of cross-validation were achieved as follows: dough elasticity 16 BU, bread volume (11 min) 58 BU, specific loaf volume 34 cm3/100 g, bread cut area 2.6 cm2, penetration 4.1 mm, average
cell area 0.4 mm2 and cells per cm2 7.4.
of leavened dough. Full-bread-formula is usually used for dough fermentograph testing (Švec & Hrušková 2004).
The aim of these measurements is to predict the material behaviour in the technological process or to get data for the implementation of timed operational actions. Therefore, it is necessary to obtain rheological data with sufficient accuracy. Traditional methods for the determination of rheological properties take a few tens of min-utes, which is too much to take technological actions.
NIR technique has been widely applied to the measurement of cereal quality and cereal product composition. NIR instruments enable a rapid as-sessment of wet gluten, moisture, ash, and with a lower reliability also the determination of Ze-leny sedimentation and water absorption. These parameters can be predicted with a high degree of accuracy, as the relevant spectral regions show reasonably clear differences with the changing sample composition (Bhandari et al. 2000).
Some success was achieved even with mod-elling some rheological parameters, especially those measured on farinograph (Hrušková et al. 2001), extensigraph (Delwiche et al. 1998; Hrušková et al. 2001), and alveograph (Czucha-jowska & Pomeranz 1991). The main parameter of the breadmaking quality, relating to the protein content/quality, is the specific loaf volume. The possibility of its prediction was confirmed, for instance, by Rubenthaler and Pomeranz (1987). Fermentograph parameters were studied by Jirsa et al. (2005). However, such usefulness was not proved in the case of the breadmaking potential. It was concluded that NIR reflectance spectroscopy cannot provide any measure of the bread-making quality of wheat beyond that which may be pre-dicted from the protein content (Rubenthaler & Pomeranz 1987). The changes taking place during dough mixing can also be observed non-destructively by NIR spectroscopy because spectral absorbances are relative to the basic chemical components of dough. The prediction of dough properties by NIR spectra analysis, however, is influenced by many factors, especially the errors of reference methods and the results dependence on the protein content of the flours tested.
The main aim of this study was to predict the final product and some technological properties from NIR flour spectra and to investigate the relations between them.
MATERIAL AND METHODS
The among of 231 samples of variety and com-mercial wheats from three crop years, 2003–2005, were used for the study as a calibration set. Com-mercial wheats (60 samples) grown in three central Bohemian regions were obtained from an industrial mill. Variety wheats (171 samples) were supplied by SELGEN Stupice, the Crop Research Institute Prague-Ruzyně, and the Agriculture Research Institute Kroměříž (two crop years only). The grain was ground into flour on a laboratory mill Chopin CD1-auto (France).
Flour proteins were characterised by Kjeldahl protein content and Zeleny sedimentation value which were determined according to the Czech standard methods ČSN 560512-12 and ČSN ISO 5520, respectively.
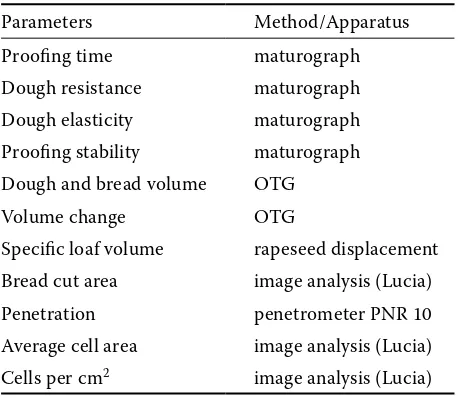
An overview of the rheological parameters is given in Table 1. Technological properties of wheat fermented dough during maturation and oven rising (first stage of baking) were evaluated by maturograph and OTG (Brabender, Germany), re-spectively. Maturograph enables, apart from other characteristics, to determine optimal proofing time to obtain the best volume of the final prod-uct. It is followed by OTG test during which the dough is heated in oil bath. This test can indicate deficiencies in prior baking stages. As these test procedures are not included in any international or Czech standard methods, they were performed according to our internal method. The dough was prepared in the same way as for the baking test.
Table 1. Overview of technological and final product parameters
Parameters Method/Apparatus
Proofing time maturograph
Dough resistance maturograph Dough elasticity maturograph Proofing stability maturograph Dough and bread volume OTG
Volume change OTG
Specific loaf volume rapeseed displacement Bread cut area image analysis (Lucia)
Penetration penetrometer PNR 10
[image:2.595.304.533.557.756.2]The final product quality assessment was accom-plished by the baking test and image analysis. The test was performed according to the Czech method and the formula was as follows: flour 100%, yeast 4%, sugar 1.5%, fat 1%, salt 1.7% and water. The dough was prepared to optimal consistency of 600 ± 20 BU in the farinograf from 300 g of flour. Dividing and moulding of the dough was made by hand, the loaves were baked at 240°C for 14 min after 50 min of leaving (Švec & Hrušková 2004).
Crumb characteristics were described by penetra-tion (penetrometer PNR 10, Germany) and image analysis (Lucia, Czech Republic). For the latter, a Cohu 2252 TV CCD camera with a controllable central and two point source lights was used. As the base for the image scanning, a fluorescent lamp was used. Two digital images were processed and four measurements (field of view 9 × 7 mm) were analysed in each quadrant of the image. This pro-vided 32 images for one bread picture. Parameters includingtotal cell number, total cell area, the mean cell area were investigated; cells/cm2 and cell to total area ratio were calculated (Švec et al. 2005).
NIR spectra were acquired on a wavelenght scan-ning instrument NIRSystem 6500 (Foss
NIRSys-tems, Inc., USA) using a small ring cup, in the range from 400 nm to 2500 nm and with the wavelenght increments of 2 nm. Diffuse reflectance was re-corded as log(1/R).
NIR Software WINISI II (Infrasoft Int., USA) was used to evaluate the data and to develop chemometric models. No scatter correction and standard MSC were applied. The data were treated by the first derivative (math setting 1, 4, 4, 1, and 1, 8, 8, 1). Spectral outliers were detected by PCA and eliminated before the model development. Calibration was carried out by modified Partial Least Square (mPLS) regression. Outlier samples were eliminated in two passes and cross-validation with ten groups was used. The best calibration equations were selected according to the lowest standard error of cross-validation (SECV).
RESULTS AND DISCUSSION
[image:3.595.63.532.444.736.2]To illustrate the characteristics of the sample set, the mean, range, and variation coefficient are given in Table 2. The quality of wheat flours cor-responded to Czech standard for the mill products of fine type. Almost the whole set is represented
Table 2. Flour, dough, and final product parameters
Parameters Mean Range Coefficient of variation (%)
min. max.
Kjeldahl proteina (%) 11.9 8.6 16.1 9.4
Zeleny sedimentation (ml) 48 21 72 24.1
Proofing time (min) 37.4 26.0 60.0 15.4
Dough level (BU) 714 450 1165 16.8
Dough elasticity (BU) 220 100 305 11.5
Proofing stability (BU) 8.0 2.0 18.0 40.7
Dough volume (BU) 390 260 565 14.5
Bread volume (11 min) (BU) 533 315 785 15.3
Bread volume (BU) 535 380 858 13.3
Volume change (BU) 145 -55 365 43.0
Specific loaf volume (cm3/100 g) 328 200 459 16.6
Bread cut area (cm2) 34.1 19.2 47.6 10.0
Penetration (mm) 15.8 5.4 28.9 31.6
Average cell area (mm2) 1.4 0.1 12.1 84.8
Cells per cm2 32.9 4.8 69.0 34.6
by breadmaking flours which cover a wide range of breadmaking quality. It is advisable for the calibration to ensure the widest feasible range of values. The typical variation is about 15%. Higher variations from technological part exhibit two traits: proofing stability and the change of volume during oven rising. The former can be influenced by a worse readout accuracy. Also, the penetra-tion test and image analysis are distinguished by higher variation, especially the average cell area, which includes many outliers; thus the distribu-tion is skewed.
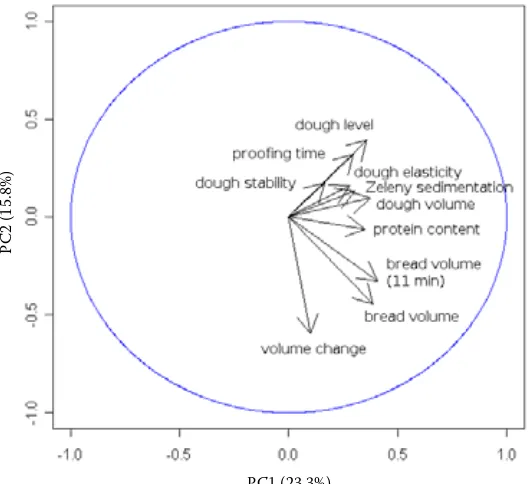
The traits relationships were examined by help of PCA and correlation matrix. Figures 1 and 2 show PCA plots for the technological and final product traits, both including two analytical ones (protein and Zeleny sedimentation). The two plots represent here 39.1 and 48.7% of the total variance, respectively. Maturograph parameters (i. e. proof-ing) on Figure 1 are mutually highly correlated. There is a group of two bread volume parameters (11 min and final), which are also correlated with the specific loaf volume (r = 0.684 and r = 0.605, respectively). The baking parameters appear to be more influenced by the protein content than the protein quality (Zeleny sedimentation).
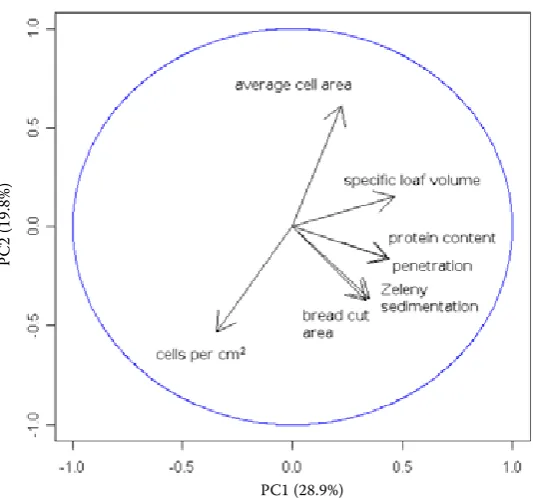
Figure 2 shows a high positive correlation of Kjeldahl protein (protein quantity indicator) with penetration (crumb stiffness indicator), and Zeleny sedimentation (protein quality indicator) with bread cut area (measure of volume), although
clas-sical correlations (r) are 0.475 and 0.354, respec-tively. Negative correlation (r = –0.600) between the average cell area and cells per cm2 is expectable. The specific loaf volume is determined by both protein and gas formation. The differences in the protein content seem to have a higher influence on the specific volume than the differences in the protein quality in this sample set (r = 0.548 and 0.304, respectively).
Only two technological traits were selected for the calibration. These are dough elasticity obtained from maturograph, and the bread volume after 11 min. The former is a very important parameter to judge the dough quality, and maturograph is the only technological apparatus directly measuring elasticity of fermented dough. The latter repre-sents the moment at which the temperature of oil bath reaches 63°C and the enzymes are becoming inactivated.
[image:4.595.64.330.510.752.2]PCA was used also for NIR spectra, whereas six of them were identified as outliers and elimi-nated. Standard errors and correlation coefficients of the calibration models are shown in Table 3. Bakery traits (except the specific loaf volume) involve a lower number of samples because they were unavailable for one subset (20 samples). A statistically significant dependence between the predicted and the reference values with probability higher than 99% was found for all parameters. An acceptable prediction accuracy (CV about 10%) was found with Zeleny sedimentation, dough
Figure 1. The relations between technological and analytical traits
PC1 (23.3%)
PC
2
(1
5.
8%
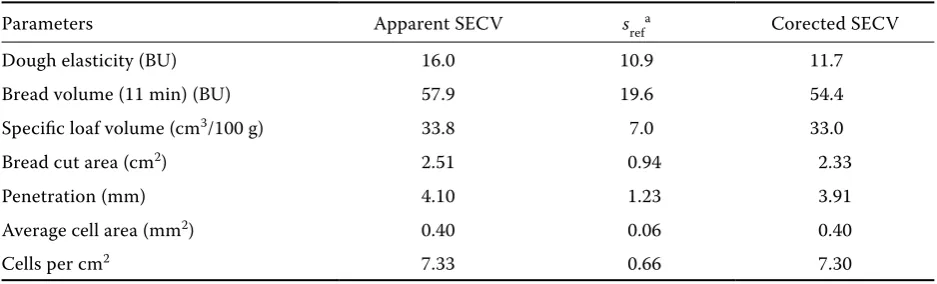
elasticity, baking volume (11 min), specific loaf volume, and bread cut area. Similar results of SECV = 5.6 ml and 36 cm3/100 g were achieved for Zeleny sedimentation and specific loaf vol-ume, respectively, in a previous study (Jirsa et al. 2005). Penetration and image analysis models, however, posses two or three times higher vari-ance. Table 4 gives an overview of laboratory er-rors (measured as repeatability by Kostelanská 2006) and corrected SECV for technological and bakery traits. Corrected SECV (i.e. true model errors) are, generally, significantly higher than the laboratory errors. Only in the case of dough elasticity the two errors are comparable.
CONCLUSIONS
[image:5.595.65.332.82.331.2]NIR technique was used to predict the techno-logical and the final product qualities. A statistically significant dependence between the predicted and the reference values with probability higher than 99% was found with all parameters. The potential of NIR technique as known from literature and experience was confirmed for the prediction of the protein content and Zeleny sedimentation. Some traits, such as dough stability, bread volume (11 min), specific loaf volume, and bread cut area seem to be prospective at least for rough screening. The selection of NIR reflectance spectra to predict
Table 3. Calibration and cross-validation
Parameters n Calibration Cross-validation
factors SECV CV (%) r2 SECV CV (%) r2
Kjeldahl protein (% DM) 218 12 0.11 0.9 0.991 0.13 1.1 0.986
Zeleny sedimentation (ml) 215 13 3.57 7.3 0.905 4.87 10.0 0.824
Dough elasticity (BU) 217 5 15.2 6.9 0.458 16.0 7.3 0.402
Bread volume (11 min) (BU) 215 3 55.8 10.5 0.432 57.9 10.9 0.392
Specific loaf volume (cm3/100 g) 218 7 30.8 9.4 0.661 33.8 10.3 0.591
Bread cut area (cm2) 202 7 2.21 6.5 0.498 2.51 7.4 0.350
Penetration (mm) 202 7 3.60 22.8 0.471 4.10 26.0 0.316
Average cell area (mm2) 193 7 0.35 29.7 0.581 0.40 33.7 0.469
[image:5.595.63.537.566.757.2]Cells per cm2 197 7 6.55 20.5 0.610 7.33 22.9 0.514
Figure 2. The relations between final product and analytical traits
PC1 (28.9%)
PC
2
(1
9.
8%
bread crumb texture characteristics, however, did not yield satisfactory results. Next study should be focused on improving the presented models using future wheat crops.
References
Bhandari D.G., Millar S.J., Scotter C.N.G. (2000): Prediction of wheat protein and HMW-gluten contents by near infrared (NIR) spectroscopy. In: Shewry P.R., Tatham A.S. (eds.): Wheat Gluten. Royal Society of Chemistry, Cambridge: 313–316.
Czuchajowska Z., Pomeranz Y. (1991): Evaluation of vital dry gluten composition and functionality in breadmaking by near-infrared reflectance spectroscopy. Cereal Foods World, 36: 439–440, 442, 444–446. Czuchajowska Z., Pomeranz Y. (1993): Gas
forma-tion and gas retenforma-tion I. The system and methodology. Cereal Foods World, 38: 499–503.
Delwiche S.R., Graybosh R.A., Peterson C.J. (1998): Predicting protein and biological properties of HRW wheat by NIR. Cereal Chemistry, 75: 412–416. Hrušková M., Bednářová M., Novotný F. (2001):
Wheat flour dough rheological characteristics predicted by NIRSystems 6500. Czech Journal of Food Sciences,
19: 213–218.
Janssen A.M., van Vliet T., Vereijken J.M. (1996): Fundamental and empirical rheological behavior of wheat flour doughs and comparison with breadmaking performance. Journal of Cereal Science, 23: 43–45. Jirsa O., Hrušková M., Švec I. (2005): Prediction of
fermented wheat dough behaviour. Getreidetechnolo-gie, 58: 145–151.
Kostelanská M. (2006): Analýza jakostních znaků pšeničného pečiva. [Diplomová práce.] VŠCHT, Pra-ha.
Pomeranz Y. (1988): Wheat II. AACC, St. Paul. Rubenthaler G.L., Pomeranz Y. (1987): Near-infrared
reflectance spectra of hard red winter wheats varying widely in protein content and breadmaking potential. Cereal Chemistry, 64: 407–411.
Švec I., Hrušková M. (2004): Wheat flour fermentation study. Czech Journal of Food Sciences, 22: 17–23. Švec I., Hrušková M., Jirsa O. (2005): Image data of bread
crumb structure. In: Proceedings 32nd International Conference of Slovak Society of Chemical Engineering, Tatranské Matliare, 23.–27. 5. 2005.
Received for publication January 16, 2007 Accepted after corrections April 27, 2007
Corresponding author:
Ing. Ondřej Jirsa, Vysoká škola chemicko-technologická v Praze, Fakulta potravinářské a biochemické technologie, Ústav chemie a technologie sacharidů, Technická 5, 166 28 Praha 6, Česká republika
[image:6.595.63.532.101.243.2]tel.: + 420 224 353 120, fax: + 420 233 199 990, e-mail: [email protected]
Table 4. Comparison of apparent and corrected SECV for technological and final product quality trakte
Parameters Apparent SECV srefa Corected SECV
Dough elasticity (BU) 16.0 10.9 11.7
Bread volume (11 min) (BU) 57.9 19.6 54.4
Specific loaf volume (cm3/100 g) 33.8 7.0 33.0
Bread cut area (cm2) 2.51 0.94 2.33
Penetration (mm) 4.10 1.23 3.91
Average cell area (mm2) 0.40 0.06 0.40
Cells per cm2 7.33 0.66 7.30