Received 30 October 2019 Accepted 28 December 2019
Edited by M. Weil, Vienna University of Technology, Austria
Keywords:crystal structure; salts; hydrogen bonds; Hirshfeld surface.
CCDC reference:1974526
Supporting information:this article has supporting information at journals.iucr.org/e
Crystal structure and Hirshfeld surface analysis of
1,2,4-triazolium hydrogen oxalate
Nutcha Ponjan,aPurita Aroonchatband Kittipong Chainoka*
aMaterials and Textile Technology, Faculty of Science and Technology, Thammasat University, Khlong Luang, Pathum
Thani, 12121, Thailand, andbScience Classroom in University-Affiliated School Projects (SCiUS), Suankularb, Wittayalai Rangsit School, Muang, Pathum Thani 12120, Thailand. *Correspondence e-mail: [email protected]
The asymmetric unit of the title 1:1 salt 1,2,4-triazolium hydrogen oxalate, C2H4N3
+ C2HO4
(I), comprises one 1,2,4-triazolium cation and one hydrogen oxalate anion. In the crystal, the hydrogen oxalate anions are linked by O— H O hydrogen bonds into chains running parallel to [100]. In turn, the anionic chains are linked through the 1,2,4-triazolium cations by charge-assisted +N— H Ohydrogen bonds into sheets aligned parallel to (011). The sheets are further stacked through – interactions between the 1,2,4-triazolium rings [centroid-to-centroid distance = 3.642 (3) A˚ , normal distance = 3.225 (3) A˚, slippage 1.691 A˚ ], resulting in the formation of a three-dimensional supra-molecular network. Hirshfeld surface analysis of the title salt suggests that the most significant contributions to the crystal packing are by H O/O H and H N/N H contacts involving the hydrogen bonds.
1. Chemical context
The oxalate anion (C2O4 2–
), i.e.the complete deprotonation product of oxalic acid (C2H2O4), is a small, rigid, planar
species and has been widely used as a ligand in the formation of coordination polymers (Gruselleet al., 2006; Abrahamet al., 2014). This ligand possesses four electron-donating O atoms and can display versatile coordination modes upon metal complexation. As a result, a large number of compounds with multi-dimensional coordination networks with short inter-metallic distances have been synthesized along with the investigation of interesting properties (Clemente-Leo´net al., 2011). During our synthetic efforts to develop novel lantha-nide coordination polymers with rigid, short, organic ligands including the oxalate anion, the title salt C2H4N3
+ C2HO4
(I) was obtained unexpectedly from the reaction of terbium(III) chloride hexahydrate, oxalic acid, and 1,2,4-triazole in water at room temperature.
Herein, we describe the crystal structure and Hirshfeld surface analysis of the title salt (I).
2. Structural commentary
As shown in Fig. 1, the asymmetric unit consists of one 1,2,4-triazolium cation and one hydrogen oxalate anion. In the
hydrogen oxalate anion, the C1—O1 bond to the O atom that carries the H atom is significantly longer [1.3066 (14) A˚ ] than the C1—O2 bond [1.1976 (15) A˚ ], whereas the C2—O3 and C2—O4 bond lengths of the carboxylate group show inter-mediate values [1.2370 (15) and 1.2586 (14) A˚ , respectively]. The hydrogen oxalate molecule is nearly planar with an O2— C1—C2—O4 torsion angle of 2.3 (2). The 1,2,4-triazolium molecule is perfectly planar with a root-mean-square (r.m.s.) deviation (excluding hydrogen atoms) of 0.001 A˚ . The cationic and anionic molecules are coplanar with an r.m.s. deviation of 0.020 A˚ .
3. Supramolecular features
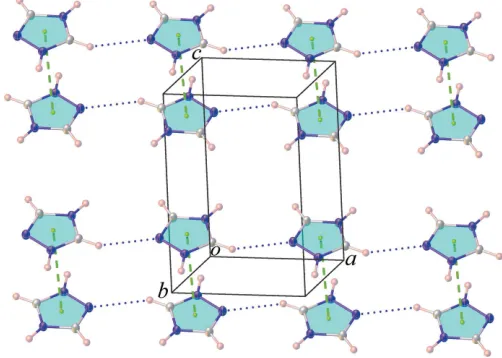
Extensive hydrogen-bonding interactions in the crystal of the title salt (I) are observed, the numerical values of which are collated in Table 1. As shown in Fig. 2, each hydrogen oxalate anion is linked with another anion by O—H O hydrogen bonds into an infinite chain running parallel to [100]. The anionic chains are linked by charge-assisted +N—H O hydrogen bonds involving the 1,2,4-triazolium cations into sheets extending parallel to (011). Additionally, intrasheet C— H O hydrogen and C—H N hydrogen bonds involving the cationic molecules are also observed. The sheets are further stacked through–interactions between the 1,2,4-triazolium rings [centroid-to-centroid distance = 3.642 (3) A˚ , normal distance = 3.225 (3) A˚ , slippage 1.691 A˚], Fig. 3, resulting in the formation of a three-dimensional supramolecular network.
4. Hirshfeld surface analysis
In order to quantify the nature of the intermolecular inter-actions present in the crystal structure, Hirshfeld surfaces (McKinnonet al., 2007) and their associated two-dimensional fingerprint plots (Spackman & McKinnon, 2002) were calcu-lated using CrystalExplorer17 (Turner et al., 2017). The contribution of interatomic contacts to thednormsurface of the
title salt and the individual cations and anions are compared and shown in Fig. 4. In all cases, H O/O H contacts (i.e.
+
N—H O, O—H O, C–H O) were found to be the major contributors towards the Hirshfeld surface, whereas H N/N H contacts (i.e. C—H N) between the 1,2,4-triazolium cations play a minor role in the stabilization of the crystal packing. The differences between the individual fingerprints of cations and anions result from different distri-butions of the C N/N C contacts (i.e.–stacking). It was found that the H H contacts have a relatively small
contri-138
Ponjanet al. C2H4N3+C2HO4 Acta Cryst.(2020). E76, 137–140
[image:2.610.319.564.70.240.2] [image:2.610.313.564.536.715.2]research communications
Table 1
Hydrogen-bond geometry (A˚ ,).
D—H A D—H H A D A D—H A
O1—H1A O4i 0.94 (2) 1.61 (2) 2.5447 (13) 175.0 (18)
N1—H1 O3 0.91 (2) 1.81 (2) 2.7199 (15) 175.4 (18) N2—H2 O4ii 0.96 (2) 1.80 (2) 2.7443 (15) 167.3 (19)
C3—H3 O2iii 0.93 2.40 3.1717 (17) 141
C3—H3 N3iv 0.93 2.58 3.3939 (18) 146
C4—H4 O1 0.93 2.45 3.0289 (16) 120
C4—H4 O3i 0.93 2.30 3.1625 (17) 153
Symmetry codes: (i) x1;y;z; (ii) x1;y1;z1; (iii) x;y1;z1; (iv) xþ1;y;z.
Figure 2
Partial view along [010] of the title salt (I), showing the O—H O and N—H O hydrogen-bonded sheet propagating parallel to (011). C— H O and C—H N hydrogen bonds are omitted for clarity.
Figure 3
A view of the – stacking interactions along with the C—H N
hydrogen bonds in the title salt (I).
Figure 1
[image:2.610.48.303.573.713.2]bution of only 7.7% to the entire Hirshfeld surfaces of the title salt.
5. Database survey
A search of the Cambridge Structural Database (CSD version 5.40, August 2019 update; Groom et al., 2016) for structures with hydrogen oxalate gave 666 hits of which five are hydrogen-bonded salts of triazolium,viz. AFIVAO (Essid et al., 2013) and CIRXEH (Matulkova´et al., 2008), or imidazo-lium, viz. EVAPEX (Zhu, 2011), MEQPAZ (MacDonald et al., 2001) and MEQPAZ01 (Prasadet al., 2002).
6. Synthesis and crystallization
An aqueous solution (5 ml) of oxalic acid (0.09 g, 0.01 mol) and 1,2,4-triazole (0.07 g, 0.01 mmol) was added dropwise to
an aqueous solution (5 ml) of TbCl36H2O (0.37 g, 0.01 mol)
under constant stirring for one h. The resulting solution was filtered to remove any undissolved solid. The filtrate was allowed to slowly evaporate at room temperature. After two weeks, colourless block-shaped crystals of the title salt (I) suitable for X-ray analysis were obtained.
7. Refinement
Crystal data, data collection and structure refinement details are summarized in Table 2. The carboxyl and triazolium H atoms were located in difference-Fourier maps and were freely refined. Carbon-bound H atoms were placed in calculated positions and refined using a riding-model approximation with C—H = 0.93 A˚ andUiso(H) = 1.2Ueq(C).
Acknowledgements
The authors thank the Faculty of Science and Technology, Thammasat University, for funds to purchase the X-ray diffractometer.
Funding information
[image:3.610.45.295.64.463.2]Funding for this research was provided by: The National Research Council of Thailand grant provided by the Tham-masat University (grant No. 4/2561).
Table 2
Experimental details.
Crystal data
Chemical formula C2H4N3+C2HO4
Mr 159.11
Crystal system, space group Triclinic,P1
Temperature (K) 296
a,b,c(A˚ ) 5.592 (1), 7.2162 (12), 8.4021 (13) ,,() 109.148 (6), 93.889 (7), 103.282 (6)
V(A˚3) 307.92 (9)
Z 2
Radiation type MoK
(mm1) 0.16
Crystal size (mm) 0.340.220.22
Data collection
Diffractometer Bruker D8 Quest CMOS
PHOTON II
Absorption correction Multi-scan (SADABS; Bruker, 2016)
Tmin,Tmax 0.638, 0.746
No. of measured, independent and observed [I> 2(I)] reflections
4805, 1524, 1278
Rint 0.038
(sin/ )max(A˚
1
) 0.668
Refinement
R[F2> 2(F2)],wR(F2),S 0.037, 0.102, 1.07
No. of reflections 1524
No. of parameters 112
H-atom treatment H atoms treated by a mixture of independent and constrained refinement
max,min(e A˚
3
) 0.37,0.20
[image:3.610.309.561.91.386.2]Computer programs:APEX3andSAINT(Bruker, 2016),SHELXT(Sheldrick, 2015a), SHELXL(Sheldrick, 2015b) andOLEX2(Dolomanovet al., 2009).
Figure 4
Full two-dimensional fingerprint plots of the title salt (I) (a), and its cation (b) and anion (c); separate contact types for the salt are given in (d)–(h) with relative contributions. Hirshfeld surfaces mapped overdnorm
140
Ponjanet al. C2H4N3+C2HO4 Acta Cryst.(2020). E76, 137–140
research communications
References
Abraham, F., Arab-Chapelet, B., Rivenet, M., Tamain, C. & Grandjean, S. (2014).Coord. Chem. Rev.266–267, 28–68. Bruker (2016). APEX3, SAINT and SADABS. Bruker AXS Inc.,
Madison, Wisconsin, USA.
Clemente-Leo´n, M., Coronado, E., Martı´-Gastaldo, C. & Romero, F. M. (2011).Chem. Soc. Rev.40, 473–497.
Dolomanov, O. V., Bourhis, L. J., Gildea, R. J., Howard, J. A. K. & Puschmann, H. (2009).J. Appl. Cryst.42, 339–341.
Essid, M., Marouani, H., Al-Deyab, S. S. & Rzaigui, M. (2013).Acta Cryst.E69, o1279.
Groom, C. R., Bruno, I. J., Lightfoot, M. P. & Ward, S. C. (2016).Acta Cryst.B72, 171–179.
Gruselle, M., Train, C., Boubekeur, K., Gredin, P. & Ovanesyan, N. (2006).Coord. Chem. Rev.250, 2491–2500.
MacDonald, J. C., Dorrestein, P. C. & Pilley, M. M. (2001). Cryst. Growth Des.1, 29–38.
Matulkova´, I., Neˇmec, I., Teubner, K., Neˇmec, P. & Micˇka, Z. (2008). J. Mol. Struct.873, 46–60.
McKinnon, J. J., Jayatilaka, D. & Spackman, M. A. (2007).Chem. Commun.pp. 3814–3816.
Prasad, R. A., Neeraj, S., Vaidhyanathan, R. & Natarajan, S. (2002).J. Solid State Chem.166, 128–141.
Sheldrick, G. M. (2015a).Acta Cryst.A71, 3–8. Sheldrick, G. M. (2015b).Acta Cryst.C71, 3–8.
Spackman, M. A. & McKinnon, J. J. (2002).CrystEngComm,4, 378– 392.
Turner, M. J., Mckinnon, J. J., Wolff, S. K., Grimwood, D. J., Spackman, P. R., Jayatilaka, D. & Spackman, M. A. (2017). CrystalExplorer17. The University of Western Australia.
sup-1 Acta Cryst. (2020). E76, 137-140
supporting information
Acta Cryst. (2020). E76, 137-140 [https://doi.org/10.1107/S2056989019017304]
Crystal structure and Hirshfeld surface analysis of 1,2,4-triazolium hydrogen
oxalate
Nutcha Ponjan, Purita Aroonchat and Kittipong Chainok
Computing details
Data collection: APEX3 (Bruker, 2016); cell refinement: SAINT (Bruker, 2016); data reduction: SAINT (Bruker, 2016);
program(s) used to solve structure: SHELXT (Sheldrick, 2015a); program(s) used to refine structure: SHELXL
(Sheldrick, 2015b); molecular graphics: OLEX2 (Dolomanov et al., 2009); software used to prepare material for
publication: OLEX2 (Dolomanov et al., 2009).
1,2,4-Triazolium hydrogen oxalate
Crystal data
C2H4N3+·C2HO4−
Mr = 159.11 Triclinic, P1 a = 5.592 (1) Å b = 7.2162 (12) Å c = 8.4021 (13) Å α = 109.148 (6)° β = 93.889 (7)° γ = 103.282 (6)° V = 307.92 (9) Å3
Z = 2 F(000) = 164 Dx = 1.716 Mg m−3
Mo Kα radiation, λ = 0.71073 Å Cell parameters from 2650 reflections θ = 2.6–28.3°
µ = 0.16 mm−1
T = 296 K
Block, light colourless 0.34 × 0.22 × 0.22 mm
Data collection
Bruker D8 Quest CMOS PHOTON II diffractometer
Radiation source: sealed x-ray tube Graphite monochromator
Detector resolution: 7.39 pixels mm-1
ω and φ scans
Absorption correction: multi-scan (SADABS; Bruker, 2016) Tmin = 0.638, Tmax = 0.746
4805 measured reflections 1524 independent reflections 1278 reflections with I > 2σ(I) Rint = 0.038
θmax = 28.4°, θmin = 2.6°
h = −6→7 k = −9→8 l = −11→11
Refinement
Refinement on F2 Least-squares matrix: full R[F2 > 2σ(F2)] = 0.037
wR(F2) = 0.102
S = 1.07 1524 reflections 112 parameters 0 restraints
Hydrogen site location: mixed
H atoms treated by a mixture of independent and constrained refinement
w = 1/[σ2(F
o2) + (0.0441P)2 + 0.0686P] where P = (Fo2 + 2Fc2)/3
supporting information
sup-2 Acta Cryst. (2020). E76, 137-140
Special details
Geometry. All esds (except the esd in the dihedral angle between two l.s. planes) are estimated using the full covariance matrix. The cell esds are taken into account individually in the estimation of esds in distances, angles and torsion angles; correlations between esds in cell parameters are only used when they are defined by crystal symmetry. An approximate (isotropic) treatment of cell esds is used for estimating esds involving l.s. planes.
Fractional atomic coordinates and isotropic or equivalent isotropic displacement parameters (Å2)
x y z Uiso*/Ueq
O1 0.14792 (16) 0.88282 (15) 0.62587 (12) 0.0335 (3)
H1A 0.020 (4) 0.935 (3) 0.674 (2) 0.069 (6)*
O2 0.38612 (19) 1.12875 (18) 0.85543 (14) 0.0506 (3)
O3 0.54794 (17) 0.76994 (15) 0.51985 (12) 0.0365 (3)
O4 0.78723 (16) 1.00344 (15) 0.75427 (12) 0.0345 (3)
N1 0.1358 (2) 0.53625 (17) 0.28813 (14) 0.0305 (3)
H1 0.270 (4) 0.620 (3) 0.367 (2) 0.057 (5)*
N2 −0.0976 (2) 0.30879 (17) 0.06817 (14) 0.0305 (3)
H2 −0.162 (4) 0.201 (3) −0.039 (3) 0.063 (6)*
N3 −0.2527 (2) 0.40637 (18) 0.16122 (14) 0.0352 (3)
C1 0.3594 (2) 0.98777 (18) 0.72504 (15) 0.0264 (3)
C2 0.5818 (2) 0.91101 (18) 0.65830 (15) 0.0249 (3)
C3 0.1335 (2) 0.38679 (19) 0.14421 (16) 0.0304 (3)
H3 0.270783 0.345169 0.104695 0.036*
C4 −0.1040 (2) 0.5435 (2) 0.29349 (17) 0.0340 (3)
H4 −0.155357 0.635686 0.381391 0.041*
Atomic displacement parameters (Å2)
U11 U22 U33 U12 U13 U23
O1 0.0174 (4) 0.0398 (5) 0.0303 (5) 0.0095 (4) 0.0014 (4) −0.0054 (4)
O2 0.0280 (5) 0.0571 (7) 0.0392 (6) 0.0155 (5) −0.0002 (4) −0.0201 (5)
O3 0.0224 (5) 0.0396 (5) 0.0306 (5) 0.0093 (4) 0.0027 (4) −0.0101 (4)
O4 0.0183 (4) 0.0414 (5) 0.0294 (5) 0.0093 (4) −0.0003 (4) −0.0064 (4)
N1 0.0231 (5) 0.0316 (6) 0.0269 (5) 0.0052 (4) −0.0002 (4) −0.0003 (4)
N2 0.0319 (6) 0.0286 (5) 0.0225 (5) 0.0072 (4) 0.0021 (4) −0.0009 (4)
N3 0.0264 (6) 0.0380 (6) 0.0294 (6) 0.0091 (5) 0.0012 (5) −0.0029 (5)
C1 0.0190 (6) 0.0304 (6) 0.0236 (6) 0.0083 (5) 0.0023 (4) 0.0004 (5)
C2 0.0183 (5) 0.0274 (6) 0.0238 (6) 0.0071 (4) 0.0033 (4) 0.0018 (5)
C3 0.0281 (6) 0.0313 (6) 0.0285 (6) 0.0103 (5) 0.0059 (5) 0.0046 (5)
C4 0.0273 (7) 0.0359 (7) 0.0275 (6) 0.0101 (5) 0.0014 (5) −0.0038 (5)
Geometric parameters (Å, º)
O1—H1A 0.94 (2) N2—H2 0.96 (2)
O1—C1 1.3066 (14) N2—N3 1.3677 (16)
O2—C1 1.1976 (15) N2—C3 1.3089 (17)
O3—C2 1.2370 (15) N3—C4 1.2967 (17)
sup-3 Acta Cryst. (2020). E76, 137-140
N1—H1 0.91 (2) C3—H3 0.9300
N1—C3 1.3272 (16) C4—H4 0.9300
N1—C4 1.3568 (18)
C1—O1—H1A 109.1 (12) O2—C1—C2 121.49 (11)
C3—N1—H1 127.8 (13) O3—C2—O4 125.86 (11)
C3—N1—C4 106.09 (11) O3—C2—C1 119.53 (11)
C4—N1—H1 126.1 (13) O4—C2—C1 114.60 (10)
N3—N2—H2 120.4 (13) N1—C3—H3 126.3
C3—N2—H2 128.5 (13) N2—C3—N1 107.36 (12)
C3—N2—N3 111.11 (11) N2—C3—H3 126.3
C4—N3—N2 103.62 (11) N1—C4—H4 124.1
O1—C1—C2 112.90 (10) N3—C4—N1 111.81 (12)
O2—C1—O1 125.61 (12) N3—C4—H4 124.1
O1—C1—C2—O3 3.15 (18) N3—N2—C3—N1 0.08 (15)
O1—C1—C2—O4 −177.26 (11) C3—N1—C4—N3 0.23 (17)
O2—C1—C2—O3 −177.27 (13) C3—N2—N3—C4 0.06 (15)
O2—C1—C2—O4 2.3 (2) C4—N1—C3—N2 −0.18 (15)
N2—N3—C4—N1 −0.18 (16)
Hydrogen-bond geometry (Å, º)
D—H···A D—H H···A D···A D—H···A
O1—H1A···O4i 0.94 (2) 1.61 (2) 2.5447 (13) 175.0 (18)
N1—H1···O3 0.91 (2) 1.81 (2) 2.7199 (15) 175.4 (18)
N2—H2···O4ii 0.96 (2) 1.80 (2) 2.7443 (15) 167.3 (19)
C3—H3···O2iii 0.93 2.40 3.1717 (17) 141
C3—H3···N3iv 0.93 2.58 3.3939 (18) 146
C4—H4···O1 0.93 2.45 3.0289 (16) 120
C4—H4···O3i 0.93 2.30 3.1625 (17) 153