Analysis of Yield Rate in Single Crystal Casting Process
Using an Engineering Simulation Model
Hisao Esaka, Manabu Tamura and Kei Shinozuka
National Defense Academy, Department of Materials Science and Engineering, Yokosuka 239-8686, Japan
A 2-D engineering model for grain selection has been developed taking the columnar dendrite growth theory into consideration. After evaluating this model via a unidirectional solidification experiment, the single-crystal casting process was simulated. Since the time required for calculation is rather short, a statistical analysis has been performed for the first time. The yield rate of well-oriented single crystal is increased by increasing the initial number of grains on the chill plate. However, the yield rate does not exceed approximately 90%. A detailed investigation of the formation mechanism of misorientation has revealed two possible processes (Type A and Type B) that may occur during single crystal casting process.
(Received November 20, 2002; Accepted March 28, 2003)
Keywords: unidirectional solidification, grain selection, turbine blade, preferred growth direction, yield rate, engineering model
1. Introduction
Increasing the operating temperature of turbine blades in generators or jet engines results in energy savings. Structure control performed by process control, as well as material design, is important for the development of heat resistant materials. Turbine blades are made of nickel-base or cobalt-base complex poly-phase alloys. These materials are very difficult or impossible to forge or weld; therefore, turbine blades are usually processed by casting.1,2) Since the mechanical strength at elevated temperatures of the unidir-ectionally solidified blade is superior to that of the poly-crystalline blade, unidirectionally solidified turbine blades have replaced polycrystalline turbine blades. Recently the mechanical strength of single crystal blades at high tempera-ture has been found to be much higher than polycrystalline and unidirectionally solidified blades.
Two processes are used to perform single-crystal casting.2) The first is the seeding method, which uses well-defined seed crystals. The second is the selector method, which involves a chill plate and a selector. During the growth in the selector, favored grains are automatically selected until only one grain remains. The preferred growth direction of the above-mentioned alloys is known to be h001i. The mechanical properties of such alloys, for example creep strength, are not isotropic, andh001isingle crystals oriented along the length of the turbine blade have excellent mechanical strength.1,3) The goal of single-crystal casting is to align theh001isingle crystals along the length of the turbine blade. However, this process does not always yield such turbine blades.2–5)
The purpose of the present study is to analyze the grain selection during growth. A simple engineering model based on the columnar dendrite theory has been developed recently, and using this model, the yield rate of good products and the mechanism of misorientation, which occurs by chance, have been analyzed.
2. Engineering Model
2.1 Background
Each crystal has a preferred growth direction that is based on the anisotropy of surface tension. Alloys used in the construction of turbine blades have a cubic lattice and a preferred growth direction ofh100i.1–5)A technique used for unidirectional solidification in turbine blades controls heat flow unidirectionally via external heaters and coolers. Here, the grains, the growth direction of which is approximately the direction of heat flow, grows over other grains. This process is referred to as grain selection6–8) and consists of the following two steps.6,9)
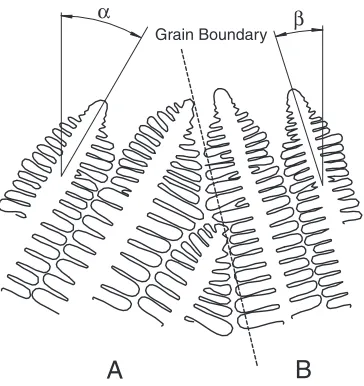
The first step is ‘‘blocking’’, which is observed when two neighboring grains converge as solidification proceeds. Figure1 illustrates the process of blocking, where grain B, which is growing more closely to the heat flow direction,
Grain Boundary
A
B
α β
Fig. 1 A schematic drawing of solid-liquid interfacial morphology at a grain boundary, which is formed by ‘‘blocking’’.
Special Issue on Solidification Science and Processing for Advanced Materials
[image:1.595.336.518.535.728.2]blocks the growth of grain A. Assuming that the traveling velocity of the isotherm is V and that the growth angles are
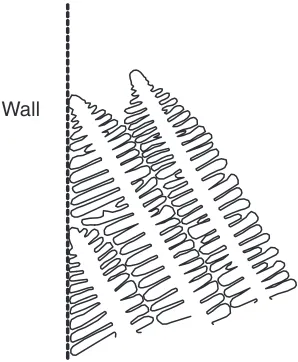
and( > ), as shown in Fig.1, the growth velocities of dendrites in grains A and B are V/cos and V/cos, respectively. Since the growth velocity of the dendrite in grain A is higher than that of the dendrite in grain B, the driving force for the growth of the dendrite in grain A should be greater than that of the dendrite in grain B. Therefore, the dendrite in grain A requires significant undercooling, so that the tip temperature of the dendrite in grain A is lower than that of the dendrite in grain B. Due to the positive temperature gradient, the dendrite in grain B leads to that in grain A. Thus, when the dendrite in grain A approach that in grain B, the dendrites in grain B stop the growth of the dendrite in grain A, since the solutal field around the dendrite in grain B blocks the path of the dendrite tip of grain A, and thus the dendrite in grain A loses its driving force for growth. Recently, D’Souzaet al.10)reported that the primary trunk of grain B stops the growth of grain A instead of the secondary arms of grain B. In any case, grain B always stops the growth of grain A. The grain boundary between grains A and B forms along the direction of growth of grain B and is a straight line, as shown in Fig.1(dotted line). When a grain approaches the sidewall, ‘blocking’ occurs on the wall, as shown in Fig. 2. Here, the wall acts as a grain boundary.
The second step is ‘‘branching’’, which is observed when the two neighboring grains are diverging as solidification proceeds. Figure 3 shows schematically the process of branching. At the grain boundary, which is a relatively wide boundary in this case, not only secondary arms, but also tertiary arms grow into this area, which is largely under-cooled. By competitive growth, one of the tertiary arms becomes a new primary arm. The probability of branching may be independent of the growth direction. Therefore, the grain boundary generated is the bisector of two growth directions and again is a straight line. When a grain heads away from the sidewall, ‘branching’ takes place near the wall, as shown in Fig.4. The wall again acts as a grain boundary for this grain.
As explained above, both in the cases of blocking and
branching, the grain boundaries formed are straight lines. In order to verify this, a unidirectional solidification experiment was performed using succinonitrile-1.3 mass% acetone al-loy.11) The experimental result is shown in Fig. 5. In this case, the temperature gradient and growth velocity are
1:9103Km1and8:66105ms1, respectively.
Block-ing between grains A and B occurs, and the grain boundary formed is parallel to the growth direction of grain A. On the other hand, branching takes place between grains B and C. The grain boundary between grains B and C is the bisector of both growth directions and is a straight line. Grain B disappears when the solid/liquid interface advances up to the point X, as shown in Fig.5. In other words, grain B disappears where its grain boundaries intersect, this is a very important criteria for grain selection.
Wall
Fig. 2 A schematic drawing of dendrites, approaching the inert wall.
Grain Boundary
A
B
Fig. 3 A schematic illustration of solid-liquid interface at a grain boundary, which is formed by ‘‘branching’’.
Wall
[image:2.595.341.513.74.307.2] [image:2.595.368.486.370.554.2] [image:2.595.94.243.577.758.2]2.2 Simulation model
The single-crystal casting process involves a chill plate and a space for grain selection, called the ‘‘selector’’. In addition, a cavity exists in which to form the turbine blade. Molten metal is poured into the mold, and many grains nucleate on the chill plate. Grain selection takes place in the selector, and a single crystal turbine blade is produced. For simplicity, we assume that no special devices, such as a ‘‘pig-tail’’ or a ‘‘zigzag selector’’, are used in the present study. Figure6 illustrates the domain of this model. The growth length from the chill plate,L, is normalized by the width of the chill plate,D.
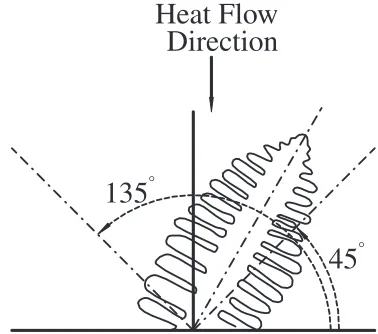
As mentioned above, many grains nucleate randomly on the chill plate. In the model, the diameter and growth direction of the grain are given randomly as the initial condition. Since this is a 2-D model, the grain has two-fold symmetry. Therefore, the range of the growth direction lies between 45 to 135from the isotherm, as shown in Fig. 7.
The initial diameter of the grain ranges from 0:1d0av to
10d0av, whered0avis the average initial diameter of the grain.
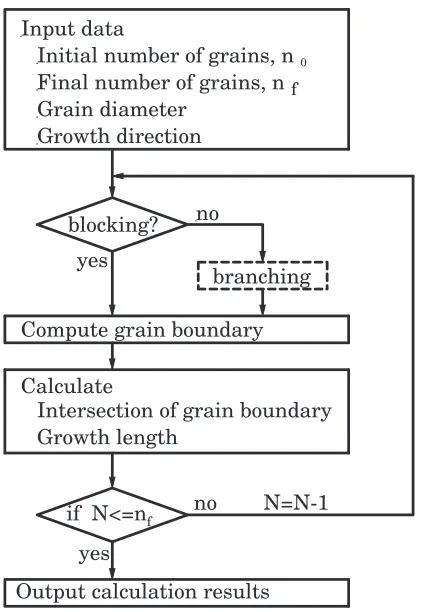
The initial number of grains is a parameter of this model. A simplified flow of the calculation is shown in Fig. 8. Comparing the growth directions of two neighboring grains,
the direction of the grain boundary can be determined. A grain disappears when the grain boundaries intersect each other or the grain boundary intersects the wall of the selector. Every time a grain disappears, the growth directions of neighboring grains are checked again and the direction of the grain boundary is determined. This procedure occurs repeat-edly as solidification proceeds. The growth direction of each grain, as determined randomly as an initial condition, is maintained constant as solidification proceeds. Therefore, once the initial condition is fixed, the process of grain selection would be decided deterministically.
One advantage of the present engineering model is that this model requires little time to obtain calculated results, less than a few seconds when using a personal computer.
The cellular automaton method or modified cellular automaton is a powerful tool to simulate the solidified structure of unidirectional and/or equiaxed solidifica-tion.12–16)In addition, these models can predict the dendritic morphology. However, hours or days are required in order to obtain the result of the single crystal casting process, even when calculated using a workstation. If the purposes of the calculations are to estimate the change in the number of grains with growth or the change in the distribution of
Fig. 5 Grain selection observed in succinonitrile-acetone alloy. Temperature gradient: 1:9103Km1, Growth velocity: 8:66105ms1. Grain B disappeared at X due to grain selection.
D
Growth
Direction
Wall
Wall
Chill Plate
Fig. 6 The domain of the present model.
Heat Flow
Direction
45
°135
° [image:3.595.113.484.73.246.2] [image:3.595.330.519.306.473.2] [image:3.595.73.259.599.766.2]crystallographic orientation with growth, a detailed physical model, such as the cellular automaton method or phase field method, is not necessary.
The newly developed engineering model has the following disadvantages:
(1) Solidification conditions, such as growth velocity and temperature gradient, are not taken into account. Thus, the dimensions of the dendrite, such as dendrite tip radius and primary dendrite spacing, cannot be esti-mated.
(2) Length and time are arbitrary. Definite length cannot be predicted, although the geometry remains similar. Thus, the length can be normalized by a specified length, such as the width of the starter.
(3) Distribution of solute during solidification cannot be estimated.
Although this model has a number of disadvantages, the method enables the events that may occur to be estimated statistically, because this method allows calculation in a short time.
3. Results and Discussion
3.1 Validity of grain selection model
From an engineering perspective, showing the change in number of grains as a function of growth length may be more important than drawing the grain structure. Unidirectional solidification experiments have been performed9) using as-received succinonitrile. The change in the number of grains with growth length was measured when the solid/liquid morphology was dendritic. Here, the number of grains was normalized by the initial number of grains, 16. The growth
length was normalized by the average initial diameter of the grain,d0av. Figure9 shows the experimental results, which
indicates that the number of grains decreases with increasing growth length.
The calculated result of the present model is also shown in Fig.9. When the initial number of grains is small, the scatter of the calculated results becomes large.9) Thus the initial number of grains is fixed to be 160 in this calculation. There is little difference between the experimental and simulation results. The normalized number of grains decreases rapidly in the first stage of solidification and gradually in the latter half of solidification. The present model can also predict this phenomenon.
3.2 Distribution of crystallographic orientation as a function of growth length
The change in the distribution of preferred growth direction of each grain as a function of growth length has been analyzed. The initial number of grains was fixed to be 160. The growth length was normalized by the width of the calculated domain,D, which corresponds to the width of the starter in the single crystal casting process. The growth directions of dendrites are measured as shown in Fig.7, and histograms of the growth angles are analyzed based on growth length. Here, the angles between 45 and 135 are
classified into five groups: group a, 45–63; group b, 63–
81; group c, 81–99; group d, 99–117; and group e, 117–
135.
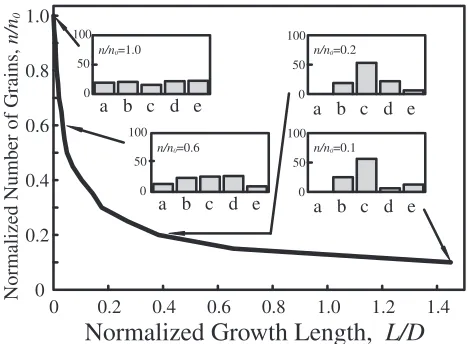
A typical example of the distribution of crystallographic orientation as a function of growth length is shown in Fig.10. In the initial stage, at which the normalized number of grains (n=n0) is 1.0, the growth direction is equally distributed from
45 to 135, since the angles are given randomly. When the
normalized number of grains reaches 0.6 as solidification proceeds, the ratio of largely inclined grains decreases and that of well-aligned grains (81–99in this study) increases.
Whenn=n0 reaches 0.2, approximately 70% of grains fall in
the range of 81 to 99. At the final stage of solidification,
when,n=n0is 0.1, the growth directions of almost all grains
are between 81 and 99. Therefore, one can obtain a good
single crystal in this trial. A number of casting trials produced similar results, as shown in Fig.10.
Input data
Calculate
Intersection of grain boundary blocking?
branching yes
no
if N<=nf
Compute grain boundary
Output calculation results Growth length
no N=N-1
yes
Final number of grains, n f Grain diameter
Growth direction
Initial number of grains, n 0
Fig. 8 Program flow sheet of the engineering model for grain selection.
0 10 20 30 40 50
0 0.2 0.4 0.6 0.8 1
Normalized Growth Length, L / d0av
Nor
maliz
ed Number of Gr
ains ,
n / n
0
[image:4.595.64.275.69.375.2] [image:4.595.313.536.69.232.2]However, some casting trials indicate a different change in growth direction. An example of this is shown in Fig. 11. The change in growth angle distribution during the initial stage of solidification is the same as that shown in Fig. 10. However, even at the final stage of solidification, inclined grains remain. In this case, a grain, theh001iof which is 63.8, is
selected. The direction ofh001iof this grain is 26.2different
from the heat flow direction. This single crystal may exhibit weak mechanical properties and is regarded as a misorienta-tion. Thus, this casting trial can be concluded to be a failure.
3.3 Yield Rate
The number of grains (n) decreases with growth length, as mentioned above. In the latter half of solidification, n
decreases slowly, until one grain is selected. In this study, the simulation was continued until a single grain with a constant width was selected in a semi-infinite selector. The crystal-lographic orientation of the residual grain was then exam-ined.
In practice, the single crystal,h001iof which is within 10 from the heat flow direction, may be applied for operation.2,4) Therefore, in the present study, the residual grain, h001iof which is within 9from the heat flow direction, is defined to
be a good single crystal.
Since the time required for calculation is rather short (within a few seconds), several trials were conducted in order to carry out a statistical analysis. The ratio between the numbers of trials in which good single crystals are obtained to the total number of trials was calculated, and this ratio () is the yield rate.
3.3.1 Effect of initial number of grains
In order to investigate the effect of the initial number of grains (n0) on the yield rate, the calculations were performed
over 100 times while varying n0. The result is shown in
Fig.12. The yield rate rapidly increases with increasingn0.
This deduces that enhancement of the nucleation density on the chill plate is important in order to obtain good single crystal. In addition, the yield rate approaches a constant value with increasingn0. Within the range of the present study, the
maximum yield rate is approximately 90%. In other words, approximately 10% of all castings will fail even if the initial condition of casting can be improved. Few reports indicating the yield rate of good crystallographic orientation in single crystal casting process exist in the literature.2,4)Okamotoet al. have studied the mechanical properties of single crystal turbine blades4)and conducted 14 casting trials and obtained 13 casts with good single crystal. They reported that the direction ofh001iin the failure was approximately 16from the heat flow direction. The yield rate was 13/14 in their casting trials. This value is similar to the calculated result obtained using the present engineering model. Higginbo-tham2)reported a schematic diagram of the deviation ofh001i
in the single crystal casting process and showed that, for some single crystals, theh001ideviated greatly from the heat flow direction. The present model may predict the yield rate of the actual casting process for single-crystal products.
3.3.2 Reasons for the limit of yield rate
There are two cases in which the inclined grain is selected. The first case is that the grain, which is near the inert wall and grows inward, remains (Type A). The second case is that the grains, which converge or diverge, and make the grain boundary approximately parallel to the heat flow direction,
0 0.2 0.4 0.6 0.8 1.0 1.2 1.4
0 0.2 0.4 0.6 0.8 1.0
a b c d e a b c d e
a b c d e
0
n/n0=1.0
n/n0=0.6 n/n0=0.1
n/n0=0.2
50 100 100 50 0 100 50 0 100 50 0
a b c d e
Normalized Growth Length,
L/D
Normalized Number of Grains,
n/n
[image:5.595.53.285.70.246.2]0
Fig. 10 Change in number of grains and distributions ofh001iwith growth length. A well-oriented single crystal is obtained with this trail. Group a: 45–63, group b: 63–81, group c: 81–99, group d: 99–117 and
group e: 117–135.
0 0.2 0.4 0.6 0.8 1.0 1.2 1.4
0 0.2 0.4 0.6 0.8 1.0
a b c d e a b c d e
a b c d e
0 n/n0=1.0
n/n0=0.6 n/n0=0.1
n/n0=0.2
50 100 100 50 0 100 50 0 100 50 0
a b c d e
Normalized Growth Length,
L/D
Normalized Number of Grains,
n/n
0
Fig. 11 Change in number of grains and distributions ofh001iwith growth length. A misoriented single crystal remains with this trail. Group a: 45–
63, group b: 63–81, group c: 81–99, group d: 99–117and group e:
117–135.
50 60 70 80 90 100
0 200 400 600 800 1000
Y
ield Rate
, ( % )
Initial Number of Grains, n0
[image:5.595.52.287.318.490.2]η
[image:5.595.316.535.606.767.2]remain (Type B).
An example of Type A is shown in Fig.13 in the final stage of grain selection. In order to show clearly the grain selection, the scale of normalized growth length is modified. One of outstanding points in this case is that the grain, the preferred growth direction of which is 63.8, is in the left side
of the domain. This inclined grain would remain after grain selection. Another important point is that the preferred growth directions of almost all other grains are approxi-mately, but less than, 90. Furthermore, the growth angle of
grain B, which is just to the right-hand side of grain A, is 89.3, which is quite close to 90. Grain B blocks the growth
of grains A and C. However, the width of grain B gradually decreases as solidification proceeds. Since the growth direction of grains B and C is inclined to the right, grain B finally disappears at the inert wall of the growth domain. No grains would stop the growth of grain A, even though the growth direction is quite far from the heat flow direction. As a result, grain A,h001iof which deviates 26.2 from the heat
flow direction, is selected. This is a failure for the single-crystal casting process.
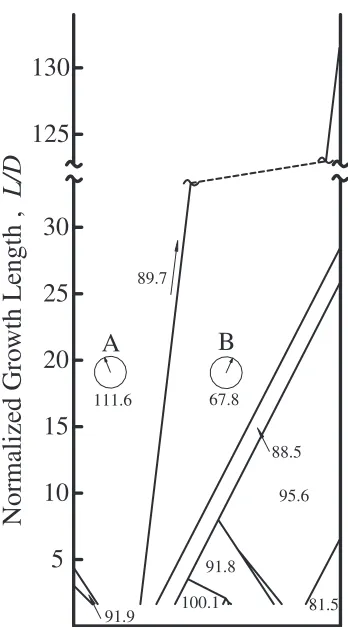
An example of Type B is shown in Fig.14in the final stage of grain selection. In this figure, the scale of normalized growth length is again modified. The growth directions of grains A and B are diverging, and the grain boundary is formed by branching. In this case, the direction of the grain boundary is 89.7, which is rather close to the heat flow
direction. Other grains disappear at the inert wall of growth
domain. Finally, grain A, the growth direction of which is closer to the heat flow direction compared to grain B, is selected. Here, in Fig.14, the diverging case is shown as an example. In the converging case, when the direction of the grain boundary, which is formed by blocking, is parallel to the heat flow direction, the same phenomenon occurs.
The numbers of cases in which the inclined grain is selected are compared between Type A and Type B in the present study. The probabilities of Type A and Type B failures are not the same, and approximately 90% or more failures are classified as Type A. Therefore, eliminating the Type A failures is important in order to increase the yield rate in the single-crystal casting process.
4. Conclusions
An engineering model for grain selection has been developed and applied to the single crystal casting process. Since the time required for calculation is short, a statistical analysis has been performed.
(1) Increasing the yield rate requires the grain density on the chill surface to be increased.
(2) The yield rate does not reach 100%. Approximately 10% of cast trials fail in the single crystal casting process.
(3) There are two cases in which the inclined grain is selected during grain selection. Type A: A grain exists near the inert wall and grows inward the growth
5
10
15
25
60
55
30
20
Normalized Gro
wth Length ,
L/D
82.8 63.8
89.3
93.3
108.4 88.6
71.1 88.2 91.7
A
B
[image:6.595.340.514.67.382.2]C
Fig. 13 Calculated grain structure in the final stage of solidification. In this case, the grain, the angle betweenh001iand isotherm is 63.8, is finally
selected. This is an example of type A defect. The digits in this figure indicate the growth angle of dendrites.
5
10
15
25
130
125
30
20
Normalized Gro
wth Length ,
L/D
111.6 67.8
95.6
91.8 100.1
88.5
81.5 91.9
A
B
89.7
Fig. 14 Calculated grain structure in the final stage of solidification. In this case, the grain, the angle betweenh001iand isotherm is 111.6, is finally
[image:6.595.85.266.73.378.2]domain. Type B: Grains exist which converge or diverge, making the grain boundary parallel to the direction of heat flow.
(4) Type A is more probable than Type B as the mechanism of failure in the single crystal casting process.
Acknowledgments
The authors would like to thank to Tanikawa Fund Promotion of Thermal Technology for financial support.
REFERENCES
1) M. Durand-Charre:The Microstructure of Superalloys, (Gordon and Breach Science Publishers, Netherlands, 1997) pp. 53–66.
2) G. J. S. Higginbotham: Mat. Sci. Technol.2(1986) 442–460. 3) Y. Ohta, Y. G. Nakagawa, A. Ohtomo and Y. Saiga: Bulletin of the Jpn.
Inst. of Metals24(1985) 462–470.
4) K. Okamoto, Y. Kondou, J. Kaneda, A. Yoshinari and Y. Aono: J. Japan Inst. Metals63(1999) 796–805.
5) K. Okamoto, A. Yoshinari, Y. Aono and T. Kato: J. Japan Inst. Metals
63(1999) 1591–1599.
6) D. Walton and B. Chalmers: Trans. Metall. Soc. AIME215(1959) 447–456.
7) W. Kurz and D. J. Fisher: Fundamentals of Solidification, 3rd ed. (Trans. Tech. Publication, Aedermannsdorf, Switzerland, 1992) pp. 63–92.
8) H. Esaka, W. Kurz and R. Trivedi:Solidification Processing 1987, (The Institute of Metals, London, 1988) pp. 168–171.
9) H. Esaka, K. Fujita, H. Daimon, M. Tamura and K. Shinozuka: J. Japan Inst. Metals64(2000) 1206–1211.
10) N. D’Souza, M. G. Ardakani, A. Wagner, B. A. Shollock and M. McLean: J. Mater. Sci.37(2002) 481–487.
11) H. Esaka: Ph. D. Thesis, No. 615, Ecole Polytechnique Federale de Lausanne, Switzerland (1986).
12) M. Rappaz: Int. Mater. Rev.34(1989) 93–123.
13) Ch.-A. Gandin, M. Rappaz and R. Tintillier: Metall. Trans.24A(1993) 467–479.
14) Ch.-A. Gandin and M. Rappaz: Acta Metall. Mater.42(1994) 2233– 2246.
15) M. Rappaz, Ch.-A. Gandin, J.-L. Desbiolles and Ph. Thevoz: Metall. Mater. Trans. A27A(1996) 695–705.